
Software Requirements Prioritisation Using Machine Learning
Arooj Fatima
a
, Anthony Fernandes, David Egan
b
and Cristina Luca
c
School of Computing and Information Science, Anglia Ruskin University, Cambridge, U.K.
Keywords:
Software Requirement Prioritisation, Machine Learning, Classification, Requirements Analysis.
Abstract:
Prioritisation of requirements for a software release can be a difficult and time-consuming task, especially
when the number of requested features far outweigh the capacity of the software development team and diffi-
cult decisions have to be made. The task becomes more difficult when there are multiple software product lines
supported by a software release, and yet more challenging when there are multiple business lines orthogonal
to the product lines, creating a complex set of stakeholders for the release including product line managers and
business line managers. This research focuses on software release planning and aims to use Machine Learning
models to understand the dynamics of various parameters which affect the result of software requirements
being included in a software release plan. Five Machine Learning models were implemented and their perfor-
mance evaluated in terms of accuracy, F1 score and K-Fold Cross Validation (Mean).
1 INTRODUCTION
Software can be found in very diverse applications
(Sommerville, 2016) and embedded software now
makes up a large proportion of that software (Pohl
et al., 2005, p14). With the recent development of
applications for the Internet of Things (IoT) (Ashton,
2009), software is used to unlock the ability of ba-
sic hardware to service multiple applications. There
are different sets of challenges associated with soft-
ware depending on the business and technical envi-
ronment. This paper explores one of these challenges:
the prioritisation of software requirements for soft-
ware releases, with particular focus on a complex use
case of a company that produces wireless microchips
for the IoT. When conflicting demands for additional
features arise and there are insufficient resources for
development, prioritisation of software requirements
becomes very important.
This study reviews the strategy of prioritising
tasks that will take into account the requirements of
a particular class of software system and setting: soft-
ware product lines (SPL) (Devroey et al., 2017) along
with Multiple business lines (MBL) (Pronk, 2002)
and applies machine learning capabilities to the pri-
oritisation strategy. The study examines requirements
data related to a software release cycle in an IoT semi-
a
https://orcid.org/0000-0001-6129-9032
b
https://orcid.org/0000-0003-3456-2522
c
https://orcid.org/0000-0002-4706-324X
conductor company. This data is chosen as it is a good
example of the scale and complexity of SPL/MBL.
We seek to determine how the various inputs to the
requirements prioritisation (RP) and planning process
impact the results of the process: a set of requirements
chosen to be implemented in the release.
The rest of this paper is organized as follows: Sec-
tion 2 investigates the literature and state-of-the-art
studies on the topic; Section 3 describes the proposed
method; Section 4 outlines the results; Section 5 pro-
vides discussion about the results and experiments; fi-
nally the conclusions are drawn in Section 6.
2 LITERATURE REVIEW
Prioritisation of software requirements becomes nec-
essary when there are competing requests for new
functionality with limited development resources
(Wiegers and Beatty, 2013). In this paper we anal-
yse requirements data from a specific type of software
system and context: software product lines (Metzger
and Pohl, 2014) with multiple business lines (Pronk,
2002)(SPL/MBL). SPL engineering enables a fam-
ily of products to be developed by re-using shared
assets (Metzger and Pohl, 2014), (Devroey et al.,
2017), (Montalvillo and Diaz, 2016), which in the
case of IoT may include common utilities, libraries
and pieces of source code that are re-used in multiple
software products, ensuring an efficient and effective
Fatima, A., Fernandes, A., Egan, D. and Luca, C.
Software Requirements Prioritisation Using Machine Learning.
DOI: 10.5220/0011796900003393
In Proceedings of the 15th International Conference on Agents and Artificial Intelligence (ICAART 2023) - Volume 3, pages 893-900
ISBN: 978-989-758-623-1; ISSN: 2184-433X
Copyright
c
2023 by SCITEPRESS – Science and Technology Publications, Lda. Under CC license (CC BY-NC-ND 4.0)
893

use of engineering time. SPL engineering is primar-
ily an engineering solution to enable tailored software
variants and to manage software product variability,
customisation and complexity (Gr
¨
uner et al., 2020),
(Abbas et al., 2020). From an engineering point of
view, product line requirements are handled in the
domain engineering process, while business line re-
quirements are managed in the application engineer-
ing process.
The problem of prioritisation must be looked at
from the point of view of business owners and product
managers. Thus the focus is on making business de-
cisions rather than optimising operational efficiency,
to establish business priorities in a complex software
product environment. When planning a software re-
lease to address SPL/MBL, the challenges come from
the absolute number of requirements to be prioritised
as well as the complexity of the software release in
terms of number of product lines and number of stake-
holders. When multiple product lines are included in
a single software release, one inevitable challenge is
scale: the number of requirements increases as more
products are included in the release. A second chal-
lenge is complexity, as product lines become depen-
dent on shared assets and therefore shared require-
ments for those assets. There is also potential for de-
pendencies between requirements for different prod-
uct lines, which adds further to complexity. Addi-
tional challenges arise when multiple business lines
are involved in the process (Pronk, 2002). Building a
robust product line platform while also creating cus-
tomer or target market specific applications (Metzger
and Pohl, 2014) means satisfying a matrix of stake-
holders with inconsistent or even opposing views on
priority based on their specific product line or mar-
ket segment interest. These three challenges of scale,
complexity and inconsistency of stakeholders must be
considered by any prioritisation method that is to be
used with SPL/MBL.
Simple prioritisation methods work best when
there are small numbers of requirements to prioritise.
For instance, a simple pair-wise comparison (Sadiq
et al., 2021) which requires that each requirement is
assessed against all other requirements takes about
12 hours to execute with just 40 requirements (Carl-
shamre et al., 2001). More advanced prioritisation
and decision-making methods employ simple priori-
tisation methods as a foundation, for example the An-
alytic Hierarchy Process (Saaty, 1977) uses pair-wise
comparison.
The topic of requirements prioritisation contains
the analysis of the role software release planning
plays in software development processes, suggestions
for various RP strategies, and an expanding area of
empirical research focused on comparisons that take
benefits and disadvantages into consideration. (Perini
et al., 2013) differentiate the RP techniques into ba-
sic ranking techniques, which typically permit priori-
tisation along a single evaluation criterion, and RP
methods, which incorporate ranking techniques inside
a requirement engineering process. Relevant project
stakeholders, such as customers, users, and system ar-
chitects conduct rank elicitation, which can be done
in a variety of methods. A fundamental strategy is
ranking each need in a group of candidates in accor-
dance with a predetermined standard (e.g., develop-
ment cost, value for the customer). A requirement’s
rank can be stated as either an absolute measure of
the assessment criterion for the requirement, as stated
in Cumulative voting (Avesani et al., 2015), or as
a relative position with regard to the other require-
ments in the collection, as in bubble sort or binary
search methods. A prioritising technique’s useful-
ness depends on the kind of rank elicitation. For
example, pair-wise evaluation reduces cognitive ef-
fort when there are just a few dozen criteria to be
assessed, but with a high number of needs, it be-
comes expensive (or perhaps impracticable) due to
the quadratic growth in the number of pairings that
must be evoked. The ranking produced by the var-
ious methods includes requirements listed according
to an ordinal scale (Bubble Sort, Binary Search), re-
quirements enlisted as per a rational scale (Analytical
Hierarchy Process (AHP), 100 Points), and as per or-
dinal scale (groups or classes), as in the Numerical
Assignment (Perini et al., 2013).
The scalability of these strategies is directly linked
with the proportional increase of the human effort.
The computing complexity depends also on the num-
ber of criteria (n) to be prioritised, ranging from a lin-
ear function in n for Numerical Assignment or Cu-
mulative Voting to a quadratic function for AHP. In
order to handle numerous priority criteria, more orga-
nized software requirements prioritisation approaches
employ ranking mechanisms (Perini et al., 2013).
The systematic review in (Svahnberg et al., 2010)
investigated 28 papers that dealt with strategic RP
models. 24 out of 28 models of strategic release plan-
ning were considered whereas the remaining investi-
gations are concerned with validating some of the of-
fered models. The EVOLVE-family of release plan-
ning models makes up sixteen of these. Most tech-
niques place a heavy emphasis on strict limitations
and a small number of requirements selection vari-
ables. In around 58% of the models, soft variables
have also been included. The studylacks a validation
on large-scale industrial projects.
Machine Learning (ML) based data analysis, esti-
ICAART 2023 - 15th International Conference on Agents and Artificial Intelligence
894

mation and prediction techniques have grown in pop-
ularity in recent years as a result of improvements in
algorithms, computer power and availability of data.
Traditional methods of requirement prioritisation are
a cumbersome process since there can be too many
patterns to understand and program. Machine Learn-
ing has been used in many areas to analyse large
datasets and identify patterns. Once it is trained to
identify patterns in the data, it can construct an esti-
mation or a classification model. The trained model
can detect, predict or recognise similar patterns or
probabilities.
Duan et al (Duan et al., 2009) proposes partial au-
tomation of software requirements prioritisation using
data mining and machine learning techniques. They
used feature set clustering using unsupervised learn-
ing and prioritised requirements mainly based on the
business goals and stakeholder’s concerns.
Perini et al (Perini et al., 2013) compared Case-
Based Ranking (CBRank) requirements prioritization
method (combined with machine learning techniques)
with Analytic Hierarchy Process (AHP) and con-
cluded that their approach provided better results than
AHP in terms of accuracy.
Tonella et al (Tonella et al., 2013) proposed an In-
teractive Genetic Algorithm (IGA) for requirements
prioritization and compared it with Incomplete Ana-
lytic Hierarchy Process (IAHP). They used IHAP to
avoid scalability issues with AHP and concluded that
IGA outperforms IAHP in terms of effectiveness, ef-
ficiency, and robustness to the user errors.
A number of other researchers also explored clus-
tering techniques with existing prioritization meth-
ods i.e. case-based ranking (Avesani et al., 2015)
(Qayyum and Qureshi, 2018)(Ali et al., 2021).
Most of the machine learning based techniques,
reviewed in this study, are based on some existing
prioritisation techniques, and partially automate the
process using different clustering methods. A require-
ments prioritization technique that fully automates the
requirements prioritization process for large scale sys-
tem with sufficient accuracy is lacking.
3 PROPOSED APPROACH
We have followed a simple methodology introduced
by (Kuhn and Johnson, 2013) for their research on
predictive modelling. The methodology is a standard
process for most of machine learning projects. It in-
cludes data analysis, pre-processing of data including
feature selection, model selection including train/test
split, fitting various models and tuning parameters,
and evaluation to find the model which generalises
better than others.
The performance of the algorithms has been eval-
uated using accuracy (the percentage of correctly
classified data), speed (the amount of time needed for
computation), comprehensibility (how difficult an al-
gorithm is to understand).
3.1 Dataset
This project uses real data produced by a company
in the semiconductor business producing IoT wireless
microchips. The data relates to the software require-
ments for bi-annual software release cycles for cal-
endar year 2020 (20Q2 and 20Q4). The data has 283
samples, each representing a software requirement re-
quested to be included in the software release. Each
sample has various feature values, some of which
were inputs to the original software release planning
cycle, some were outputs of that cycle and others were
calculated or derived during the release planning pro-
cess. During the original release planning cycle, these
values were considered and discussed with stakehold-
ers before the actual software release was finalised.
A key element of the original planning process
was the use of themes to abstract and collate require-
ments into cohesive business initiatives. This served
two purposes: a) reduce the number of items to be
discussed by business stakeholders; and b) provide
business stakeholders with something that they could
comprehend.
Out of three available subsets of requirements, the
most recent and focused data was selected in an at-
tempt to get the best results.
3.2 Exploratory Data Analysis
In the exploratory analysis, detailed information
about the main characteristics of the dataset is pro-
vided. The dataset has 40+ features that were care-
fully analysed. Table 1 presents a description of the
key features.
Various statistical analyses were carried out to
evaluate feature quality and predictability in relation
to the target value. They provided us with a more
thorough knowledge of the data.
The raw dataset had some inconsistencies in the
data i.e. redundant features, zero values and missing
values etc. Most of the features have multiple val-
ues for each sample which require further processing.
With respect to both zeros and missing values, the
data is inevitably incomplete for a number of reasons,
including: the process does not insist on complete
data before starting the planning cycle, secondary ver-
sions of that field that may not be used for many re-
Software Requirements Prioritisation Using Machine Learning
895

Table 1: Exploratory Data Analysis.
Feature Description
Issue Key Unique identifier for each requirement
in the Jira database.
Release
Commit-
ment
Output of prioritisation process, it has
three categories i.e. Q2 (requirement
was included), Complete (included and
completed) and any other value indicat-
ing not included.
Estimate
(wks)
The total estimated time in weeks to
complete the task. This feature was
added to the data after original priori-
tisation process.
(New)
[MoSCoW]
Stakeholder assessment of the depen-
dency of the theme on this requirement:
Must, Should, Could or Wo’nt.
(New)
MoSCoW
multiplier
Multiplier associated with MoSCoW
value.
Theme
Category
Divisor
Themes are categorised to indicate the
type of strategic or tactical initiative.
The highest ranked categories have a
divisor of 1, whereas the lower ranked
categories have higher divisors.
AOP/LTR
Theme
Rank
This is a ranking for themes based on
the lifetime revenue (LTR) linked to
that theme.
Cost cost of the requirement.
quirements.
3.3 Data Pre-Processing
A number of steps were taken to transform sample
features to make data machine processable.
Data Transformation: The numerical features
were extracted from the main dataset, special char-
acters from numerical data were removed and cat-
egorical values (such as Release commitment) were
mapped to numerical values.
Missing Values: After initial transformation of
data, the next step was to handle missing values and
null values. All rows where the data was missing
or null, were reviewed carefully. The rows were re-
moved where it was not ideal to perform feature en-
gineering to fill in the missing values. Other missing
values (where the data was a numerical spread and
were suitable for feature engineering), were filled in
with the mean value of the given feature.
Calculating Feature Importance: We have used
Decision Tree classifier to learn the feature impor-
tance in our dataset. To calculate the feature impor-
tance, Decision Tree model involves computing the
impurity metric of the node (feature) subtracting the
impurity metric of any child nodes. The mean de-
crease in the impurity of a feature across all trees
gives us the score of how important that feature is
(Scornet, 2020). Table 2 presents the importance
ranking for the features produced by the model.
Table 2: Feature Importance Score by Decisoon Tree.
Feature Value
Theme Category Divisor 0.483655
AOP LTR$ Theme Rank 0.191668
Cost 0.121553
Theme Value 0.054635
(New) MoSCoW Multiplier 0.046509
Reqs per Theme 0.034841
Estimate (wks) 0.034282
Dependent on 0.021122
3. Category Theme Rank 0.011735
(New) MoSCoW 2 Multiplier 0.000000
Based on the feature importance results, the
dataset was tuned. We tested our models on full
dataset as well as on tuned dataset.
3.4 Visual Analysis
Various statistical and visual analysis methods were
used to learn patterns in data and understand the rela-
tion of features to other features and the target value.
The target variable Release Commitment has cat-
egorical values which were converted to numeric data
to make two classes i.e. 1 (requirement included in
the release) and 0 (requirement not included).
An analysis of Class Distribution (see Figure 1
showed that the dataset has a moderate degree of
imbalance. Since the degree of imbalance wasn’t
too high and our aim was to learn patterns for both
classes, we chose to train our models on the true dis-
tribution.
Figure 1: Class Distribution.
ICAART 2023 - 15th International Conference on Agents and Artificial Intelligence
896

The Correlation Matrix has been built to iden-
tify how features are correlated to each other. It
can be seen from Figure 2 that the Cost and Esti-
mate are highly correlated; Theme Category Divi-
sor is heavily linked with Category Theme Rank.
Applicable to, (New) MoSCoW 2 multiplier and
Theme Value2 are heavily correlated to Applica-
ble to2. Theme Value 2 is also heavily correlated
to the Applicable to and (New) MoSCoW 2 multi-
plier. Theme Value seems to be inversely correlated
to AOP/LTR$ Theme rank, LTR$ Theme rank
and Category Theme Rank. Based on these ob-
servations the features Issue Key, Release Commit-
ment, First Requested Version, (New) MoSCoW 2
Multiplier, Dependent on2, Applicable to2, Tacti-
cal Value, Applicable to, Category Theme Rank
were dropped while attempting the experiments using
tuned dataset for different models.
4 EXPERIMENTS AND RESULTS
The goal of this research was to experiment the ap-
plication of Machine Learning models to the problem
of software requirements prioritisation, to understand
the dynamic of various parameters included in a soft-
ware release plan and evaluate the results received.
The models considered for the experiment were put
through rigorous testing using the base line dataset
acquired from pre-processing techniques.
The dataset was split into 80% training and 20 %
testing data. Experiments were done in a series of
iterations, aiming to tune the dataset and improve the
results.
Five different ML models have been used for this
research - Decision Tree Classifier, K-Nearest Neigh-
bours (KNN), Random Forest, Logic Regression and
Support Vector Machine. Five metrics have been used
to evaluate the ML models implemented: accuracy,
F1 score, Precision, Recall and K-Fold Cross Vali-
dation (Mean). For an overall comparison of the re-
sults, we only considered accuracy, F1 score and k-
fold cross validation mean. All the models have been
trained on the full as well as the tuned datasets.
In this section we present the results for each im-
plemented model.
4.1 Decision Tree Classifier
Table 3 presents the results on full and tuned datasets
using decision tree model respectively. The accuracy
and F1 score seems to be dropped after tuning the
dataset however the K-Fold Cross Validation score is
improved for tuned dataset.
Table 3: Decision Tree - full and tuned datasets.
Performance Metric Score
full
dataset
tuned
dataset
Accuracy 0.96 0.94
F1 score 0.96 0.94
Precision 0.97 0.95
Recall 0.96 0.94
K-fold cross validation
mean
0.89 0.92
Cross validation is important metric since it can
flag problems like selection bias and over-fitting. De-
spite a drop in acuracy, tuning the dataset has visible
impact on cross validation score.
4.2 K-Nearest Neighbours (KNN)
Table 4 presents the results of KNN for full and tuned
datasets. The accuracy, precision, recall and F1 score
dropped after tuning the dataset however the k-fold
cross validation (mean) has increased.
Table 4: k Nearest Neighbours - full and tuned datasets.
Performance Metric Score
full
dataset
tuned
dataset
Accuracy 0.94 0.92
F1 score 0.94 0.92
Precision 0.95 0.92
Recall 0.94 0.92
K-fold cross validation
mean
0.80 0.82
4.3 Random Forest
Table 5 presents the results of Random Forest perfor-
mance on full and tuned datasets. The accuracy and
F1 score were the same after tuning the dataset how-
ever the k-fold cross validation(mean) has increased.
The precision and recall score remained the same
hence indicated that change in removal of features has
limited impact on the scores of Random Forest.
Random forest model generalised very well to the
data. We did some further experiments with this
model which are detailed in Section 5.
Software Requirements Prioritisation Using Machine Learning
897
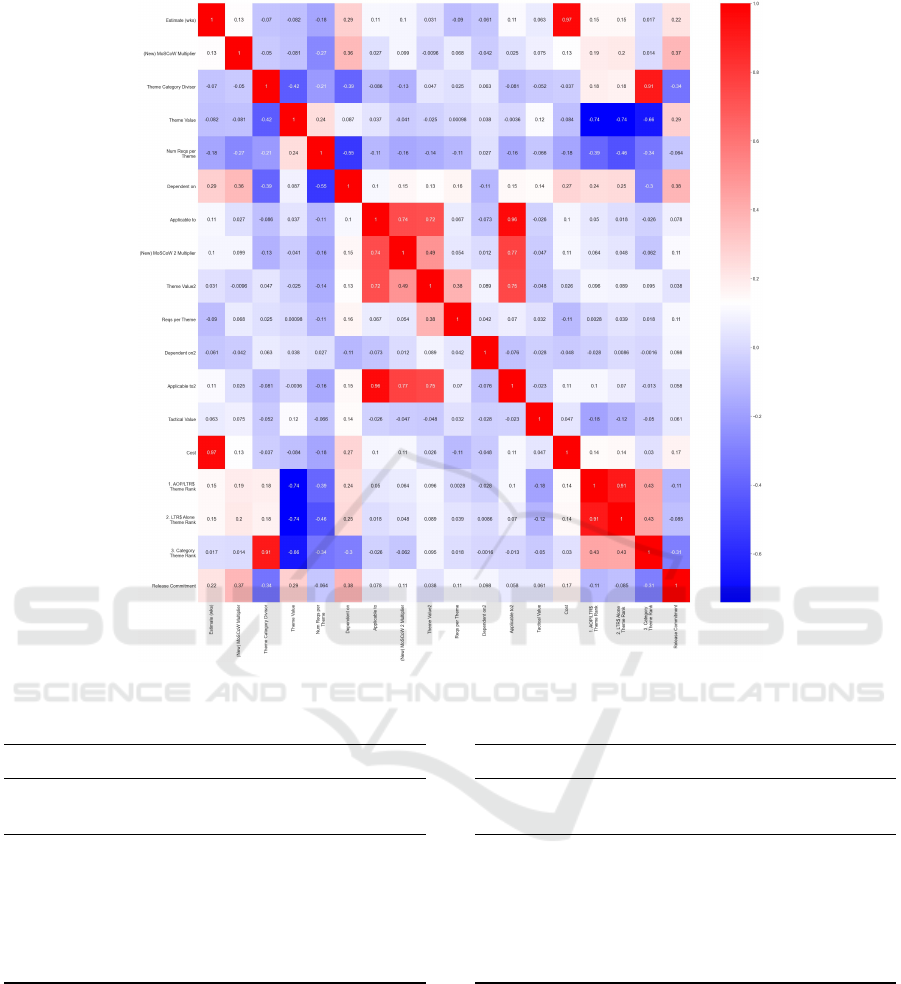
Figure 2: Heatmap of correlation matrix.
Table 5: Random Forest - full and tuned datasets.
Performance Metric Score
full
dataset
tuned
dataset
Accuracy 0.94 0.94
F1 score 0.94 0.94
Precision 0.95 0.95
Recall 0.94 0.94
K-fold cross validation
mean
0.89 0.90
4.4 Logistic Regression
Table 6 presents the results of Logistic Regression for
full and tuned datasets. The accuracy, precision, re-
call, and F1 scores were improved after tuning the
dataset. However, the k-fold cross validation(mean)
has remained the same.
Table 6: Logistic Regression - full and tuned datasets.
Performance Metric Score
full
dataset
tuned
dataset
Accuracy 0.86 0.88
F1 score 0.86 0.87
Precision 0.87 0.90
Recall 0.87 0.88
K-fold cross validation
mean
0.76 0.76
4.5 Support Vector Machine
Table 7 presents the results of Support Vector Ma-
chine (SVM) for full and tuned datasets. It can be
seen that there was improvement in accuracy, F1
score, precision, recall and k-fold cross validation
mean after tuning the dataset.
ICAART 2023 - 15th International Conference on Agents and Artificial Intelligence
898

Table 7: SVM - full and tuned datasets.
Performance Metric Score
full
dataset
tuned
dataset
Accuracy 0.87 0.88
F1 score 0.86 0.88
Precision 0.86 0.88
Recall 0.87 0.88
K-fold cross validation
mean
0.87 0.89
5 DISCUSSIONS
Accuracy, F1 score and K-Fold Cross Validation
(Mean) have been used to evaluate the ML models
implemented, with the results shown in Table 9. All
models have performed well with an accuracy score
above 80% for both tuned and full datasets. F1 score,
that is a better indicator of the model’s performance,
shows that the Logic Regression and Support Vector
Machine have performed slightly worse than the other
models. K-Nearest Neighbours, Decision Tree classi-
fier and Random Forest have consistently high results
across all the 3 metrics for the evaluation. F1 score for
Decision Tree Classifier is the highest however this
model is prone to overfitting, and this is evident by
the decrease in F1 score for the tuned dataset.
As Random Forest had promising results, we did
some further experiments with hyper parameter tun-
ing. After implementing and testing different imput-
ers such as simple and iterative, it was concluded that
simple imputer provided the best results with mean,
median strategy used. After tuning the hyper param-
eters for random forest, the results were substantially
higher (see Table 8). The only drawback is the exe-
cution time (203.0259862 seconds) for random forest
while its hyper parameter are tuned.
Table 8: Random Forest - results after tuning hyper-
parameters.
Performance Metric Score
Accuracy 1.0
F1 score 1.0
Precision 1.0
Recall 1.0
K-fold cross validation mean 0.91
To meet the project goal of understanding the im-
pact of certain parameters on the inclusion of a soft-
ware requirement in a release, there are several no-
table outcomes:
• Overall the level of accuracy in predicting require-
ments priority by using various machine learning
models is positive and indicates that there may be
value in extending this research to develop this
concept further;
• Estimate (wks) and Cost were identified as pa-
rameters that were essential for the data mod-
elling. They ranked 3rd and 7th respectively in
terms of their importance. However, the original
software requirement prioritisation process was
completed before either the estimate or cost was
derived/calculated, and they were added later in
the cycle. This could indicate that even when esti-
mate or cost information was not available, stake-
holders had an intuitive understanding of the size
of the requirement when providing their inputs to
the prioritisation process;
• Theme Category Divisor was found to be the
most important parameter. This parameter is an
indicator of the type of theme that a requirement is
associated with, identifying the strategic/tactical
nature of the theme. This could indicate that: a)
the use of themes had a large impact on prioriti-
sation; and b) strategic themes and requirements
were more likely to get included in the release.
6 CONCLUSION
The literature review of prioritisation of require-
ments in software releases for Software Product Line
with Multiple Business Lines (SPL/MBL) enlight-
ened many strategies and methods however the ex-
isting strategies would not fit best for the present use
case. Investigation into the Machine Learning mod-
els led to the implementation of five of them and suc-
cessfully compare their performance. The dataset was
tuned and features were carefully selected. All se-
lected models were trained and tested to get the pre-
dictions. Most models were able to achieve 80%
accuracy however further investigation and testing
yielded better results. The best results were achieved
with Decision Tree classifier, Random forest and
K-Nearest Neighbours. Decision Tree Classifier is
known to be prone to overfitting at times and Random
Forest can overcome the overfitting problem. Hence
hyper parameter tuning was performed for Random
Forest which gave 100% accuracy in many perfor-
mance metrics and 91% at k-fold cross validation.
However, the computational effort was considerably
high after hyper parameter tuning. In future, hyper
parameter tuning may be performed for other models
Software Requirements Prioritisation Using Machine Learning
899

Table 9: Results for the Full and Tuned Datasets.
Model Accuracy F1 Score K-Fold Cross Vali-
dation(Mean)
Execution time
full
dataset
tuned
dataset
full
dataset
tuned
dataset
full
dataset
tuned
dataset
full
dataset
tuned
dataset
Decision Tree 0.96 0.94 0.96 0.94 0.89 0.90 0.0860982 0.085749
Random Forest 0.94 0.94 0.94 0.86 0.89 0.92 2.0259862 2.2580502
Logic Regression 0.86 0.88 0.86 0.87 0.76 0.76 2.6350644 3.1730906
K Nearest Neighbour 0.94 0.92 0.94 0.92 0.80 0.82 4.106245 3.1730906
SVM 0.87 0.88 0.86 0.88 0.87 0.89 3.8039046 3.282107
to explore and evaluate the results and derive further
conclusions.
REFERENCES
Abbas, M., Jongeling, R., Lindskog, C., Enoiu, E. P., Saa-
datmand, M., and Sundmark, D. (2020). Product line
adoption in industry: An experience report from the
railway domain. In Proceedings of the 24th ACM Con-
ference on Systems and Software Product Line. Asso-
ciation for Computing Machinery.
Ali, S., Hafeez, Y., Hussain, S., Yang, S., and Jamal, M.
(2021). Requirement prioritization framework using
case-based reasoning: A mining-based approach. Ex-
pert Systems, 38(8):e12770.
Ashton, K. (2009). The ’internet of things’ thing.
Avesani, P., Perini, A., Siena, A., and Susi, A. (2015). Goals
at risk? machine learning at support of early assess-
ment. In 2015 IEEE 23rd International Requirements
Engineering Conference (RE), pages 252–255.
Carlshamre, P., Sandahl, K., Lindvall, M., Regnell, B., and
Natt och Dag, J. (2001). An industrial survey of re-
quirements interdependencies in software product re-
lease planning. In Proceedings 5th IEEE International
Symposium on Requirements Engineering, pages 84–
91.
Devroey, X., Perrouin, G., Cordy, M., Samih, H., Legay,
A., Schobbens, P.-Y., and Heymans, P. (2017). Sta-
tistical prioritization for software product line testing:
an experience report. Software & Systems Modeling,
16(1):153–171.
Duan, C., Laurent, P., Cleland-Huang, J., and Kwiatkowski,
C. (2009). Towards automated requirements pri-
oritization and triage. Requirements engineering,
14(2):73–89.
Gr
¨
uner, S., Burger, A., Kantonen, T., and R
¨
uckert, J. (2020).
Incremental migration to software product line engi-
neering. In Proceedings of the 24th ACM Conference
on Systems and Software Product Line, pages 1–11.
Kuhn, M. and Johnson, K. (2013). Applied predictive mod-
eling. Springer, London.
Metzger, A. and Pohl, K. (2014). Software product line en-
gineering and variability management: Achievements
and challenges. In Future of Software Engineering
Proceedings.
Montalvillo, L. and Diaz, O. (2016). Requirement-driven
evolution in software product lines: A systematic
mapping study. Journal of Systems and Software,
122:110 – 143.
Perini, A., Susi, A., and Avesani, P. (2013). A machine
learning approach to software requirements prioriti-
zation. IEEE Transactions on Software Engineering,
39(4):445–461.
Pohl, K., B
¨
ockle, G., and Van Der Linden, F. (2005). Soft-
ware product line engineering: foundations, princi-
ples, and techniques, volume 1. Springer.
Pronk, B. J. (2002). Product line introduction in a multi-
business line context. International Workshop on
product Line Engineering: The Early Steps: Plan-
ning, Modelling and Managing.
Qayyum, S. and Qureshi, A. (2018). A survey on ma-
chine learning based requirement prioritization tech-
niques. In Proceedings of the 2018 International Con-
ference on Computational Intelligence and Intelligent
Systems, pages 51–55.
Saaty, T. L. (1977). A scaling method for priorities in hier-
archical structures. Journal of Mathematical Psychol-
ogy, 15(3):234 – 281.
Sadiq, M., Sadim, M., and Parveen, A. (2021). Applying
statistical approach to check the consistency of pair-
wise comparison matrices during software require-
ments prioritization process. International Journal
of System Assurance Engineering and Management,
pages 1–10.
Scornet, E. (2020). Trees, forests, and impurity-based vari-
able importance. arXiv preprint arXiv:2001.04295.
Sommerville, I. (2016). Software engineering. Boston :
Pearson Education Ltd, 10th edition.
Svahnberg, M., Gorschek, T., Feldt, R., Torkar, R., Saleem,
S. B., and Shafique, M. U. (2010). A systematic re-
view on strategic release planning models. Informa-
tion and Software Technology, 52(3):237–248.
Tonella, P., Susi, A., and Palma, F. (2013). Interactive re-
quirements prioritization using a genetic algorithm.
Information and software technology, 55(1):173–187.
Wiegers, K. and Beatty, J. (2013). Software Requirements.
Microsoft Press, Redmond, Washington, 3rd edition.
ICAART 2023 - 15th International Conference on Agents and Artificial Intelligence
900
