
Estimation of Fluid Intake Volume from Surface Electromyography
Signals: A Comparative Study of Seven Regression Techniques
Iman A. Ismail
a
and Ernest N. Kamavuako
b
Department of Engineering, King’s College London, London WC2R 2LS, U.K.
Keywords:
Dehydration, Electromyography Sensors, Fluid Intake, Volume Quantifying, Swallowing.
Abstract:
Insufficient fluid intake in older adults, in particular, is a worrying problem and an actual concern that warrants
scrutiny. Monitoring fluid intake is essential to avoid dehydration and overhydration problems. This paper
presents an investigation to estimate the fluid intake volume using surface Electromyographic (sEMG) sensors.
Eleven subjects participated in the experiment, and sEMG recordings of swallows from cups, bottles, and
straws were collected. Four features were extracted from the EMG signals. Seven regression algorithms were
implemented for quantifying the volume of swallowed fluid: Random Forest (RF), Support Vector Regressor,
K-nearest neighbour (KNN), Linear Regressor (LR), Decision Tree (DT), Lasso and Ridge. The mean sip
volume across subjects was 14.85 ± 5.05 ml. Results showed that using Random Forest, the root mean
square (RMSE) for estimating fluid intake volume using one the Mean Absolute Value feature gave 1.37 ±
1.1 ml. These results indicate a step forward in estimating fluid intake volume based on sEMG for hydration
monitoring.
1 INTRODUCTION
The terms ”hydration” and ”healthy” can be used in-
terchangeably because water is necessary for every
organ, cell, and tissue in the body to function nor-
mally. In other words, being hydrated is essential to
good health because it aids in processes like lubricat-
ing joints, avoiding infections, feeding cells nutrients,
and preserving the general health of the body’s or-
gans. Yet, older adults experience considerable hy-
dration concerns since their bodies contain 10 − 15%
less water. This can be a significant contributing fac-
tor to the majority of health problems that older adults
experience. Studies show that most older individuals
are more susceptible to renal issues and electrolyte
abnormalities due to medications that lead to dehy-
dration, making them more susceptible to changes in
conditions and illnesses (El-Sharkawy, 2021). De-
mentia, Alzheimer’s, diabetes, and poor mobility are
just a few of the health problems that older adults may
experience that cause their ability to feel thirst de-
creases, making them less conscious of their body’s
need for water. Dehydration is an issue for many older
persons as a result. It also increases the risk of death
in seniors relative to the general population and is one
a
https://orcid.org/ 0000-0001-9846-6674
b
https://orcid.org/ 0000-0001-6846-2090
of the most common reasons for hospital admissions.
Dehydration occurs when the human body uses or
loses more fluid and minerals, such as sodium and
potassium than it takes in. The body cannot perform
everyday tasks due to the lack of water and other liq-
uids. Thus, if the body cannot replace the lost fluids,
it will become dehydrated, which is very dangerous.
Therefore, monitoring the quantity of intaken fluid is
essential to decrease the risk of dehydration. Fluid
charts are one of the vital clinical methods used to
monitor patients’ fluid intake and output throughout
the day in hospitals and care facilities where nurses
stay with the patients to try to keep an eye on their
consumption of meals and liquids. The medical team
uses the data to make later clinical decisions, such
as whether to perform surgery or prescribe medica-
tion. It is crucial to fully complete the fluid balancing
charts to detect changes in the fluid’s input or output.
Any fluid intake should be precisely measured and its
type recorded on a fluid balance chart. That technique
can be used to estimate and record any output fluid,
including urine, loose stools, and vomiting. These
fluid charts may only be used to monitor fluid levels;
however, they are not always accurate because doctors
or nurses sometimes fail to note a patient’s input or
output (Malvuccio and Kamavuako 2021). According
to the study, only 25% of the fluid charts at Kettering
General Hospital had precise measurements, and only
118
Ismail, I. and Kamavuako, E.
Estimation of Fluid Intake Volume from Surface Electromyography Signals: A Comparative Study of Seven Regression Techniques.
DOI: 10.5220/0011795600003414
In Proceedings of the 16th International Joint Conference on Biomedical Engineering Systems and Technologies (BIOSTEC 2023) - Volume 4: BIOSIGNALS, pages 118-124
ISBN: 978-989-758-631-6; ISSN: 2184-4305
Copyright
c
2023 by SCITEPRESS – Science and Technology Publications, Lda. Under CC license (CC BY-NC-ND 4.0)

14% had thorough records of all intakes and outputs
(Asogan, 2021).
Many technologies use machine learning and
other techniques to monitor fluid intake in older per-
sons, according to a survey of literature reviews on
methods of monitoring dehydration. One of these
technologies is wearable technology, including ac-
celerometers, inertial sensors, smartwatches, cell-
phones, acoustic sensors, and psychological sensors.
These items are widely available on the commercial
market and have helped detect drinking activities (Co-
hen, 2021). Still, wearables cannot reliably quan-
tify consumption volume, despite research showing
that they can detect drinking events with an accuracy
of ¿ 80%. Furthermore, some senior citizens dislike
these devices and do not wish to wear them (Wellnitz,
2019). For textile techniques to be useful in daily
life, they must be connected to the clothing and se-
curely laundered in the washing machine. Respiratory
Inductance Plethysmography (RIP), for example, has
produced positive results for swallowing detection but
hasn’t calculated the volume of fluid consumed. Ac-
cordingly, none of these methods has been used to
quantify the volume of fluid intake in the clinic, de-
spite the encouraging results of these methods for de-
tecting swallowing and drinking events (Dong, 2017,
Cheng, 2010 - Tatulli, 2020).
Another approach to measure fluid intake is sur-
faces with embedded sensors. These surfaces require
the users to lift the containers used for drinking and
place them on the surface every time they drink to de-
termine the drinking actions and to record the amount
of the drink. Any additional object placed on the
surface will give inaccurate information, leading to
erroneous detections. Further, some vision and en-
vironmental approaches, like wearable cameras and
radar, have concentrated on intake detection. Still,
the detection accuracy depends on the camera resolu-
tion and the surrounding environment (lighting, pro-
cessing power, and data storage), most of which have
not operated in real-time. Although these techniques
can recognise drinking events with a 90% accuracy
using deep learning techniques, they cannot calculate
the volume of fluid consumed (Cohen, 2021).
The use of smart containers paired with Inertial
Measurements Units (IMU) placed outside the bot-
tle to estimate the sip volume according to the event
orientation and duration is another effective method
that has been used to quantify fluid intake. Though,
the usability of these containers remains low. Numer-
ous research has examined ultrasonic sensors to cal-
culate the volume of fluid being absorbed using the
container, but they have not evaluated how accurate
the sensors are. Nevertheless, these techniques have
not found their way to the clinics routinely.
Methods based on physiological signals to moni-
tor fluid intake include sEMG and acoustic sensors,
such as microphones. Nakafuji et al. (2015) ob-
tained a classification accuracy of 84% using micro-
phones to record swallowing noises to discriminate
between discrete fluid volumes (Nakafuji, 2014). Us-
ing the frequency and amplitude characteristics of the
recorded signals, Kobayashi et al. (2014) captured
swallowing sound using a throat microphone to ac-
curately detect fluid intake with 95% accuracy us-
ing the cross-validation of SVM and estimate how
much the individual was drinking with a 3.33 ml
RMSE using the amplitude characteristic of swallow-
ing sound (Kobayashi, 2014). Malvuccio and Ka-
mavuako (2021) have also applied sEMG recordings
of individual and continuous swallows to distinguish
between liquid and saliva swallows using Fine KNN
with an accuracy of 86.69 ± 5.52% to classify be-
tween the noise and swallows using Fine Gaussian
SVM with an accuracy of 99±1.31 (Malvuccio Ka-
mavuako, 2021). Surface electromyography (sEMG)
and microphones have been used for continuous mon-
itoring of the swallowing events by Amft and Tr
¨
oster
to discriminate between solid and liquid meals in a
single participant (Amft, 2006).
To the best of our knowledge, there is a limited
number of studies using the sEMG to estimate fluid
intake volume effectively. Among the above three
cited studies, only one attempted to use a continuous
estimation approach using artificial neural networks.
The challenge is not to classify discrete values but
to estimate continuous volume. Therefore, this study
aims to compare the capability of different regressors
in estimating fluid intake volume using sEMG. Novel
contributions of this paper include (1) investigating
different machine learning regressors to find the opti-
mum regressor in estimating fluid volume (2) unravel-
ling the dependency between the choice of regressor
and features; and (3) proposing optimum placement
of sEMG electrodes with minimum error.
2 METHODOLOGY
2.1 Dataset
This study uses a previously recorded dataset; details
can be found in (Malvuccio Kamavuako, 2021). In
brief, three females and eight men, ranging in age
from 20 to 67 years, participated in this study. Two of
the Delsys Tringo sensors were placed on the belly of
the suprahyoid muscles, and two were placed on the
belly of the infrahyoid muscles. Drinking events oc-
Estimation of Fluid Intake Volume from Surface Electromyography Signals: A Comparative Study of Seven Regression Techniques
119
curred through various classes (drinking using a cup,
straw, bottle, and scale). After data checks, two sub-
jects had poor EMG data and were removed from the
investigation.
2.2 Experimental Procedure
Subjects consumed water using: a bottle, a cup, and
a straw, referred to as containers for simplicity. Each
subject had to swallow water five times for each con-
tainer while taking regular sips. We used a digital
scale to weigh the container before and after drink-
ing to quantify the true sip volume. A sip is a drink,
taking only a small amount at a time. For the final
group of drinks, 5 ml were added to the highest cup
volume that could be computed, and this assignment
was only done once.
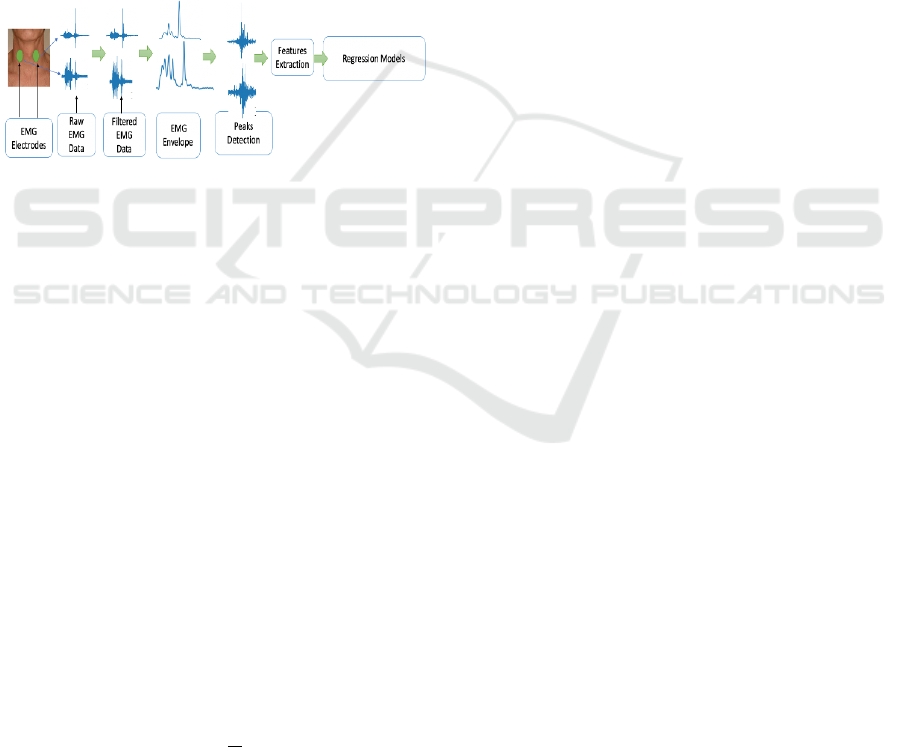
Figure 1: A graphical representation of the experimental
approach and data analysis pipeline.
2.3 Data Analysis
On Google Collab, we carried out data analysis using
Python 3.8 and preprocessing consisted of bandpass
filtering between 6–400 Hz. As shown in Figure 1, the
EMG signals were rectified, and the signal envelope
was computed to detect the highest peak where the
swallowing event occurred. The EMG burst was then
extracted using the peak position. From that burst,
features of the Mel frequency cepstral coefficients
(MFCCs), Mean Absolute Value (MAV), Waveform
Length (WL), and Willison Amplitude (WAMP) were
calculated on the raw data of the EMG. These features
had positive outcomes when applied to EMG signals
in earlier investigations.
• Mean Absolute Value (MAV): It is a method for
identifying and evaluating the intensity of muscu-
lar contractions. It can be represented as the mov-
ing average of the full wave rectified EMG signal,
as shown in equation 1[49].
MAV =
1
N
N
∑
i=1
|X
i
| (1)
While N is the length of the segment, i is the seg-
ment increment, and Xi is the signal amplitude
value.
• Mel-frequency cepstral coefficients (MFCCs):
MFCCs are coefficients that form the Mel-
frequency cepstrum (MFC) based on a linear co-
sine transform of a log power spectrum on a non-
linear Mel scale of frequency. It works by seg-
menting the signal to a number of windows, then
applying the Discrete Fourier Transform (DFT)
and taking the log of the magnitude. Then, it
makes wrapping the frequencies on a Mel scale
and, in the end, applies the inverse Discrete Co-
sine Transform (DCT).
• Willison Amplitude (WAMP): The WAMP fea-
ture counts the number of changes in the ampli-
tude of the EMG signal that surpass a specific
threshold, as shown in equation 2 (Negi, 2016).
WAMP =
N
∑
i=1
[ f (|X
i
− X
i+1
|)];
f (x) =
(
1, x >= threshold
0, otherwise
(2)
• Waveform Length (WL): It is the total length
of the waveform for the segment. The results
obtained from the WL computation indicate the
waveform’s amplitude, frequency, and duration as
shown in equation 3 (Spiewak, 2018).
W L =
N−1
∑
i=1
|X
i+1
− X
i
| (3)
We used a regression approach to estimate drink-
ing volume from sEMG. Our analysis included the
following techniques: Random Forest (RF), Sup-
port Vector Regressor (SVR), K-Nearest Neighbor
Regressor (KNN), Linear Regression (LR), Decision
Tree (DT), Lasso, and Ridge regressors. For each
subject, we had 16 observations; thus, a leave-one-
sample-out was used employed with permutation,
with the Root Mean Square Error (RMSE) as the per-
formance metric. In the first part of data analysis,
we investigated the impact of using all four channels
versus the two lower (infrahyoid muscles) and upper
(suprahyoid muscles) channels using all regressors,
single features and all features together. We used
a three-way repeated measures analysis of variance
(3-ANOVA) with factors (Channels, Regressors and
features) to test for statistical differences between the
factors and interactions. In the second part of the data
analysis, we selected the three regressors and three
features with the lowest RMSE to investigate the ef-
fect of using single and mixed channels (one upper
and one lower) on performance. Similarly, we used
3-ANOVA to test for statistical differences. Results
are expressed as mean ± standard error.
BIOSIGNALS 2023 - 16th International Conference on Bio-inspired Systems and Signal Processing
120
3 RESULTS
The overall grand mean of the sip volume
across subjects and estimation RMSE across
channels, regressors and features were 13.91
± 1.27 ml and 1.37 ± 0.39 ml, respectively.
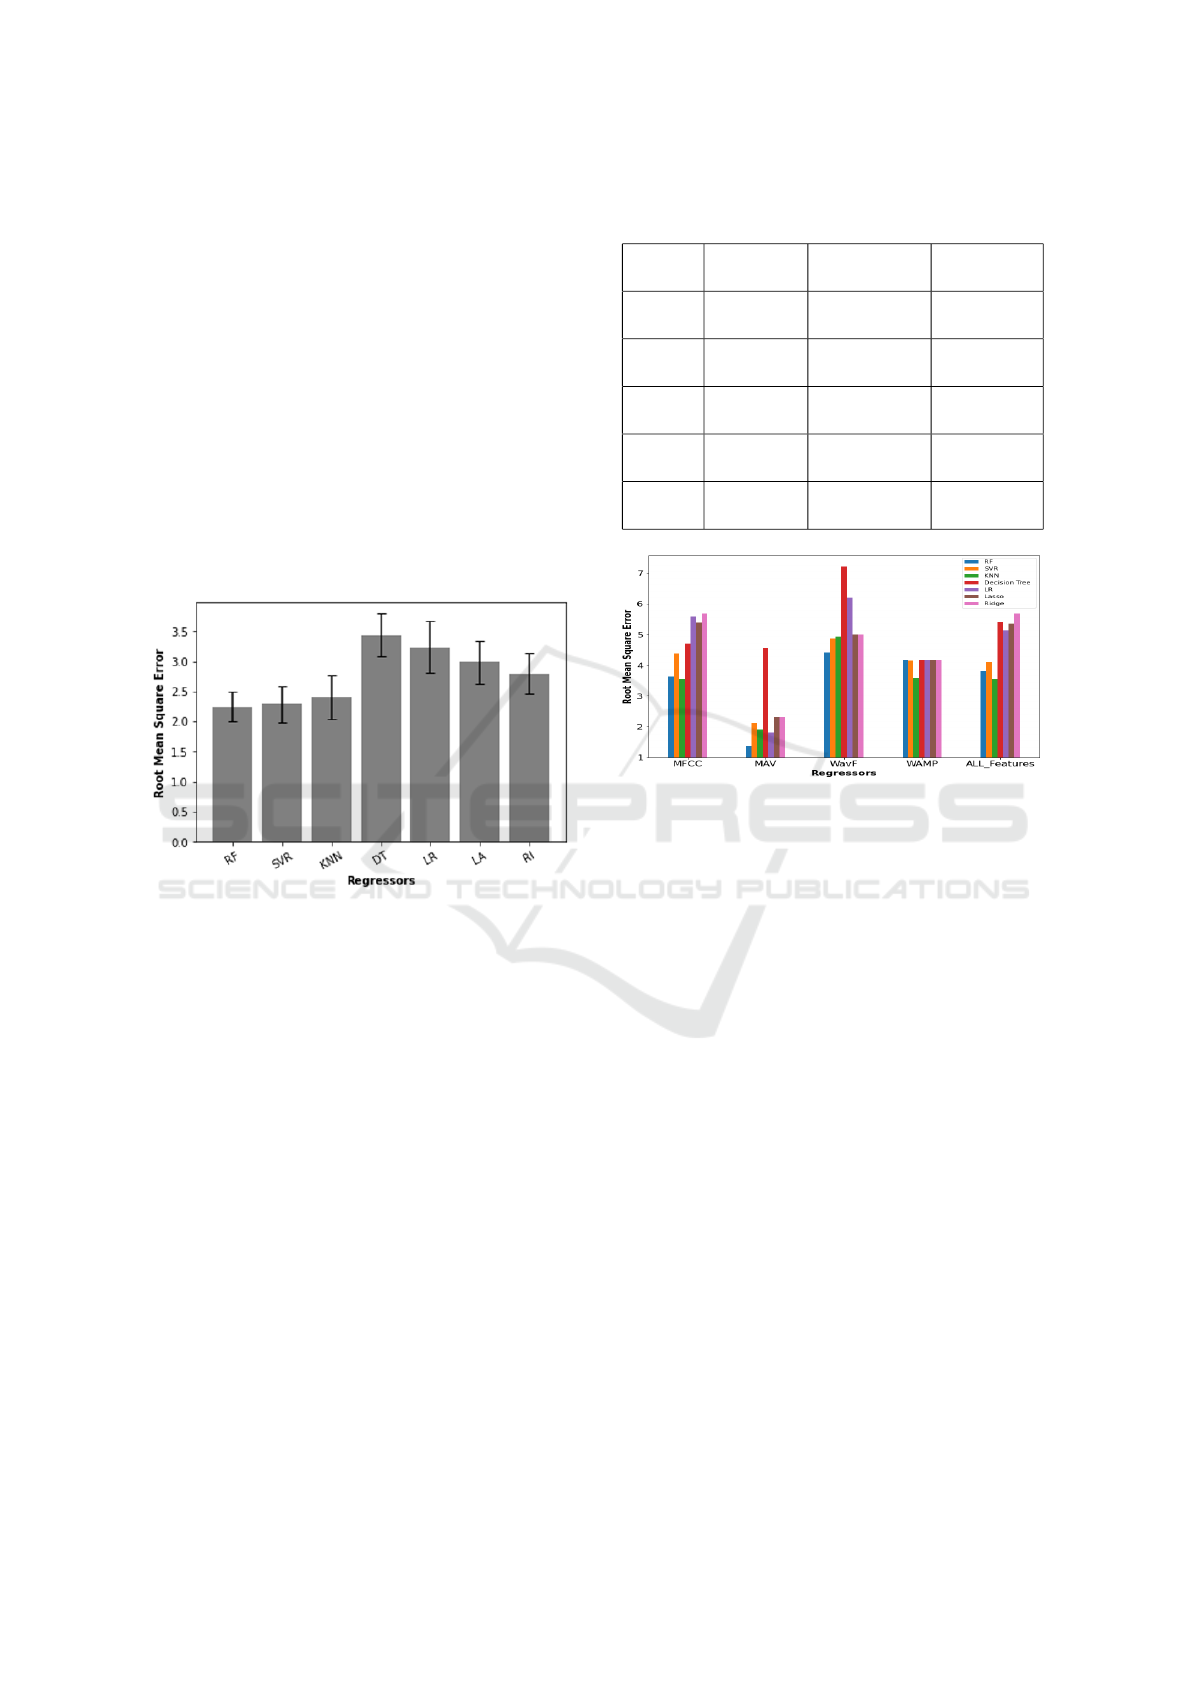
The Effect of Regressors and Features: The
RMSE of all four channels was 2.65 ± 0.32 ml, not
significantly lower than the infrahyoid (2.90 ± 0.35
ml) and suprahyoid (2.76 ± 0.33 ml) pairs. There
was a statistical difference between regressors (P =
0.003), with RF (2.25 ± 0.25 ml), SVR (2.29 ± 0.30
ml) and KNN (2.41 ± 0.37 ml) performing better than
the others, also summarised in Figure 2 There was
no interaction between channels and regressors (P =
0.379).
Figure 2: An error bar plot that summarizes the RMSE and
the STD for the seven regressors.
The mean performance of each feature in ascend-
ing order, was 1.37 ± 0.39 ml for MAV, 1.82 ± 0.45 ml
for MFCC, 1.82 ± 0.45 ml for all features combined,
1.99 ± 0.60 ml for WAMP and 2.12 ± 0.44 ml for
WL, not statistically different (P = 0.132) from each
other. There was an interaction (P = 0.01) between
regressors and features, meaning that the choice of
features affects the performance of the regressors, as
summarised in Table 1. Figure 3 depicts the relation-
ship between regressors and features when using the
two suprahyoid muscles, figure 4 depicts the relation-
ship between regressors and features when using the
two infrahyoid muscles, and figure 5 depicts the rela-
tionship between regressors and features when using
the two suprahyoid and the two infrahyoid muscles.
Table 2 indicates that performance can be max-
imised using suprahyoid muscles with Random for-
est as regressor with the MAV feature. Nevertheless,
SVR and KNN are good regressor candidates with the
MFCC feature.
Table 1: Association between features and best regressor
for different channels.
Features Four
channels
Infrahyoid
muscles
Suprahyoid
muscles
MFCC RF
2.26±0.27ml
SVR
2.27±0.41ml
KNN
1.82±0.45ml
MAV RF
1.44±0.25ml
Lasso / Ridge
2.19±0.42ml
RF
1.37±0.39ml
WAMP KNN
1.99±0.60ml
KNN
2.09±0.57ml
KNN
2.03±0.57ml
WL SVR
2.24±0.36ml
SVR
2.15±0.44ml
RF
2.12±0.44ml
ALL SVR
2.06±0.60ml
SVR
1.97±0.36ml
KNN
1.82±0.45ml
Figure 3: The bar plot with the root mean square error for
the seven regressors with the features using the Suprahyoid.
Single channel investigation showed no difference
between channels nor their combinations (infrahyoid
and suprahyoid). It is worth noting that using the
left infrahyoid or left suprahyoid channel alone with
the RF regressor with either MAV or MFCC pro-
vided RMSE values close to 1.6 ml. The combined
left supra and right infra channels performed down
to 1.5 ml using RF and MAV. Combination of MAV
and MFCC using the two suprahyoid channels with
the RF has not improved the RMSE results. Table
V demonstrates the average sip volume and the Root
Mean Square error for each subject using the upper
two suprahyoid muscles with RF.
4 DISCUSSION
This study aimed to compare the power of various
regressor techniques in estimating fluid intake vol-
ume using surface Electromyographic (sEMG) sen-
sors. The study’s regression findings strongly suggest
that estimation of fluid intake volume is feasible us-
ing surface EMG. This study demonstrated how re-
gression performance differed depending on whether
signals were coming from the upper two muscles
Estimation of Fluid Intake Volume from Surface Electromyography Signals: A Comparative Study of Seven Regression Techniques
121
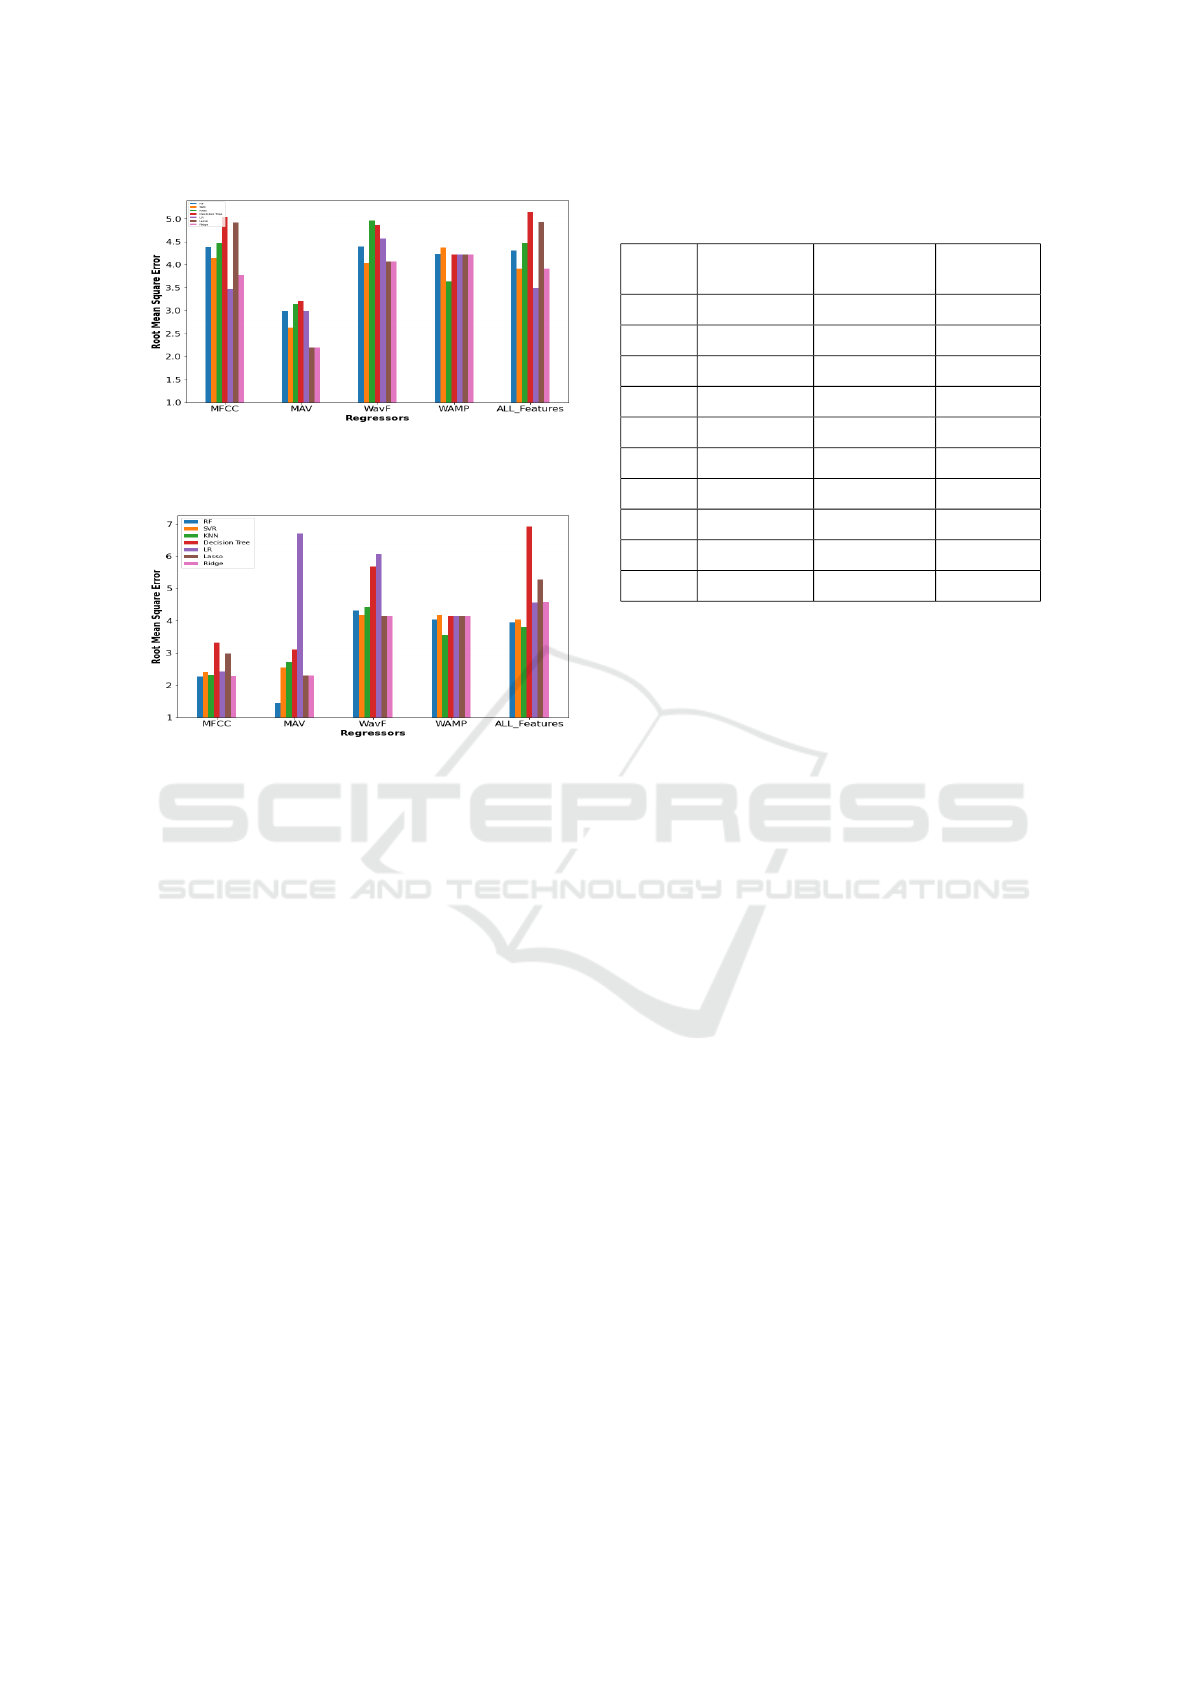
Figure 4: The bar plot with the root mean square error for
the seven regressors with the features using the Infrahyoid
Muscles.
Figure 5: The bar plot with the root mean square error for
the seven regressors with the features using the Infrahyoid
Muscles and the Suprahyoid muslecs.
(Suprahyoid muscles), the lower two muscles (In-
frahyoid muscles), or all the muscles. We found that
solely employing suprahyoid muscles did not produce
significant superior results to those of the infrahyoid
muscles. The seven regression models were run on
each feature individually and then on all four features
collectively to select the best features.
This demonstrated that no single regressor works
best for all features and that the regressor depends on
the feature. There was a signficant difference between
the regressors. For example, Random Forest regres-
sor performs best using the Mean Absolute Value fea-
ture. Except for the Willison amplitude and MFCC
features, statistical analysis did reveal significant vari-
ation in how different regressors performed with var-
ious features. Therefore, utilising a single character-
istic can be advantageous since it will decrease com-
puting costs and time, particularly for online jobs. Us-
ing single channels of the infrahyoid or the suprahy-
oid muscles or combining a single channel of each
to estimate the volume has not improved the results
of RMSE. However, the error difference was not too
high, indicating that single EMG channels may be
used to record the intake data. As a result, in a sub-
sequent study, single channels will be used to record
the intake data and will be investigated if the fluid es-
timation performance will be improved or not.
Table 2: Final Results for the Best Regression Model (RF)
using Mean Absolute Volume feature.
Subjects Average Sip
Volume (ml)
RMSE (ml) Percentage
error (%)
S1 19.42 ± 5.00 1.07 ± 1.67 5
S2 8.72 ± 2.95 1.42 ± 0.98 16
S3 12.18 ± 4.19 0.82 ± 1.4 6
S4 11.4 ± 3.59 2.99 ± 1.19 26
S5 18.71 ± 5.94 0.13 ± 1.98 1
S6 12.72 ± 3.85 1.85 ± 1.28 14
S7 21.32 ± 8.47 0.39 ± 2.82 2
S8 13.66 ± 3.15 0.29± 1.05 2
S9 7.14 ± 2.86 3.35 ± 0.95 47
Average 13.91 ± 1.27 1.37 ± 0.39 13.22
The number of studies aiming at fluid volume es-
timation from sEMG is very limited. Kobayashi et al.
attempted to measure the amount of liquids consumed
using a throat microphone with an RMSE value of
3.33 ml (Kobayashi, 2014). Malvuccio also estimated
the amount of fluid consumed using sEMG record-
ings of both individual and continuous swallows, but
her work had an RMSE than ours (Malvuccio, 2021).
Despite the similar performance, decreasing the error
further will be beneficial, and thus our future study
should include a larger sample size with advanced
techniques.
Although the sEMG performance in estimating
fluid intake volume has shown encouraging results
compared to other approaches, further validation of
these data is necessary. We aim to increase the sample
size to improve the outcomes and model performance.
Additionally, the test volunteers must be older adults
since their swallowing habits change as people age,
which may impact the system’s functionality. Find-
ing out if the performance would be affected by age
and by increasing the number of subjects is required
because this study only used a small number of partic-
ipants. Additionally, this study did not consider other
variables that could impact the sip volume, such as
the liquid temperature and composition. These fac-
tors may cause the sip volumes to differ from sub-
ject to subject, compromising the fluid intake volume
technique’s estimation ability.
5 CONCLUSIONS
We have compared for the first time the capability of
various regressors to estimate fluid intake from sEMG
BIOSIGNALS 2023 - 16th International Conference on Bio-inspired Systems and Signal Processing
122

signals recorded during swallowing events. The re-
sults of utilizing only the suprahyoid or infrahyoid
muscles did not differ statistically; however, there
were statistical differences between the various re-
gressors. RF, then SVM regressors were the best ones
using the Mean Absolute Value feature in estimating
the fluid volume with the lowest error. Furthermore,
there is an indication that regressor performance is
feature dependent. This outcome is a step forward
in using sEMG for hydration monitoring. Further re-
search is needed to investigate the use of single EMG
channels to record and estimate the fluid data and
whether two channels work better for regression and
the other are better for classification.
REFERENCES
El-Sharkawy, A. M., Sahota, O., Maughan, R. J., & Lobo,
D. N. (2014). The pathophysiology of fluid and elec-
trolyte balance in the older adult surgical patient. Clin-
ical Nutrition, 33(1), 6-13.
Dehydration risks for seniors. Cleveland Clinic. (2021,
November 10). Re- trieved December 30, 2021,
from https://health.clevel and clinic.org/drink- up-
dehydration- is-an-often-overlooked-health-risk-for-
seniors/
Malvuccio, C., & Kamavuako, E. N. (2021, March). De-
tection of Swallowing Events and Fluid Intake Vol-
ume Estimation from Surface Electromyography Sig-
nals. In 2020 IEEE-EMBS Conference on Biomedical
Engineering and Sciences (IECBES) (pp. 245-250).
IEEE.
Asogan, H., & Raoof, A. (2021). Education and training as
key drivers for improving the quality of fluid balance
charts: findings from a quality improvement project.
BMJ Open Quality, 10(3), e001137.
Cohen, R., Fernie, G., & Roshan Fekr, A. (2021). Fluid in-
take monitoring systems for the elderly: a review of
the literature. Nutrients, 13(6), 2092.
Wellnitz, A., Wolff, J. P., Haubelt, C., & Kirste, T. (2019,
September). Fluid intake recognition using inertial
sensors. In Proceedings of the 6th international Work-
shop on Sensor-based Activity Recognition and Inter-
action (pp. 1-7).
Dong, B., & Biswas, S. (2017). Meal-time and duration
monitoring using wearable sensors. Biomedical Sig-
nal Processing and Control, 32, 97-109.
Cheng, J., Amft, O., & Lukowicz, P. (2010, May). Ac-
tive capacitive sensing: Exploring a new wearable
sensing modality for activity recognition. In Interna-
tional conference on pervasive computing (pp. 319-
336). Springer, Berlin, Heidelberg.
Cheng, J., Zhou, B., Kunze, K., Rheinl
¨
ander, C. C., Wille,
S., Wehn, N., ... & Lukowicz, P. (2013, September).
Activity recognition and nutrition monitoring in ev-
ery day situations with a textile capacitive neckband.
In Proceedings of the 2013 ACM conference on Per-
vasive and ubiquitous computing adjunct publication
(pp. 155-158).
Zhang, R., Freund, M., Amft, O., Cheng, J., Zhou, B.,
Lukowicz, P., ... & Chabrecek, P. (2016, September).
A generic sensor fabric for multi-modal swallowing
sensing in regular upper-body shirts. In Proceedings
of the 2016 ACM International Symposium on Wear-
able Computers (pp. 46-47).
Amft, O., & Troster, G. (2006, November). Methods for de-
tection and classification of normal swallowing from
muscle activation and sound. In 2006 Pervasive Health
Conference and Workshops (pp. 1-10). IEEE.
Amft, O., & Tr
¨
oster, G. (2008). Recognition of dietary ac-
tivity events using on-body sensors. Artificial intelli-
gence in medicine, 42(2), 121-136.
Moreau–Gaudry, A., Sabil, A., Benchetrit, G., & Franco,
A. (2005). Use of respiratory inductance plethysmog-
raphy for the detection of swallowing in the elderly.
Dysphagia, 20(4), 297-302.
Dong, B., & Biswas, S. (2012, August). Swallow moni-
toring through apnea detection in breathing signal. In
2012 Annual International Conference of the IEEE
Engineering in Medicine and Biology Society (pp.
6341-6344). IEEE.
Dong, B., & Biswas, S. (2013, May). Liquid intake monitor-
ing through breathing signal using machine learning.
In Sensing Technologies for Global Health, Military
Medicine, and Environmental Monitoring III (Vol.
8723, pp. 141-148). SPIE.
Dong, B., & Biswas, S. (2016). Analyzing breathing signals
and swallow sequence locality for solid food intake
monitoring. Journal of medical and biological engi-
neering, 36(6), 765-775.
Tatulli, E., Fontecave-Jallon, J., Calabrese, P., & Gumery,
P. Y. (2020). Respiratory Inductance Plethysmogra-
phy for Automated Swallowing Detection. Interna-
tional Journal of E-Health and Medical Communica-
tions (IJEHMC), 11(2), 64-77.
Nakafuji, H., Imura, M., Uranishi, Y., Yoshimoto, S., & Os-
hiro, O. (2014). Estimation of amount of swallowed
water by analysis of swallowing sounds. Biomedical
Engineering, 52(Supplement), O-11.
Kobayashi, Y., & Mineno, H. (2014, October). Fluid in-
take recognition for nursing care support by leverag-
ing swallowing sound. In 2014 IEEE 3rd Global Con-
ference on Consumer Electronics (GCCE) (pp. 620-
621). IEEE.
Amft, O., & Troster, G. (2006, November). Methods for de-
tection and classification of normal swallowing from
muscle activation and sound. In 2006 Pervasive Health
Conference and Workshops (pp. 1-10). IEEE.
Negi, S., Kumar, Y., & Mishra, V. M. (2016, September).
Feature extraction and classification for EMG signals
using linear discriminant analysis. In 2016 2nd In-
ternational Conference on Advances in Computing,
Communication, & Automation (ICACCA)(Fall) (pp.
1-6). IEEE.
Spiewak, C., Islam, M., Zaman, A., & Rahman, M.
H. (2018). A comprehensive study on EMG feature
extraction and classifiers. Open Access Journal of
Biomedical Engineering and Biosciences, 1(1), 1-10.
Estimation of Fluid Intake Volume from Surface Electromyography Signals: A Comparative Study of Seven Regression Techniques
123

Hara, K., Tohara, H., Kobayashi, K., Yamaguchi,
K., Yoshimi, K., Nakane, A., & Minakuchi, S.
(2018). Age-related declines in the swallowing mus-
cle strength of men and women aged 20–89 years:
A cross-sectional study on tongue pressure and jaw-
opening force in 980 subjects. Archives of Gerontol-
ogy and Geriatrics, 78, 64-70. Chicago
What factors affect EMG signal quality? – Signal Qual-
ity Mon- itor. Delsys. (2020, June 24). Retrieved June
23, 2022, from https://delsys.com/emgworks/signal-
quality-monitor/factors/
BIOSIGNALS 2023 - 16th International Conference on Bio-inspired Systems and Signal Processing
124
