
Prostate Cancer Detection, Segmentation, and Classification using Deep
Neural Networks
Yahia Bouslimi, Takwa Ben A
¨
ıcha Gader
a
and Afef Kacem Echi
b
National Superior School of Engineering, University of Tunis, LR: LATICE, Tunisia
Keywords:
Prostate Cancer, Computer-aided Diagnosis, Convolutional Neural Network, Magnetic Resonance Imaging,
MultiResU-Net, U-Net.
Abstract:
This paper provides a fully automated computer-aided medical diagnostic system that assists radiologists in
segmenting Prostate Cancer (PCa) Lesions from multi-parametric Magnetic Resonance Imaging (mp-MRIs)
and predicting whether those lesions are benign or malignant. For that, our proposed approach used deep
learning neural networks models such as residual networks (ResNet) and inception networks to classify clini-
cally relevant cancer. It also used U-Net and MultiResU-Net to automatically segment the prostate lesion from
mp-MRI’s. We used two publicly available benchmark datasets: the Radboudumc and ProstateX. We tested
our fully automatic system and obtained positive findings, with the AUROC of the PCa lesion classification
model exceeding 98.4% accuracy. On the other hand, the MultiResU-Net model achieved an accuracy of
98.34% for PCa lesion segmentation.
1 INTRODUCTION
Prostate Cancer (PCa) is a common type of cancer
that affects the prostate gland, a small walnut-shaped
gland in the male reproductive system. It is the sec-
ond most common type of cancer in men worldwide,
with an estimated 1.4 million new cases diagnosed
each year, which is nearly (7.3%) of the total can-
cer cases worldwide.(Sung, 2021) The majority of
prostate cancer cases occur in men over the age of
65, and the risk of developing the disease increases
with age. The highest incidence rates of prostate can-
cer are found in North America, Europe, and East-
ern Asia, while it is less common in the other parts
of Asia and Africa.(global cancer observatory, ) De-
spite of the mortality rate for prostate cancer has been
decreasing in many countries due to improvements
in early detection and treatment. Current diagnostic
methods, such as digital rectal examination, PSA lev-
els, and biopsies, are imprecise (Nabil and Rahman,
2020). In most situations, those used in cancer screen-
ing procedures are insufficient to effectively identify,
locate, and describe it, resulting in poor ultrasound
imaging quality. Furthermore, the biopsy samples
still just a group of random specimen that can be inac-
a
https://orcid.org/0000-0002-3786-3649
b
https://orcid.org/0000-0001-9219-5228
curate by missing their target. Multi-parametric Mag-
netic Resonance Imaging (mp-MRI) has emerged as
a promising area of medical diagnosis research in re-
cent years. It has shown promising results since its lo-
calization skills opened new avenues for critical PCa
detection, diagnosis, localization, risk stratification,
and clinically significant PCa staging. Despite the
increasing use of mp-MRI for PCa screening, there
remains a significant need for uniformity in the in-
terpretation of mp-MRI images. Given the process’s
difficulty and intricacy, the radiologist frequently de-
pends solely on visual interpretation to complete the
work, which is complex. This could lead to inaccu-
racies and significant inter-reader variability in diag-
nosis, especially when the mp-MRI sequences con-
tradict one other. When images contradict each other,
a Computer-Aided Decision-making System (CAD)
can reduce the rate of inaccurate diagnoses and pro-
vide better results. Given the use of deep learning ap-
proaches in biomedical image classification and seg-
mentation, we propose a deep learning-based CAD to
assist radiologists in diagnoses and decision-making.
It is about a MultiResU-Net, an enhanced version of
the basic U-Net that allows it to run with fewer train-
ing sets while still providing accurate segmentation.
We will discuss the state-of-the-art PCa diagnostics-
based deep learning approaches in the upcoming sec-
tion. In the third section, we will describe and pre-
534
Bouslimi, Y., Gader, T. and Echi, A.
Prostate Cancer Detection, Segmentation, and Classification using Deep Neural Networks.
DOI: 10.5220/0011795100003411
In Proceedings of the 12th International Conference on Pattern Recognition Applications and Methods (ICPRAM 2023), pages 534-541
ISBN: 978-989-758-626-2; ISSN: 2184-4313
Copyright
c
2023 by SCITEPRESS – Science and Technology Publications, Lda. Under CC license (CC BY-NC-ND 4.0)

process the used data. We will present our proposed
deep learning model architectures in the fourth sec-
tion. Afterward, we will report our findings and com-
pare them to previous research. Finally, we conclude
by providing some insight into our future research.
2 RELATED WORKS
In the last few recent years, There has been many
research aiming to assist radiologists in appropri-
ately segmenting, locating, and identifying clinically
significant prostate cancer. We can mention (Liu
et al., 2017) used XmasNet, a CNN-based classifier
to categorize mp-MRI prostate cancer lesions on the
PROSTATEx dataset. With an AUC of 0.84, Xmas-
Net surpassed all typical machine learning models for
training and testing data. (Vente and Vos, 2021), on
the other hand, used 2D U-Net with MRI slices as
input and lesion segmentation maps that encode the
GGG By achieving a voxel-wise weighted kappa of
0.446% and a Dice similarity coefficient of 0.37%,
the model beats traditional multi-class classification
and multi-label ordinal regression. (Lehaire, 2016),
on the other hand, used their data, which included a
49-patient mp-MRI database and SVM-L and logis-
tic regression, to construct a CADe that generated a
cancer probability map for the radiologist. The draw-
back was that they built using the dictionary learning
method, and the dictionaries were approximated from
the features of previously retrieved images. Although
their results were statistically superior to the other
CADe diagrams, this difference needed to be more
evident on the sample probability maps. Meanwhile,
(Yunzhi Wang and Wang, 2018) demonstrated in
2018, the mp-MRI-based segmentation scheme out-
performs earlier T2W-based schemes by using a state-
of-the-art Fully Convolutional Network (FCN) archi-
tecture with residual connections to segment prostate
mp-MRI. (To et al., 2018), on the other hand, used a
3D deep, dense multi-path Convolutional Neural Net-
work (CNN) based on the encoder-decoder architec-
ture to segment the prostate in MRI images on two
distinct datasets. The encoder is composed of densely
connected layers, and the decoder interprets the fea-
tures and predicts the total prostate volume.
The developers of (Dai Z, 2020) used the
PROSTATEx dataset in their two-stage approach in
2019. They used a poorly supervised deep neural
network to detect and classify lesions after training
a Mask R-CNN model to segment the prostate struc-
tures automatically. On their validation set, this work
attained an average AUC of 0.912% and 0.882%.
(Zhenzhen Dai, 2019) employed Mask-RCNN for
prostate segmentation and Dominant Intra-prostatic
Lesion (DIL) segmentation and localization using
Mp-MRI in the same scenario. Furthermore, (Karimi
et al., 2019) trained two different CNNs to produce a
global CNN to create an automatic prostate segmenta-
tion method in T2-weighted images (T2w) in prostate
MRI sequence
Furthermore, in (Stahl, 2020), the authors used
a Genetic Algorithm to fine-tune a trained CNN for
PCa detection to get a higher AUC on their 6-channel
diffusion-weighted prostate MRI dataset. On their
test dataset, this work yielded an AUC of 0.707. (Yoo
et al., 2019) also created and implemented an auto-
mated CNN-based process to detect clinically signifi-
cant PCa in axial DWI images for each patient.
The authors of (Neto, 2020) published a deep
learning-based study of PCa via mp-MRI in 2020.
They experimented with numerous models, including
3D U-net, 3D Res-Net, and XmasNet. The outcome
was a DICE value of roughly 0.69, whereas other
researchers received a DICE score of 0.83. Mean-
while, (Liu, 2020) suggested a Pytorch V-Net deep
learning framework architecture on volumetric CNN
by borrowing the U-net network and dividing it into
residual stages of learning to conduct rapid and ac-
curate MRI prostate volume segmentation. (Nuhi
´
c
and Kevric, 2020) developed a novel PCa clinical
management prototype using nine classification al-
gorithms in a PCa database. The classification rate
for authors is 98.71%. For the AdaBoost classi-
fier, sensitivity was around 97.4%, while specificity
was perfect and equivalent to 100%. Other algorithms
(Nave Bayes, Multi-layer Perception, Simple Logis-
tics, Nearest Neighbor, Random Committee, PART,
LMT, and Random Forest) also produced excellent re-
sults.
The authors of (Andrew Hwang, 2021) trained and
evaluated 13 different CNN architectures (binary clas-
sification models) on Raudboundumc MRI scans of
204 patients suspected of having prostate cancer, the
same one we utilized in our study. The best model
has an accuracy of 86.9% and an area under the ROC
(AUROC) of 90.3% percent. (B. Liu, 2021) pro-
posed an improved 2D U-Net model with an included
Squeeze-and-Excitation (SE) layer for prostate seg-
mentation using the public dataset PROMISE12 in
the same year (2021). The model is built around
an encoder stage that uses CONV blocks, SE lay-
ers, and max-pooling layers to extract features from
the input and a decoder stage that maps the returned
features to the original image. Experiments demon-
strated that the suggested model might outperform
other approaches in terms of segmentation accuracy
and DSC, with a mean DSC of 87%.
Prostate Cancer Detection, Segmentation, and Classification using Deep Neural Networks
535
3 DATA PRE-PROCESSING
We used two separate datasets in this study. We ini-
tially used the Radboudumc dataset (see Table 1) for
PCa classification. Following that, we used PRosta-
teX for PCa segmentation. The ProstateX dataset is
made up of 345 mp-MRI studies, and these studies
were split into training and test datasets. The train-
ing set consists of 204 mp-MRI studies, each involv-
ing one patient. Each study includes a T2w image
sequence, DW with b-values of b50, b400, and b800
s/mm2, an apparent diffusion coefficient (ADC) map
(derived from the b-values), and Ktrans (computed
from dynamic contrast-enhanced-DCE-T1-weighted
series). The ProstateX2 challenge, which uses the
same data as ProstateX, should produce one to four le-
sion sites (points indicating their position on the mp-
MRI sequences) per patient; the average is 1.62. The
lesion’s location was documented under a competent
radiologist’s supervision. The test set consists of 140
mp-MRIs containing all previously specified informa-
tion.
Table 1: Detailed Radboudumc PCa Dataset Description.
Modalities MRI
Patients 204
Findings 326
Images before data augmentation 326
Images after data augmentation 1956
The only drawback with the Radboudumc dataset
was that it lacked lesion masks and needed cleaning
and cropping. Image cropping was required to re-
move unnecessary data (muscle, bones, tissues) and
leave only the prostate zone and its environs. Ini-
tially, we set the supplied lesion coordinate as our im-
age center; we took a 348 × 348 × 3 image as input;
we cropped it from all sides by 102 pixels, leaving
just an image of the prostate zone with a shape of
144 × 144 × 3. A similar procedure was performed
on ADC and Ktrans. The missing masks have to be
generated automatically. As a result, we extracted the
ROI (lesion) coordinates for each discovery ID num-
ber from the attached CSV data and grew a region of
5 × 5 white pixels in both height and width, where the
white box represents the mask. Then, to coincide with
the mp-MRI images, we constructed a 144 × 144 × 3
image with that box in the center. The result is shown
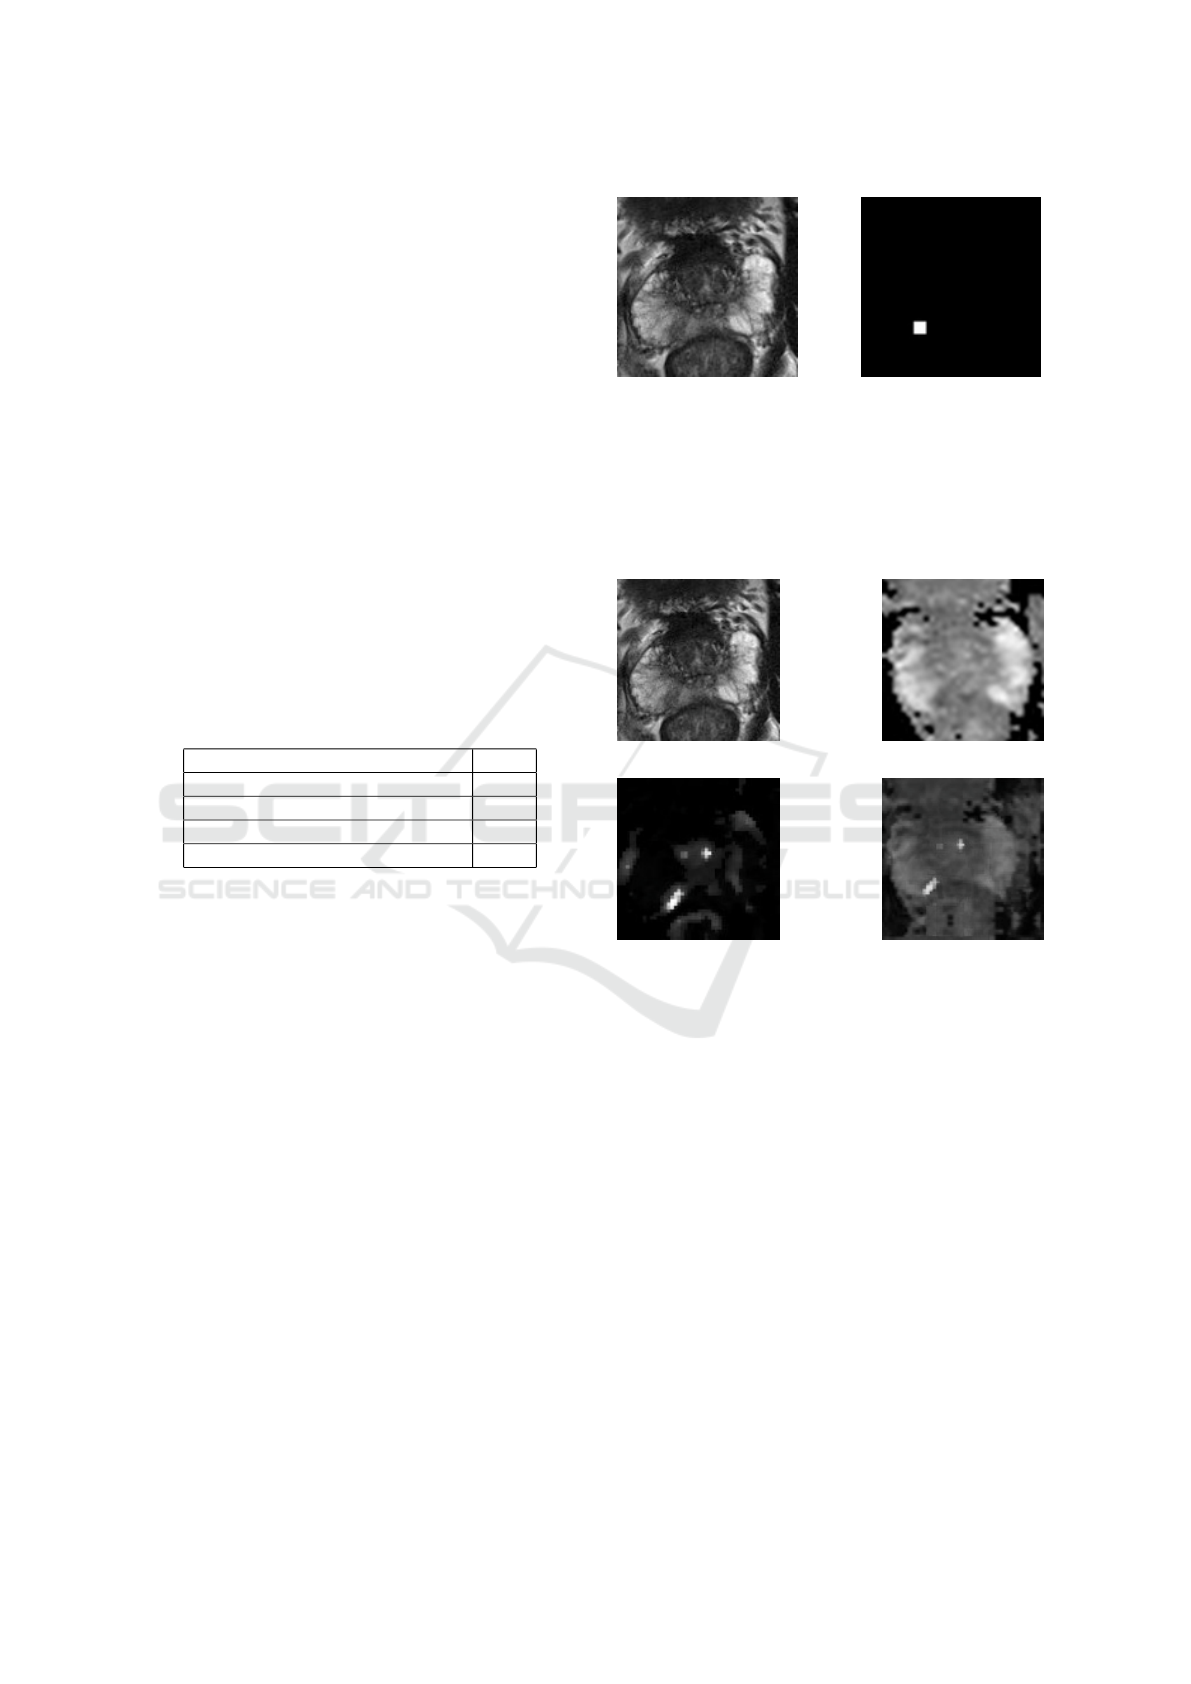
in figure 1, where (a) is an image of a cropped T2W
image and (b) is a cropped mask.
We also needed to undertake some data augmenta-
tion, but first, we needed to integrate our mp-MRI se-
quences to visualize the lesion better. As a result, we
combined the T2W images with the ADC and Ktrans
(a) T2w MRI image (b) Result
Figure 1: mp-MRI used images.
MRI images. Figure 2 shows an example of the re-
sult, where (a) represents a cropped T2W image, (b)
and (c) are the matching ADC and Ktrans, and (d)
represents the merged image.
(a) T2w (b) ADC
(c) Ktrans (d) Result
Figure 2: mp-MRI used images.
We needed to preprocess the mp-MRI images for
the ProstateX dataset to clean the data and enrich the
images with extra information relevant to model train-
ing and testing. As a result, we cropped all T2w pho-
tos surrounding the prostate to have dimensions of
160 × 160 × 24 with a spacing of (0.5, 0.5, 3) mm.
Following that, we used third-order B-Spline inter-
polation for all image interpolation tasks, whereas
Gaussian label interpolation was used for segmenta-
tion masks. Only the location of the lesion center is
included in the ProstateX dataset. So we had to grow
them from the specified coordinates; the technique
is the same as in the Radboudumc dataset, except
that we utilized a threshold level set method from the
Python module SimpleITK72, which produces bet-
ter results and more visible boundary contours. We
thought about using prostate zone masks because the
radiologist could need such information.
ICPRAM 2023 - 12th International Conference on Pattern Recognition Applications and Methods
536
We also did some data augmentation on the
cropped and merged mp-MRI pictures to increase the
image quantity, improve our model performance, and
avoid over-fitting. As a result, the data pool was ex-
panded by eleven-folds, and the number of images
and masks grew from 326 to 3586. After applying im-
age distortions, liquefying, and inward zooming tech-
niques, the zoom for each image and mask was ran-
dom (less or equal to 50%). We also used horizon-
tal and vertical mirroring and random rotations up to
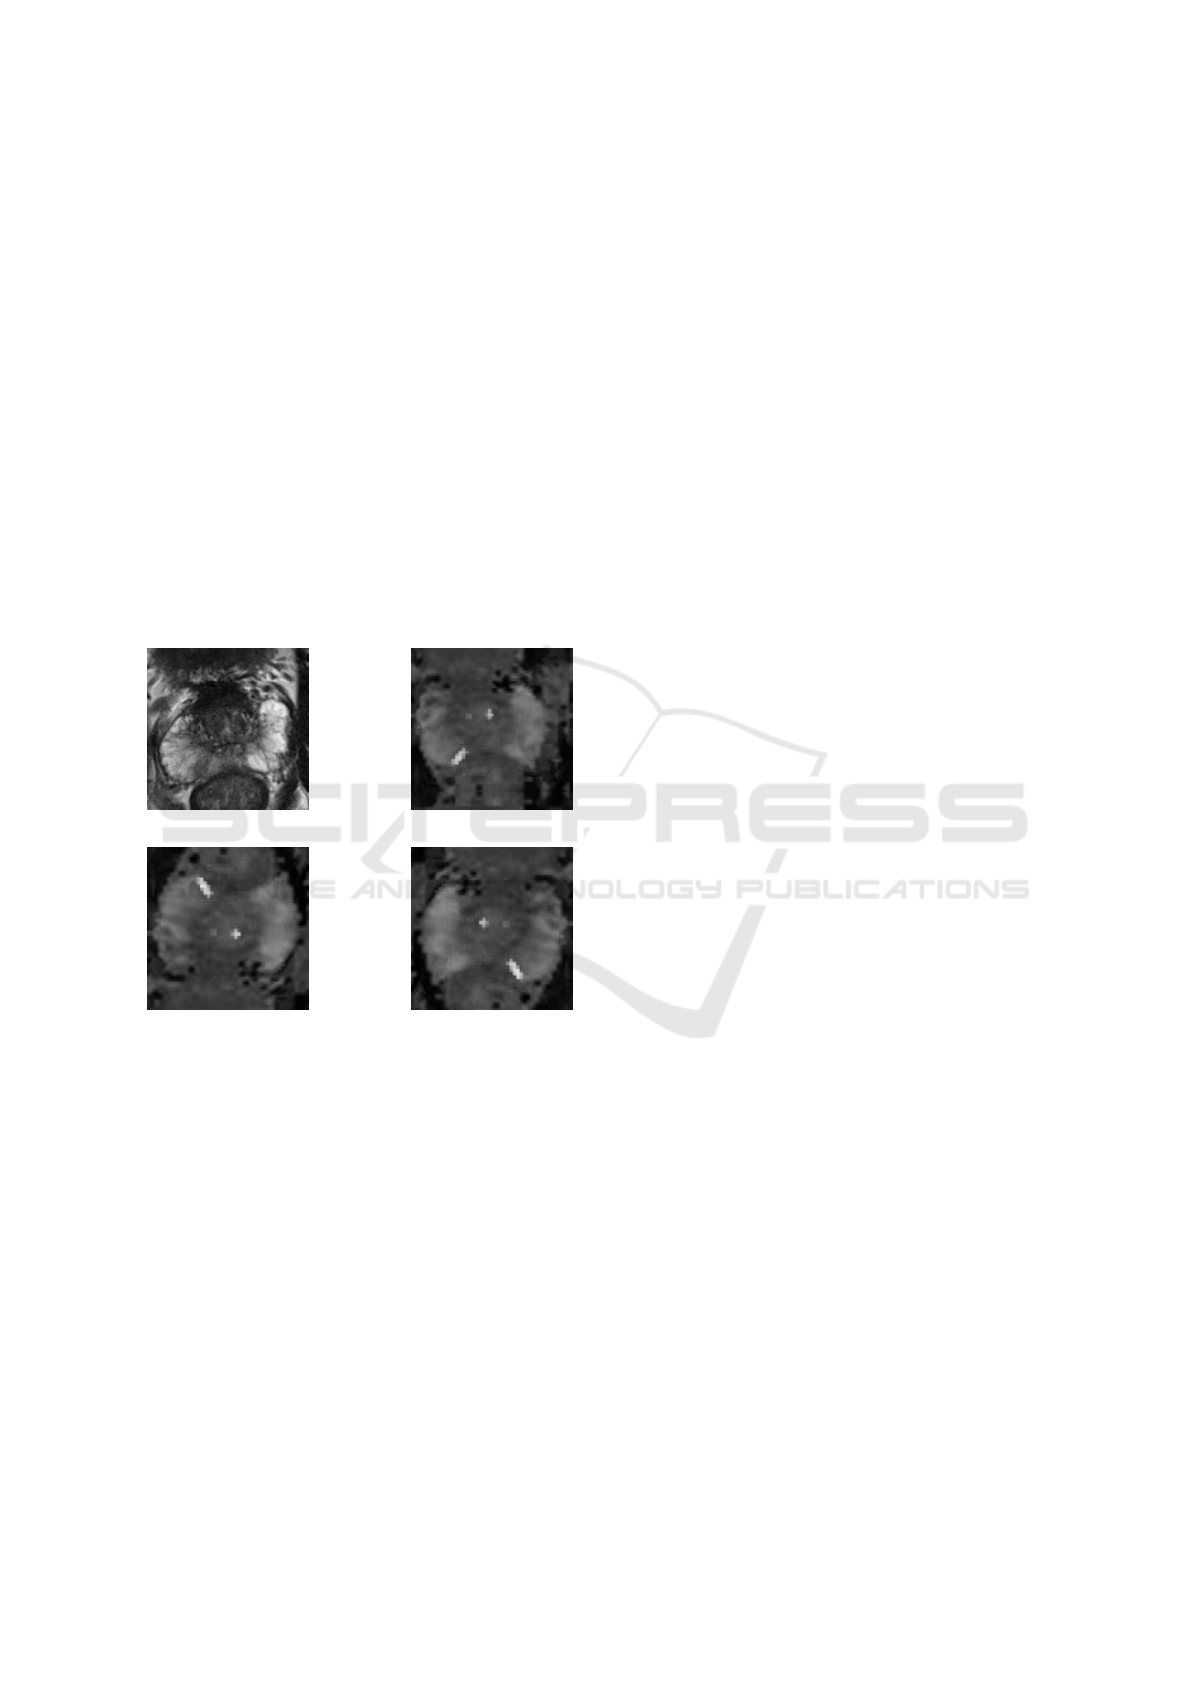
20 degrees off their original axes. Figure 3 depicts
an example of the data augmentation procedure on an
image. 3(a) and (b) are original images of a merged
T2W, ADC, and Ktrans sequence, whereas (c) and
(d), are examples of augmented images. We randomly
divided the dataset into training and testing datasets
in 1 to 7 ratios once it was complete. Consequently,
we obtained 3075 photos (or 85.72%) for training and
513 images (or 14.28%) for testing.
(a) Original (b) Original copy
(c) rotated (d) Mirrored
Figure 3: Example of augmented images.
We took a different strategy with ProstateX. To
correctly apply some significant 3D data augmenta-
tion, we applied rigid and non-rigid transformations
derived from scaling, rotations, and elastic deforma-
tions. In terms of data splitting, the ProstateX design-
ers have already divided it into train and test datasets.
4 PROPOSED DEEP MODELS
We used two separate model groups. The first in-
cludes the ResNet50, ResNet101 V2, and ResNet152
V2 models. We used it to differentiate between se-
vere and benign lesions in the PCa classification chal-
lenge. For the PCa segmentation or semantic seg-
mentation of PCa lesions, we used the second model
group, which includes the U-Net and MultiResUnet
models.
4.1 PCa Classification
For PCa classification, we attempt to determine
whether or not there is a malignant lesion in the sup-
plied prostate mp-MRI image. To construct a good
classifier, we used deep learning models. We tested
four models to see which would produce the most sig-
nificant results: we used InceptionV3, the ResNet50,
the ResNet101 V2, and the ResNet152 V2. Compared
to other models, Both InceptionV3 and ResNet50
(see figure 4)produced the most promising results.
The ResNet50 architecture enables large numbers of
convolutional layers to function efficiently. Adding
many deep layers in ResNet50, ResNet101 V2, and
ResNet152 V2 has significant drawbacks; for exam-
ple, they generate vanishing gradient difficulties, re-
sulting in a degradation of output and training perfor-
mance.
4.2 PCa Segmentation
For PCa segmentation, we used an mp-MRI image
(DICOM format) as input and performed automatic
seamless prostate lesion segmentation. We saved
computer resources by decompressing and transform-
ing DICOM data into a more legible format: a series
of two-dimensional images in PNG format. Then we
cut their size by half (making all photos (128 × 128)
in size). Finally, the proposed system uses the trained
segmentation model (MultiResU-Net) to segment and
locate the prostate lesion in the input images.
The MultiResU-Net architecture is inspired by the
U-Net architecture, as seen in figure 5. As a re-
sult, it has the symmetrical shape of a ’U’, and it is
made up of an encoder, a decoder, and a MultiRes-
Path that relies on them. The encoder extracts the
main features from the input images before passing
them to the decoder, which creates the corresponding
segmentation map from the extracted features. As for
MultiResPaths, they have upgraded skip connections
that rely on the encoder and decoder together. All
these components have been collected and combined
in MultiResU-Net to form MultiResBloc, which sub-
stitutes the skip connection.
The MultiRes block not only substitutes the U-
three Net’s convolutions but also outperforms them
by learning additional spatial information. It was con-
structed on the ResNet architecture. This skip link is
helpful in biomedical image segmentation. Jump be-
tween convolutional layers to mitigate, if not elimi-
Prostate Cancer Detection, Segmentation, and Classification using Deep Neural Networks
537
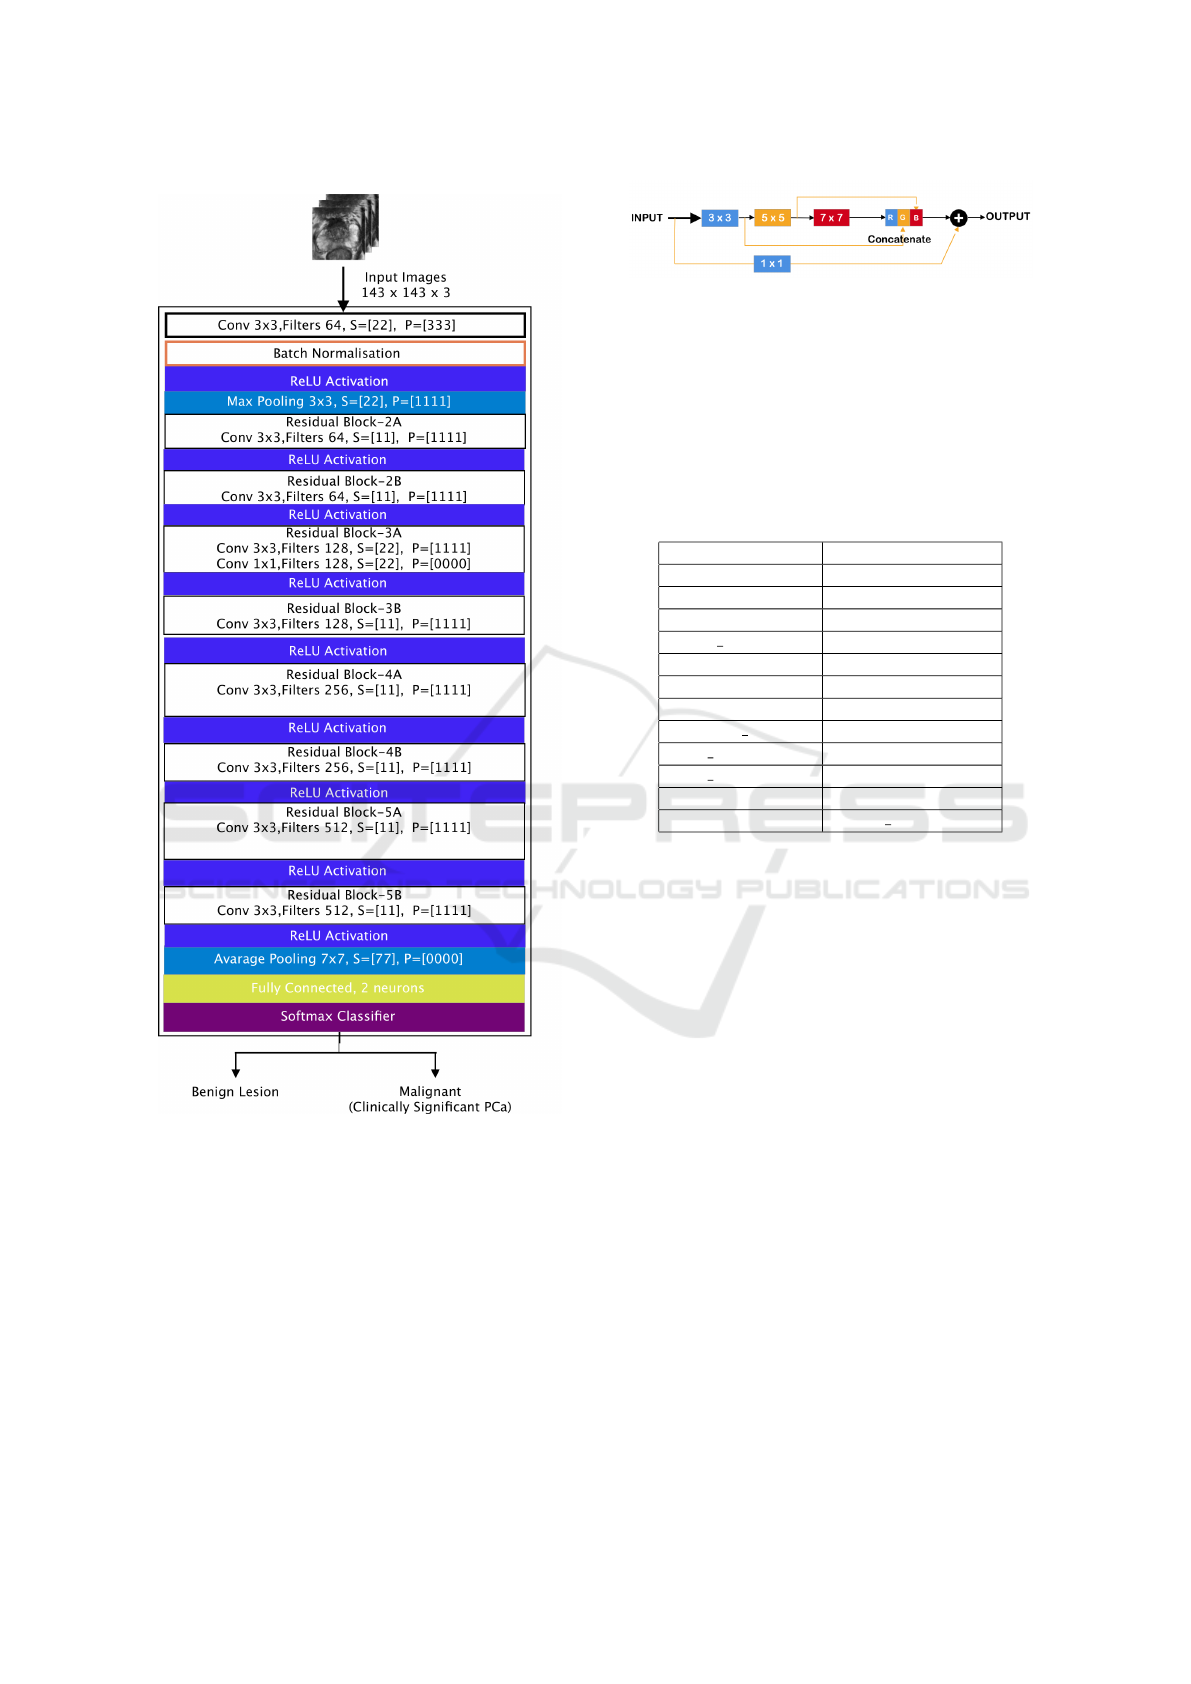
Figure 4: Used ResNet50 architecture.
nate, the vanishing gradient problem induced by nu-
merous deep CNN layers, as seen in figure 5. Fur-
thermore, the MultiRes block gradually increases the
number of filters to reduce memory loss, whereas the
standard U-Net architecture uses an equal number of
filters on each layer. MultiResU-Net gradually raised
the number of filters from 3 × 3, 5 × 5 to 7 × 7 and
concatenated them using the residual connection of
1 × 1 filter to conserve dimensions while learning and
avoiding the vanishing gradient problem.
MultiResU-Net transformed U-Net by introduc-
ing shortcut connections between convolutional lay-
Figure 5: MultiResUNet block architecture.
ers before and after max-pooling (skip connections).
During the pooling procedure, the latter allows the
network to send spatial information from the encoder
to the decoder. The skip connections are subjected
to a number of non-linear modifications. To facilitate
learning, these transformations are convolutional lay-
ers paired with residual connections.
Table 2: MultiResU-Net Models Hyperparameter.
Hyperparameter MultiResU-Net
Train images 1564
Validation images 392
Epochs 50
Batch size 30
batch size 15
Alpha 1.36
Optimizer ‘adamax’
Learning rate 0.0005
Beta 1 0.8
Beta 2 0.888
Epsilon 1e-07
Loss binary crossentropy
As a result, the feature is subjected to a convo-
lutional layer sequence. These two are linked via
residual links. The output will then be concatenated
with the decoder features. Our model architecture
is depicted in 6. Its overall architectural shape is
highly similar to that of U-Net. It comprises 13
Multires-Blocks layers, replacing the traditional U-
Net sequences with two convolutional layers. To
make the model more resilient and reduce over-fitting,
we added a 30% dropout function to each multires-
block. Additionally, we eliminated the skip connec-
tions of the U-casual Net in favor of ResPaths. The
same is true for ResPaths, which have a 30% dropout
function. Table 2 displays a detailed description of
the parameters used during the training process.
5 EXPERIMENTATION AND
RESULTS DISCUSSION
5.1 PCa Classification
We aim to assess whether each mp-MRI shows a
clinically significant cancer or a benign lesion. It is
a straightforward binary classification; initially, we
ICPRAM 2023 - 12th International Conference on Pattern Recognition Applications and Methods
538
Table 3: Used classification models results.
Model Accuracy Precision Specificity Recall/Sensitivity AUROC
InceptionV3 96.3% 90.8% 98% 92.5% 98.4%
ResNet50 94.7% 83.4% 95% 93.5% 98%
ResNet101V2 92.6% 80% 92.65% 92.3% 92.2%
ResNet152V2 90.3% 68% 91.46% 84.61% 90.5%
Figure 6: MultiResU-Net model architecture (Nabil and
Rahman, 2020).
picked U-Net because it is one of the finest models for
processing biomedical images ranging from mp-MRI
to ultrasound and microscopic images. However, be-
cause it was designed for semantic segmentation, it
still has numerous limitations in mp-MRI image cat-
egorization. As a result, we attempted to predict PCa
from mp-MRI using a distinct variety of pre-trained
ResNet architectures and Inception-V3 CNNs. Our
models were trained across 150 epochs.
The ResNet50 performed best at epoch 62, while
InceptionV3 performed admirably at epoch 149.
ResNet50 beats both ResNet101-V2 and ResNet152-
V2 in all fields, as shown in Table 3. It has a higher
area under the receiver operating characteristic (AU-
ROC) score (98%) than its siblings ResNet101V2
and ResNet152-V2, which had 92.2% and 90.5%, re-
spectively. The same is true for accuracy, precision,
and sensitivity, which ResNET50 has scored sequen-
tially (94.7%, 83.44%, 95.4%, and 93.5%), outper-
forming ResNet101V2 scores. It is also worth noting
that this latter outperformed ResNet152-V2 in preci-
sion and recall (80% vs. 68% for precision and 92.3
vs. 84.61%) and slightly beat it in the other metrics.
Inception-V3, on the other hand, surpassed ResNet50
in all metrics except recall, which was lower than ex-
pected from Inception-outstanding V3’s performance.
Our top model got 96.3%, 98%, and 98.4% for accu-
racy, precision, and AUROC, which is much higher
than most achieved outcomes in the field.
The table 4 show the AUROC curves results. The
four models produce good results, above 90%, and
the InceptionV3 gives nealy perfect result of 98.4%.
They also gave a noisy loss and accuracy curves in the
beginning that leans to be stedy over time. ResNet50
outperforms his siblings in the learning rate, gradually
increasing with wavy movements to achieve high ac-
curacy in the training and testing phases. in our case,
InceptionV3 surpassed ResNet50 by a small perse-
nage and shows a good fit of training and validation
loss curves. Similarly, the other models provide a
good fit; however, the curves were slightly noisier
than ResNet50’s.
5.2 PCa Segmentation
Reacently, many attempts have been undertaken to
auto-segment Prostate cancer utilizing deep learning-
based approaches. The research ranges from seg-
menting the prostate’s normal zonal structure to PCa
lesions, but an agreement has yet to be reached on the
combination of input sequences of mp-MRI images.
In this study, we used MultiResU-Net to automati-
cally generated Lesion masks from mp-MRI’s. We
found that the three recognized models behaved simi-
larly. The indicated models in Table 5 showed equiv-
alent results when segmenting the PCa lesions from
the PROSTATEx dataset (DSC of 52.73, 41, 37.46
percent consecutively for (Lai and Shen., 2021), (?),
(Vente and Vos, 2021)). The Modified-SegNet model
produced consistently improved results. Our model
performance, however, outperformed this with a Dsc
of 59%. Previous studies that used simple T2W im-
ages for training came to the same conclusion. To
reach this result, we combined our T2W, ADC, and
Ktrans MRI images as three channels of an RGB im-
age. Regarding test accuracy findings, shown in Ta-
ble 5, our employed model beats the modified SegNet
model presented in (Lai and Shen., 2021). The latter
has an accuracy of 96.97%, whereas our model has
an accuracy of 98.14% and a loss of 0.074%. Simi-
larly, our model beat other models in terms of AUC.
We received a score of 74%, compared to the 90%,
94%, and 84% obtained by (Lai and Shen., 2021)
((Song, 2018), (Vente and Vos, 2021)). Furthermore,
the ground truths are generated automatically rather
than delivered by an expert. As a result, the train-
ing masks were more general than the generated ones;
they differed in shape and form and were particular to
the lesion, unlike the automatically created mask.
Prostate Cancer Detection, Segmentation, and Classification using Deep Neural Networks
539
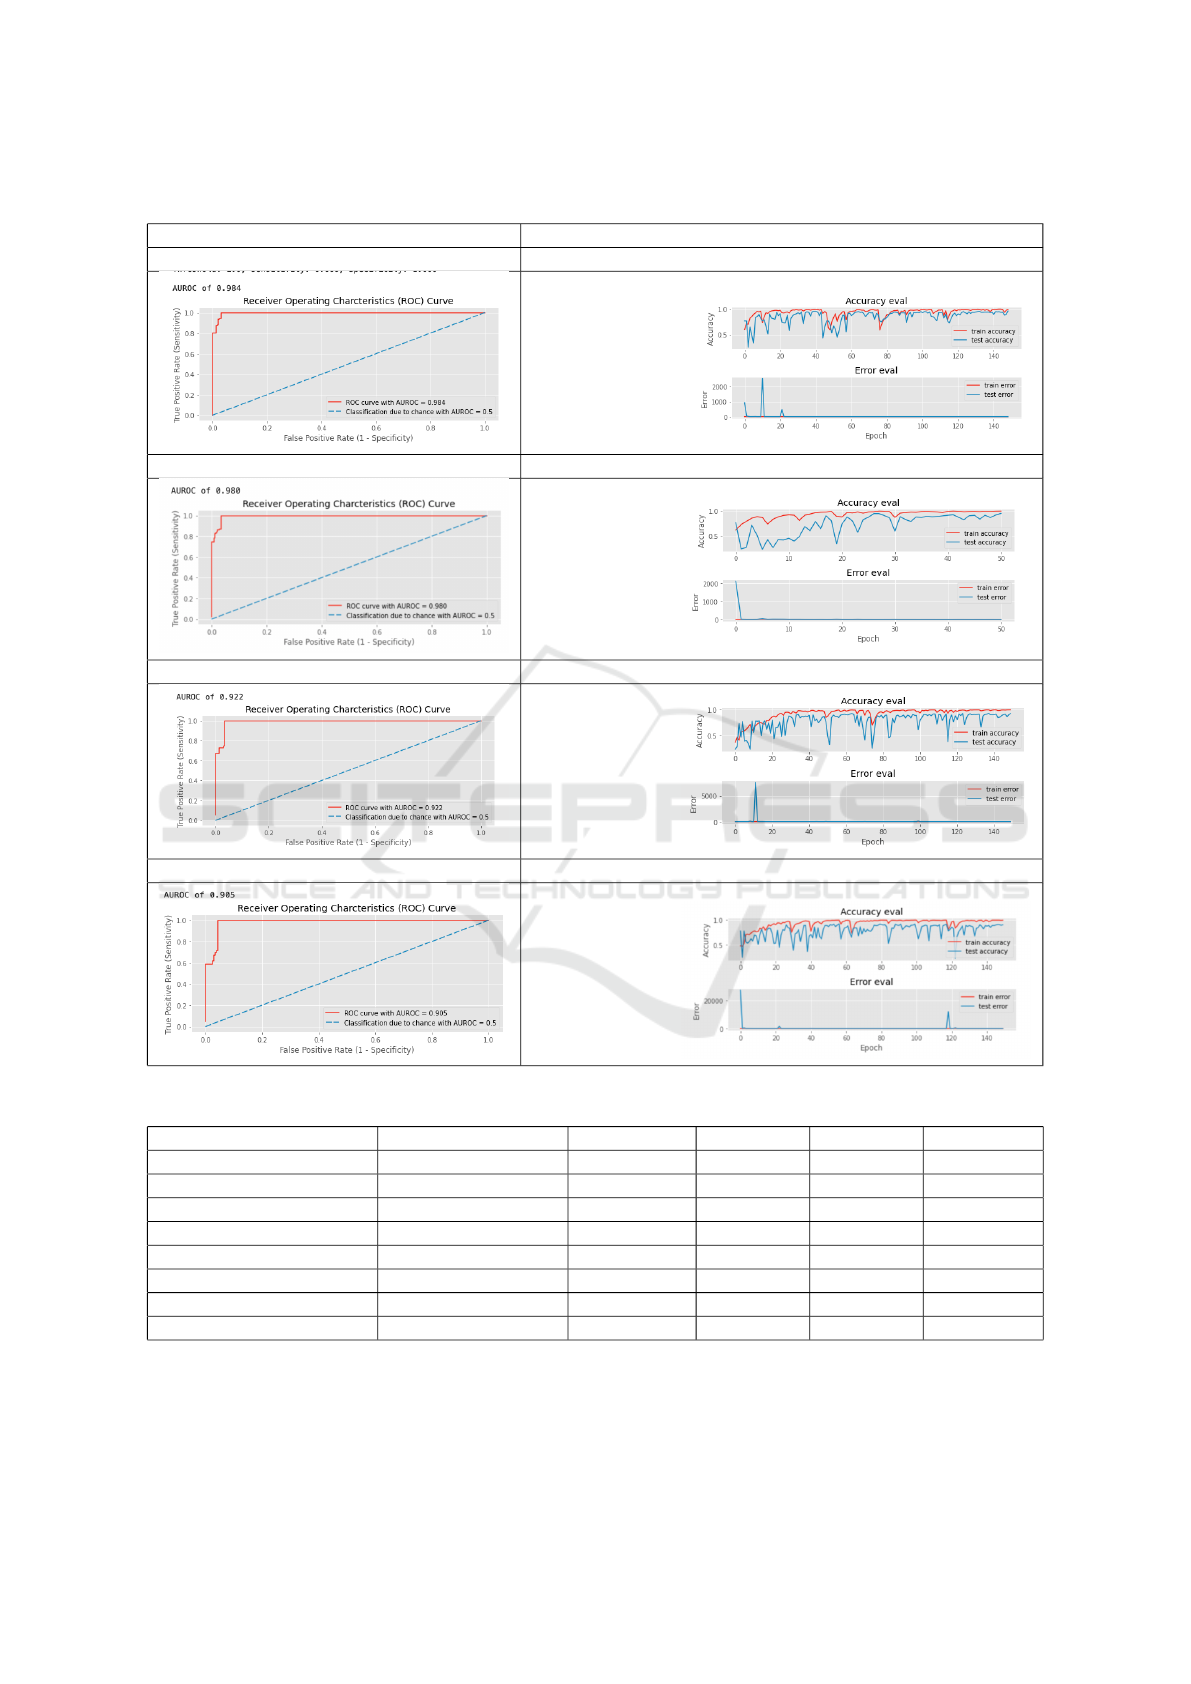
Table 4: Prostate cancer classification curve results.
AUROC CURVE ACCURACY/LOSS CURVE
InceptionV3 AUROC curve InceptionV3 accuracy/loss curve
AUROC CURVE ACCURACY LOSS CURVE
AUROC CURVE ACCURACY LOSS CURVE
AUROC CURVE ACCURACY LOSS CURVE
Table 5: MultResU-Net Performance Comparison.
Author Model Accuracy Loss DSK AUROC
Our work MultiResU-Net 98.34% 0.074% 59% 74%
(P.Valero and et al., 2021) Retina-U-Net 100% - 79% 95%
(P.Valero and et al., 2021) Retina-U-Net 100% - 37.5% 87%
(Lai and Shen., 2021) Modified-SegNet 96.97% - 52.73% 90%
(Vente and Vos, 2021) U-Net - - 37.46% -
(P.Valero and et al., 2021) Retina-U-Net - - 100% 87%
(Song, 2018) VGG-Net - - - 94%
(Liu et al., 2017) XmasNet - - - 84%
ICPRAM 2023 - 12th International Conference on Pattern Recognition Applications and Methods
540

6 CONCLUSION
A CAD for fully automatic Pca segmentation, and
classification of mp-MRI images was reported in
this study. We tested it using two publicly avail-
able benchmark databases: the RadboudUMC dataset
and the ProstateX dataset. Our proposed system has
demonstrated high efficiency in all the key operations
for which it was designed. It achieved a classification
accuracy of 96.3% and an AUROC of 90% with In-
ceptionv3 model. Likewise, for segmentation using
MultiResUnet, it achieved 98.34% percent accuracy
with a 74% AUC, which can still be improved with a
few more tweaks. The proposed models could learn
more global and local features and produce better re-
sults. We are now working on determining the PCa
Gleason grade using mp-MRI. In future work, we aim
to improve the performance of the proposed model.
We also intend to test the model on other benchmark
databases and use it to detect and segment different
cancer kinds to demonstrate the approach’s generaliz-
ability.
REFERENCES
Andrew Hwang, Emlyn Evans, E. M. J. L. S. J. . T. L.
(2021). Research report on deep learning methods in
prostate cancer.
B. Liu, J. Zheng, P. C. S. L. C. L. (2021). An improved 2d u-
net model integrated squeeze-and-excitation layer for
prostate cancer segmentation.
Dai Z, Carver E, L. C. e. a. (2020). Segmentation of the Pro-
static Gland and the Intraprostatic Lesions on Multi-
parametic Magnetic Resonance Imaging Using Mask
Region-Based Convolutional Neural Networks., pages
5(3):473–481.
global cancer observatory. Cancer today.
Karimi, D., Samei, G., Shao, Y., and Salcudean, S. E.
(2019). A deep learning-based method for prostate
segmentation in t2-weighted magnetic resonance
imaging. ArXiv, abs/1901.09462.
Lai, Chih-Ching, H.-K. W. F.-N. W. Y.-C. P. T.-P. L. H.-
H. P. and Shen., S.-H. (2021). Autosegmentation of
prostate zones and cancer regions from biparametric
magnetic resonance images by using deep-learning-
based neural networks.
Lehaire, J. (2016). D
´
etection et caract
´
erisation du cancer de
la prostate par images irm 1.5t multiparam
´
etriques.
Liu, S., Zheng, H., Feng, Y., and Li, W. (2017). Prostate
cancer diagnosis using deep learning with 3d multi-
parametric mri.
Liu, Y. (2020). 3d image segmentation of mri prostate based
on a pytorch implementation of v-net.
Nabil, I. and Rahman, M. S. (2020). Multiresunet: Rethink-
ing the u-net architecture for multimodal biomedical
image segmentation.
Neto, P. (2020). Deep learning based analysis of prostate
cancer from mp-mri.
Nuhi
´
c, J. and Kevric, J. (2020). Prostate Cancer Detection
Using Different Classification Techniques, pages 67–
73.
P.Valero, O. J. and et al., J. L. (2021). Deep learning for
fully automatic detection, segmentation, and gleason
grade estimation of prostate cancer in multiparametric
magnetic resonance images.
Song, Y.; Zhang, Y. (2018). Computer-aided diagnosis of
prostate cancer using a deep convolutional neural net-
work from multiparametric mri.
Stahl, B. (2020). deepSIP: deep learning of Supernova
Ia Parameters. Astrophysics Source Code Library,
record ascl:2006.023.
Sung, H. e. a. (2021). “global cancer statistics 2020: Globo-
can estimates of incidence and mortality worldwide
for 36 cancers in 185 countries.”.
To, M., Vu, Q., Turkbey, B., Choyke, P., and Kwak, J. T.
(2018). Deep dense multi-path neural network for
prostate segmentation in magnetic resonance imaging.
International Journal of Computer Assisted Radiology
and Surgery, 13.
Vente, C. and Vos, P. (2021). Deep learning regression for
prostate cancer detection and grading in bi-parametric
mri.
Yoo, S., Gujrathi, I., Haider, M., and Khalvati, F. (2019).
Prostate cancer detection using deep convolutional
neural networks.
Yunzhi Wang, Bin Zheng, D. G. and Wang, J. (2018).
Fully convolutional neural networks for prostate can-
cer detection using multi-parametric magnetic reso-
nance images: an initial investigation.
Zhenzhen Dai, Eric Carver, C. L. J. L. A. F.-W. Z. M. P. M.
E.-N. W. (2019). Segmentation of the prostatic gland
and the intraprostatic lesions on multiparametic mri
using mask-rcnn.
Prostate Cancer Detection, Segmentation, and Classification using Deep Neural Networks
541
