
Measuring User Trust in an in-Vehicle Information System:
A Comparison of Two Subjective Questionnaires
Lisa Graichen
1
and Matthias Graichen
2
1
Department of Psychology and Ergonomics, TU Berlin, Marchstraße 23, Berlin, Germany
2
Munich, Germany
Keywords: Trust, IVIS, User Experience, Subjective Measurements.
Abstract: Trust is a very important factor in user experience studies. It determines whether users are willing to use a
particular application and provides information about the users’ mental model of the system and its limitations.
Therefore, trust is widely discussed in the literature, and a variety of instruments have been developed to
measure trust. We selected two recent questionnaires for use in a study of an in-vehicle information system.
Drivers were asked to use an advanced driver assistance system and rate the level of trust they experienced
using both questionnaires. The analysis of the responses to the two questionnaires showed similar results.
Thus, these questionnaires seem to be suitable for studies related to driving scenarios and the evaluation of
assistance systems.
1 INTRODUCTION
In recent years, the number of in-vehicle applications
and systems that are supposed to be used while
driving has increased. Some of these, such as
navigational systems, facilitate activities that are
related to the primary driving task, while others, such
as infotainment or comfort-related systems, target
secondary tasks. With the development of
autonomous driving functions that may soon be
incorporated into vehicles, this trend will continue
and even intensify. Therefore, it is important to
investigate drivers’ opinions and (subjective)
assessments of these systems. Among other aspects,
such as acceptance, user experience, and the
attractiveness of such systems, trust is a critical
psychological concept to be investigated. If a suitable
level of trust is not established, drivers may not use
the provided systems at all or may use them in an
insecure manner. It is crucial to submit important
information about these applications and their
functioning and limitations to users, as well as basic
knowledge on the underlying technical infrastructure,
to enable drivers to build an appropriate mental
model. There are indications that, on the one hand,
drivers tend to demand very high levels of accuracy
from autonomous systems before they will use them
(Shariff et al., 2021). This demand for accuracy can
be partially explained by the better-than-average
effect (Alicke et al., 2005), according to which drivers
tend to believe that their driving skills exceed those
of the average driver, resulting in an inaccurate
assessment of the advantages of autonomous support
systems. On the other hand, people may trust
technical systems uncritically (Kinzer, 2009), a
phenomenon referred to as “overtrust” (Itoh, 2012).
As both inappropriately high and low levels of trust
compromise the secure use of technical systems,
especially in a vehicle, it is important to build
adequate levels of trust in applications and systems
among users. To assess this trust-building process,
measurement methods are necessary.
2 THEORY
According to Castelfranchi and Falcone (2010), it is
important that technology is not only reliable and
secure, but also that people believe they can rely on it
and feel secure using it. Sousa et al. (2014) define
trust as a deterministic risk that can be measured at a
specific moment or a hedonic attitude that can be
surveyed using subjective tools. They propose a
model of trust in human–computer interaction that
consists of qualities (willingness, motivation,
predictability, competency, benevolence, reciprocity,
Graichen, L. and Graichen, M.
Measuring User Trust in an in-Vehicle Information System: A Comparison of Two Subjective Questionnaires.
DOI: 10.5220/0011794500003417
In Proceedings of the 18th International Joint Conference on Computer Vision, Imaging and Computer Graphics Theory and Applications (VISIGRAPP 2023) - Volume 2: HUCAPP, pages
287-291
ISBN: 978-989-758-634-7; ISSN: 2184-4321
Copyright
c
2023 by SCITEPRESS – Science and Technology Publications, Lda. Under CC license (CC BY-NC-ND 4.0)
287
and honesty) that lead to beliefs (rational perception,
expectations, and emotional perception) that in turn
lead to intentions (trust predispositions) and then to
attitudes (engagement, relationship, and
commitment).
Gulati et al. (2017) identified several parameters
that influence trust, namely willingness, motivation,
competence, predictability, benevolence, reciprocity,
and honesty. A scale for measuring of trust was built
upon this model (Gulati et al., 2019). Lankton et al.
(2015) state that there are some theories based on
human trust and others derived from a more technical
approach. Which model provides better predictions
depends on the degree of “humanness” that can be
attributed to the technical system in question. The
more human the system appears, the better human
models seem to perform.
Alongside subjective measurements, it is also
possible to assess the level of trust using
psychophysiological parameters such as EEG
(Ajenaghughrure et al., 2019) and electrodermal
activity (Ajenaghughrure, Da Costa Sousa, & Lamas,
2020). However, according to a comprehensive
review of methods, the suitability of most
psychophysiological measures for assessing trust
levels remains unclear (Ajenaghughrure, Da Sousa, &
Lamas, 2020). For an in-vehicle setting, glance data
is being investigated. Geitner et al. (2017) found that
drivers who reported higher levels of trust tended to
look at the display more frequently but had fewer
glances longer than 2 seconds in duration.
As subjective questionnaires are easy to handle in
an experimental setting, and as it is crucial to
investigate drivers’ subjective experiences to predict
their willingness to use a system, we focus on
subjective measurements in this paper. There are
many questionnaires that attempt to measure trust (for
an overview, see (Alsaid et al.))). This paper aims to
complement the literature discussed above and the
empirical findings on trust analysis by comparing the
results of two questionnaires that were used in an
experimental driving simulator setup. For this
comparison, we used a new scale developed by
Dolinek and Wintersberger (2022) and a trust scale
from Körber (2019).
3 METHODS
3.1 Design and Independent Variables
We opted for a one-way repeated measures design.
We used a static driving simulator as our
experimental setting. An algorithm predicting
whether the driver would turn right or go straight at
an intersection was implemented. The algorithm uses
various parameters, such as acceleration/deceleration
and speed to predict driving maneuvers at
intersections (see Graichen, 2019). When the
algorithm predicted that the driver would turn right,
the system presented a warning regarding the
possibility of a cyclist going straight in the same lane
and therefore crossing the driving trajectory of the
driver.
3.2 Participants
An opportunity sample of 33 persons (17 female and
16 male) was selected using the mailing lists of TU
Chemnitz. The sample consisted mostly of
psychology and human factors students. This research
complies with the tenets of the Declaration of
Helsinki, and informed consent was obtained from
each participant.
3.3 Facilities and Apparatus
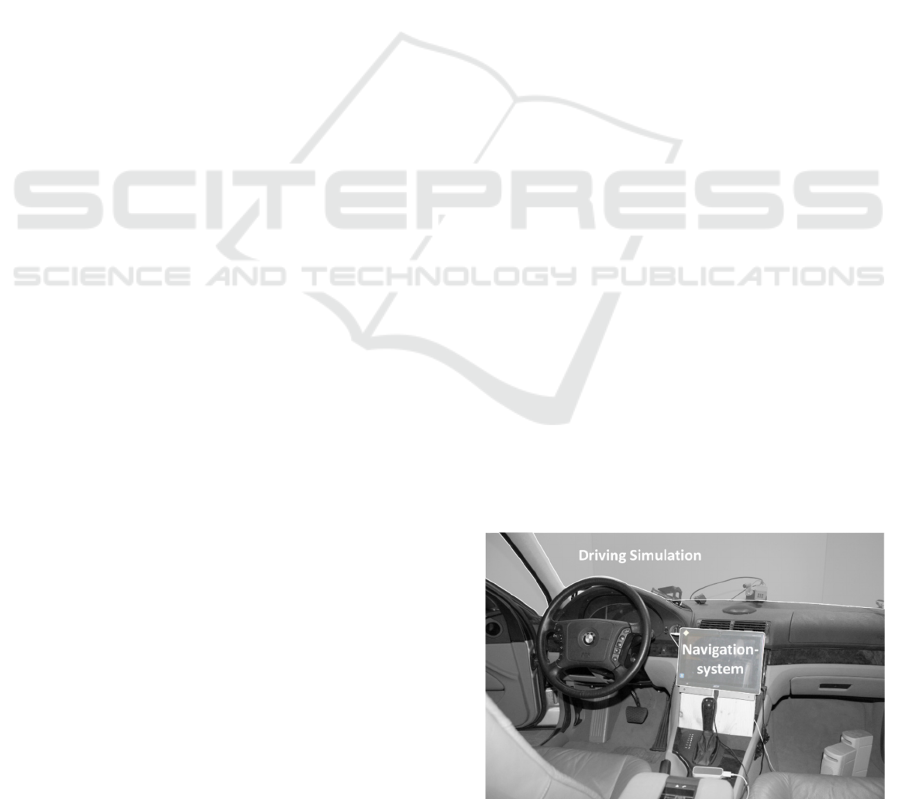
We used a fixed-based driving simulator (STISIM
Drive 100w) for the study. Participants sat in a BMW
350i driving cab with automatic transmission (see
Figure 1). The projection provided a horizontal field
of view of 135 degrees. Two cameras were mounted
in the car, one on the dashboard and the other on the
top of the rear seat, and were positioned to record the
driver’s interactions with the in-vehicle information
system (IVIS).
Instead of the built-in central information display,
a 10-in tablet (Acer Iconia Tab W501P) was mounted
on the center console (see Figure 1). This screen was
used to display the warning regarding the cyclist.
For the driving scenario, we used an inner-city
traffic environment. The route is based on an existing
route in Munich. It consists of 16 right-turning
maneuvers, four left-turning maneuvers, and four
intersections where the driver goes straight.
Figure 1: Driving simulator setup.
HUCAPP 2023 - 7th International Conference on Human Computer Interaction Theory and Applications
288
3.4 Procedure
Upon arrival, participants were introduced to the
simulator, navigation device, and warnings. Each
participant then drove the trips and was subsequently
asked to complete two questionnaires pertaining to
trust. Participants were told to drive according to the
German Road Traffic Act and keep to the standard
speed allowed in urban areas.
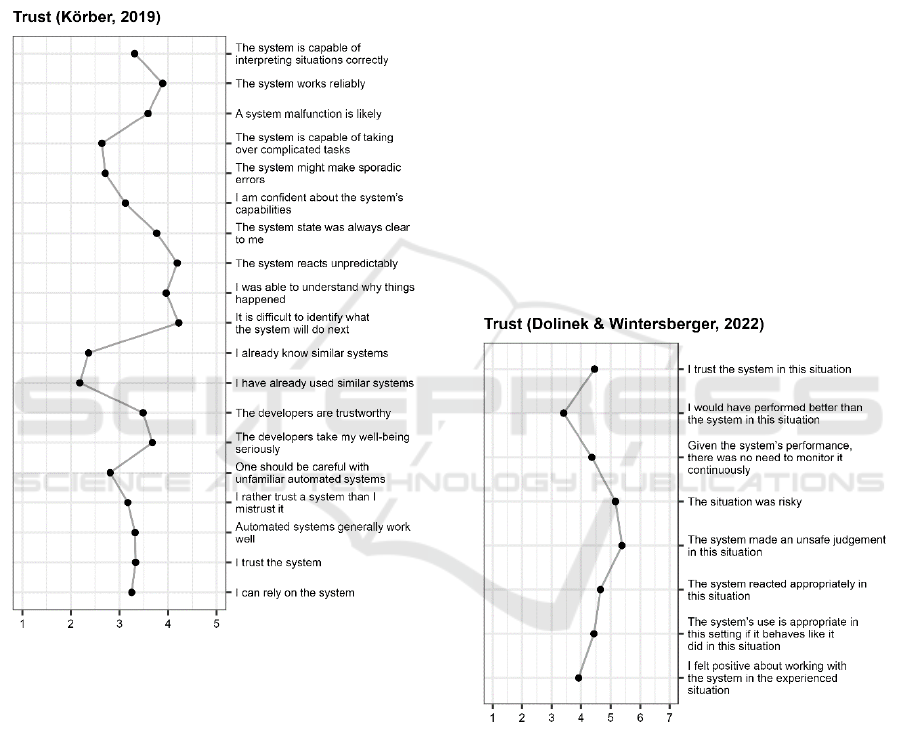
Figure 2: Results for each item for Körber’s scale.
3.5 Dependent Variables
Trust was measured using two different scales. The
first is by Körber (2019) and contains 19 items,
responded to on a 5-point Likert scale, referring to the
scales of familiarity, the developers’ intention,
propensity to trust, reliability/competence, and
understanding. The second is by Dolinek and
Wintersberger (2022) and contains eight items,
responded to on a 7-point Likert scale, referring to the
trust factors of type of system, system complexity,
self-confidence, subject matter expertise, perceived
benefits, workload, task difficulty, attentional
capacity, perceived risk, organizational setting, frame
of task, and mood.
4 RESULTS
For Körber’s questionnaire, the average total score
was 62.91 points out of 95 possible points. For
Dolinek and Wintersberger’s questionnaire, the
average total score was 31.63 points out of 56
possible points. Thus, the ratings obtained using
Körber’s scale were slightly more positive than those
obtained using Dolinek and Wintersberger’s scale.
The results for each item are illustrated in Figures 2
and 3. However, as Körber stated a total score is hard
to be interpreted, we included subscales for perceived
trustworthiness (competence/ reliability,
understandability/ predictability, intention of
developers) and trust in automation into further
analyses. For Dolinek and Wintersberger`s scale a
total score was used. There was a significant
correlation between both scores, r = .69, p < .001.
Figure 3: Results for each item for Dolinek and
Wintersberger’s scale.
For Körber’s scale, item “The developers take my
well-being seriously”, item “I was able to understand
why things happened”, and item “I rather trust a
system than I mistrust it” had the lowest ratings.
These items represent questions that are of a general
nature and are not directly related to the system. Item
“The system reacts unpredictably” and item “A
system malfunction is likely” had the highest ratings.
For Dolinek and Wintersberger’s scale, item “The
Measuring User Trust in an in-Vehicle Information System: A Comparison of Two Subjective Questionnaires
289

situation was risky” and item “The system made an
unsafe prediction in this situation” had the lowest
ratings, and item “I would have performed better than
the system in this situation” and item “The system
reacted appropriately in this situation” were rated
highest.
5 DISCUSSION
Dolinek and Wintersberger’s scale was developed
especially for contexts related to artificial intelligence
(AI), while Körber’s scale incorporate aspects of both
AI and general automation. Since most present-day
applications and systems are on the borderline of
these concepts, it is interesting to evaluate whether
both questionnaires are suitable for trust analysis. In
our study, both scales yielded similar results.
Körber’s scale produced somewhat more positive
results than Dolinek and Wintersberger’s and
contains items that are more general in nature. These
items do not refer only to the amount of trust users
have in this particular system but also to the extent to
which users trust automated systems in general,
which is an interesting aspect of this tool. However,
Dolinek and Wintersberger’s scale is shorter and
more specific to AI applications, which are likely to
represent the majority of the applications of the
present and future.
6 CONCLUSIONS
Both scales appear to be suitable for measuring trust.
Therefore, it seems possible to choose which scale to
use based on the time available for responding to the
questionnaire and the specific items that should be
incorporated in the questionnaire depending on the
application under study.
REFERENCES
Ajenaghughrure, I. B., Da Costa Sousa, S. C., & Lamas, D.
(2020). Risk and Trust in artificial intelligence
technologies: A case study of Autonomous Vehicles. In
2020 13th International Conference on Human System
Interaction (HSI) (pp. 118–123). IEEE. https://doi.org/
10.1109/HSI49210.2020.9142686
Ajenaghughrure, I. B., Da Sousa, S. C., & Lamas, D.
(2020). Measuring Trust with Psychophysiological
Signals: A Systematic Mapping Study of Approaches
Used. Multimodal Technologies and Interaction, 4(3),
63. https://doi.org/10.3390/mti4030063
Ajenaghughrure, I. B., Sousa, S. C., Kosunen, I. J., &
Lamas, D. (2019). Predictive model to assess user trust.
In N. Rangaswamy, R. Loganathan, & A. Tiwari (Eds.),
Proceedings of the 10th Indian Conference on Human-
Computer Interaction (pp. 1–10). ACM.
https://doi.org/10.1145/3364183.3364195
Alicke, M. D., Dunning, D. A., & Krueger, J. (Eds.). (2005).
The Self in Social Judgment. Psychology Press.
Alsaid, A., li, m., Chiou, E. K., & Lee, J. D. Measuring
trust: A text analysis approach to compare, contrast, and
select trust questionnaires. PsyArXiv, 2022.
https://psyarxiv.com/5eyur/
Castelfranchi, C., & Falcone, R. (Eds.). (2010). Trust
Theory. John Wiley & Sons, Ltd. https://doi.org/
10.1002/9780470519851
Dolinek, L., & Wintersberger, P. (2022). Towards a
Generalized Scale to Measure Situational Trust in AI
Systems. In ACM CHI Conference on Human Factors
in Computing Systems. ACM.
Geitner, C., Sawyer, B. D., Birrell, S., Jennings, P.,
Skyrypchuk, L., Mehler, B., & Reimer, B. (2017). A
Link Between Trust in Technology and Glance
Allocation in On-Road Driving. In Proceedings of the
9th International Driving Symposium on Human
Factors in Driver Assessment, Training, and Vehicle
Design: driving assessment 2017 (pp. 263–269).
University of Iowa. https://doi.org/10.17077/driving
assessment.1645
Graichen, M. (2019). Analyse des Fahrverhaltens bei der
Annäherung an Knotenpunkte und personenspezifsiche
Vorhersage von Abbiegemanövern [Doctoral thesis].
Universität der Bundeswehr München, Neubiberg.
http://athene-forschung.rz.unibw-muenchen.de/129783
Gulati, S., Sousa, S., & Lamas, D. (2017). Modelling Trust:
An Empirical Assessment. In R. Bernhaupt, G. Dalvi,
A. Joshi, D. K. Balkrishan, J. O’Neill, & M. Winckler
(Eds.), Lecture Notes in Computer Science. Human-
Computer Interaction – INTERACT 2017 (Vol. 10516,
pp. 40–61). Springer International Publishing.
https://doi.org/10.1007/978-3-319-68059-0_3
Gulati, S., Sousa, S., & Lamas, D. (2019). Design,
development and evaluation of a human-computer trust
scale. Behaviour & Information Technology, 38(10),
1004–1015.
https://doi.org/10.1080/0144929X.2019.1656779
Itoh, M. (2012). Toward overtrust-free advanced driver
assistance systems. Cognition, Technology & Work
,
14(1), 51–60. https://doi.org/10.1007/s10111-011-
0195-2
Kinzer, K. (2009). Tweenbots. http://tweenbots.com/
Körber, M. (2019). Theoretical considerations and
development of a questionnaire to measure trust in
automation. In S. Bagnara, R. Tartaglia, S. Albolino, T.
Alexander, & Y. Fujita (Eds.), Proceedings of the 20th
Congress of the International Ergonomics Association
(IEA 2018): Volume VI: Transport Ergonomics and
Human Factors (TEHF), Aerospace Human Factors
and Ergonomics (pp. 13–30). Springer.
Lankton, N. K., McKnight, D. H., & Tripp, J. (2015).
Technology, humanness and trust: Rethinking trust in
HUCAPP 2023 - 7th International Conference on Human Computer Interaction Theory and Applications
290

technology. Journal of the Association for Information
Systems(Volume 16, Issue 10), 880–918.
Shariff, A., Bonnefon, J.F., & Rahwan, I. (2021). How
safe is safe enough? Psychological mechanisms
underlying extreme safety demands for self-driving
cars. Transportation Research Part C: Emerging
Technologies, 126, 103069. https://doi.org/10.1016/
j.trc.2021.103069
Sousa, S., Lamas, D., & Dias, P. (2014). A Model for
Human-Computer Trust. In D. Hutchison, T. Kanade, J.
Kittler, J. M. Kleinberg, A. Kobsa, F. Mattern, J. C.
Mitchell, M. Naor, O. Nierstrasz, C. Pandu Rangan, B.
Steffen, D. Terzopoulos, D. Tygar, G. Weikum, P.
Zaphiris, & A. Ioannou (Eds.), Lecture Notes in
Computer Science. Learning and Collaboration
Technologies. Designing and Developing Novel
Learning Experiences (Vol. 8523, pp. 128–137).
Springer International Publishing. https://doi.org/
10.1007/978-3-319-07482-5_13
Measuring User Trust in an in-Vehicle Information System: A Comparison of Two Subjective Questionnaires
291
