
Using Neural Network Architectures for Intraday
Trading in the Gold Market
Srinivas Devarajula, Vitaliy Milke
a
and Cristina Luca
b
Computing and Information Science, Anglia Ruskin University, East Road, Cambridge, U.K.
Keywords:
Machine Learning in Finance, Intraday Trading, Neural Network Computing, Artificial Intelligence,
Algorithmic Trading, Forex.
Abstract:
Financial market forecasting is used to assess the future value of financial instruments in various exchange
and over-the-counter markets. Investors have a high interest in the most accurate prediction of the financial
instruments’ prices. Inaccurate forecasting might result in a significant financial loss in certain circumstances.
This research aims to determine the most probabilistic deep learning model that can improve price forecasting
in the financial markets. In this research, Convolutional Neural Networks and Long Short-Term Memory are
used for the experiments to forecast the Gold price movements on the Forex market. The Gold(XAU/USD)
dataset is used in this research to predict the prices for the next minute. The models proposed have been
evaluated using Mean squared error, Mean absolute error, and Mean absolute percentage error metrics. The
results show that the Convolutional Neural Network has performed better than the Long Short-Term Memory
network and has the potential to predict the price for next minute with a low error rate.
1 INTRODUCTION
In financial markets, there are several ways to in-
vest based on the length of time one investor (natu-
ral or legal person) holds financial instruments such
as stocks, bonds, futures, options, commodities or
Forex. In long-term investment, the investors hold the
financial assets for months or years, whilst intraday
trading refers to the investment done in financial in-
struments for minutes or hours per day. While both
strategies have benefits and drawbacks, intraday trad-
ing is regarded as riskier due to the volatility of mar-
ket changes (Bhat and Kamath, 2013), (Demirer et al.,
2021).
Futures and Forex markets prediction is one of the
most challenging problems due to the data volatility
and high level of noise in the data. Adding unbal-
anced data makes predicting the accurate price move-
ment for the next few minutes even harder. As the
market behaviour is constantly changing, the patterns
identified could be altered too. There are studies
on time series prediction using the minute-to-minute
dataset for currencies ((Evans, 2018), (Raimundo and
Okamoto Jr, 2018), (Weeraddana et al., 2018), (Chen
a
https://orcid.org/0000-0001-7283-2867
b
https://orcid.org/0000-0002-4706-324X
et al., 2019), (Rundo et al., 2019), (Islam and Hos-
sain, 2020), (Liao et al., 2021)), Standard Poor’s
500 (S&P 500) index-based financial instruments,
such as SPY Exchange-Traded Fund (ETF) and E-
Mini futures ((Ferreira and Medeiros, 2021), (Kinyua
et al., 2021)), and studies of commodities and pre-
cious metal markets using classical statistical meth-
ods ((Huang et al., 2021), (Semeyutin et al., 2021),
(Zeng and Lu, 2022) or simple machine learning
methods (Gil, 2022)). So far, no research has been
found to analyse a one-minute time-term dataset on
Gold using Neural Networks. According to (Weng
et al., 2020) the annual growth rates of gold is 7.69%
which is more than 6.79% of S&P 500 from 2014 to
2019, and their paper stated that gold data could be
utilised for training models.
In the last decade, Neural Network (NN) technolo-
gies gained popularity in financial markets’ price pre-
diction. They have been extensively employed in the
financial sector in areas such as portfolio optimisa-
tion, High-Frequency Trading (HFT), risk manage-
ment and equity portfolio management. One of the
primary aims of researchers is to use Machine Learn-
ing (ML) models, which can produce results close to
the price in the financial market within a relatively
short certain period of the chosen time frame or de-
termine the moment before the most probable signifi-
Devarajula, S., Milke, V. and Luca, C.
Using Neural Network Architectures for Intraday Trading in the Gold Market.
DOI: 10.5220/0011794400003393
In Proceedings of the 15th International Conference on Agents and Artificial Intelligence (ICAART 2023) - Volume 3, pages 885-892
ISBN: 978-989-758-623-1; ISSN: 2184-433X
Copyright
c
2023 by SCITEPRESS – Science and Technology Publications, Lda. Under CC license (CC BY-NC-ND 4.0)
885

cant price movement. The current trend in using ML
models is to create auto-trading bots to produce pre-
dictions close to the abstract capabilities of the human
brain but with more accurate computational predic-
tions.
Most of the research papers reviewed use Recur-
rent Neural Networks (RNNs) (Vargas et al., 2017),
(dos Santos Pinheiro and Dras, 2017), which are
specifically designed for next-hour to next-day price
prediction based on sequence data.
The aim of this research is to predict the price
movement of the next minute using neural networks
on the one-minute Gold prices (XAU/USD) Forex
dataset. The experiments were done using Convo-
lutional Neural Networks (CNNs) and Long Short-
Term Memory (LSTM). The results obtained have
been compared against the state-of-the-art algorithms
that predict gold prices on more extended time frame
data. This research demonstrates how neural network
models can handle massive datasets and extract infor-
mation from transaction signals to determine the opti-
mal market entry points based on predicted significant
movements in the next minute in order to minimise
overall transaction costs, which is vital for intraday
trading. A comparison of algorithm performance on
error metrics with regard to the reduction in these er-
ror rates attained during prediction is also performed.
The models are fine-tuned and evaluated with better
training parameters for improving to reach a price pre-
diction close to the actual values.
The remaining sections of this study are structured
as follows: section 2 investigates the literature review
and state-of-the-art studies on the topic of intraday
financial trading; the proposed method is presented
in section 3; section 4 outlines the results and com-
parison of models; section 5 discusses the validation
based on the numerical analysis; finally the conclu-
sions are drawn in section 6.
2 LITERATURE REVIEW
During the unstable, volatility time, investors are
more interested in the gold market. Consequently,
the liquidity of different financial instruments based
on gold spot prices is increasing. For intraday trad-
ing, liquidity is crucially important, and it is possible
to apply intraday trading methods used for currency
and stock markets on the gold markets. As a result,
the same methods used for predicting prices in the fi-
nancial instruments in liquid markets, such as Forex
exchange rates, liquid ’Blue chip’ stocks (Big-tech,
mining companies or global banks), and integral stock
indices (Dow Jones, S&P 500, NASDAQ-100, FTSE
100) are employed for the gold markets.
Researchers have used a range of methodologies
to examine the volatility of the gold price and its rela-
tionship to the variables assumed to impact it. (Man-
jula and Karthikeyan, 2019), (Chandrabai and Suresh,
2020), (Makala and Li, 2021), (Chen, 2022) used
popular regression algorithms, such as support vector
machine, ARIMA, linear and Lasso regressions, ran-
dom forest, and gradient boosting, for gold datasets
based on hourly and daily prediction. (Milke et al.,
2020) used CNNs to predict the most probable signif-
icant price movements by analysing Forex tick data
and measuring the performance metrics of the model.
(Manjula and Karthikeyan, 2019) validated differ-
ent periods of data on a monthly basis to predict prices
using three regression models: Linear Regression
(LR), Random Forest (RF) and Gradient Boosting
Regression (GBR) algorithms. To assess the quality
of the prediction models implemented, they used the
Mean squared error (MSE), Root mean squared error
(RMSE) and Mean absolute error (MAE). Another
research by (Chandrabai and Suresh, 2020) studied
gold price prediction using Linear Regression, Ran-
dom forest and Support Vector Machine (SVM) with
R-Square and RMSE scores for evaluating the results.
The same dataset on gold was used by (Makala and
Li, 2021) in their research that studied ARIMA and
SVM models on daily data from World Gold Coun-
cil between 1979 and 2019 and measured the per-
formance of the proposed models using RMSE and
MAPE. The research results indicate that the SVM
outperforms ARIMA in terms of MAPE and RMSE,
with RMSE of 0.028, MAPE of 2.5 for SVM ver-
sus 36.18 and 2.897 for ARIMA. Due to SVM’s high
accuracy, the findings imply that it should be em-
ployed for commodity price prediction. With the
help of price components that possibly affect gold
prices, (Chen, 2022) created an ensemble technique
that combines SVM and LSTM models with quotient
space theory.
The key purpose of the intraday trading is to gain
instant profits from volatile prices of stocks, futures
contracts and other financial instruments. Intraday
trading can be defined simply as buying and selling
of the same security during one day within one trad-
ing session (U.S. Securities and Exchange Commis-
sion, 2022). All positions should be sold before the
end of the trading session, and no securities (including
short positions) should be held overnight in order to
avoid significant risks of getting losses from overnight
gaps triggered by economic or political events (Shen,
2021).
Prediction of the next day’s price with some prob-
ability has become possible by searching for patterns
ICAART 2023 - 15th International Conference on Agents and Artificial Intelligence
886

of behaviour of market participants in historical data
using complex neural networks and machine learning
algorithms such as RNNs, CNNs and Gradient Boost-
ing algorithms in regression models in conjunction
with some Natural Language Processing (NLP) tech-
nologies. Some models use hybrid joint analysis ap-
proaches on input market data (prices and some tech-
nical indicators) together with news. The papers pre-
sented based on daily (dos Santos Pinheiro and Dras,
2017), (Vargas et al., 2017) and hourly price predic-
tion (Madan et al., 2015) show that better accuracy
is achieved on intraday data in conjunction with the
news of the respective day, as previous days’ news
had minimal impact and became noise. In their pa-
per, (Vargas et al., 2017) employ Deep Learning (DL)
algorithms to predict S&P 500 index intraday prices,
using a headline technical indicators set and financial
news as input. When using DL algorithms, it is possi-
ble to recognize and analyze complex non-trivial pat-
terns and interactions of data, which are used to in-
crease capital returns and automatically accelerate the
trading process. (Vargas et al., 2017) focused on de-
signs like CNN and RNN, and achieved significant
results in typical natural language processing proce-
dures for financial information. The results show that
CNN performed better than the RNN for capturing se-
mantics from text, and RNN is recommended to pre-
dict the stock market by modelling contextual infor-
mation and complex temporal characteristics.
Using NLP techniques, (dos Santos Pinheiro and
Dras, 2017) explored character-level language model
pre-training with RNN for both interday and intraday
forecasts of the S&P 500 index. This method outper-
forms other recent approaches in predicting the direc-
tion of the S&P 500 index for both individual shares
and the index as a whole, demonstrating the high im-
pact of current news on stock price movements in re-
cent years.
Based on the hourly time-term dataset, the pre-
diction method proposed by (Madan et al., 2015)
uses minutes and seconds data of bitcoin to predict
prices for the next 10-minute prices. Properties to
predict the signs of future changes are modelled as
bionomic classifications that are experimented with
random forests and linear models. Their results were
50 to 55% accurate in predicting signals of future
price movements using a time frame of 10 minutes.
Because there are many microscopic fluctuations and
perturbations in the bitcoin price, as well as inside the
prices of other financial instruments, 10-second inter-
vals of data are used for a deeper understanding.
In their paper, (Zhang et al., 2021) applied hybrid
LSTM models to predict the EUR/USD price move-
ment. The classifier determines the direction of price
movement as no action, increase or decrease in price.
The model predictions included periods of one day,
three days, and five days ahead. Results show that hy-
brid models outperform individual models for daily
data.
In recent years, LSTM has been the most popular
method employed for price prediction using time se-
ries data. (Lim et al., 2019) used enhanced deep neu-
ral network LSTM to estimate the price value above
or below in the next time step. (Siami-Namini and
Namin, 2018) also used LSTM to forecast time series
data for 12 stocks. The empirical findings in this pa-
per show that DL-based algorithms, such as LSTM,
outperform classic algorithms, such as ARIMA mod-
els. Similar results were published by (McNally,
2016).
Most research papers reviewed used daily close
prices data as inputs for Neural Networks, Regression
methods or a combination of networks. The authors
identified a lack of research on intraday data, such as
1-minute and 5-minute time frames. Given the higher
predictive performance of neural networks compared
to classical machine learning methods and statistical
time series analysis, this research focuses on mod-
elling with neural networks, such as one-dimensional
CNN and LSTM, which are also very popular for
time-series data. The main contribution of this re-
search consists of comparing and analysing predic-
tions of two neural network models based on the one-
minute gold Forex dataset for intraday trading to close
the existing research gap.
3 PROPOSED METHOD
The expediency of short predictions of financial in-
strument’s price for the next second or minute can be
explained by a simple logical statement that follows
from the concept of causal determinism in economics
(Chen et al., 2018) and is vividly described by the
conception of Laplace’s demon (Johnson, 2017): if
it is possible to predict the next second or minute, it is
possible to predict the future any time ahead.
The prediction of the gold price for the next
minute can show a potential acceleration of price
change during the longer period inside the trading
session. In other words, it shows the starting point
of a possible momentum of future significant price
change. Thus, from a practical point of view, a trading
system based on this minute-by-minute neural net-
work prediction only pays attention to the prediction
of relatively big price changes in the next minute and
does not react to a casual flat.
For this research the one-dimension CNNs has
Using Neural Network Architectures for Intraday Trading in the Gold Market
887
been chosen because they are effective at time-series
analysis (Chollet, 2016) and for pattern recognition
in images. According to the literature review, LSTMs
are widely used for time-series analysis as a bench-
mark. Therefore, it has been chosen as a second ar-
chitecture for this paper.
3.1 Dataset
For the models to produce good results, it is crucial to
choose a dataset that is error-free and detailed enough
to reflect real short-term liquidity. Liquidity, in its
most basic definition, is the quantity of cash and read-
ily convertible assets a company has in order to meet
its short-term debt obligations. In terms of trading,
liquidity means the ability to sell a position in stocks,
futures contracts, or other financial instruments with-
out significantly affecting the current prices of these
assets. According to the World Gold Council (WGC)
(Das et al., 2022), gold is the second most liquid as-
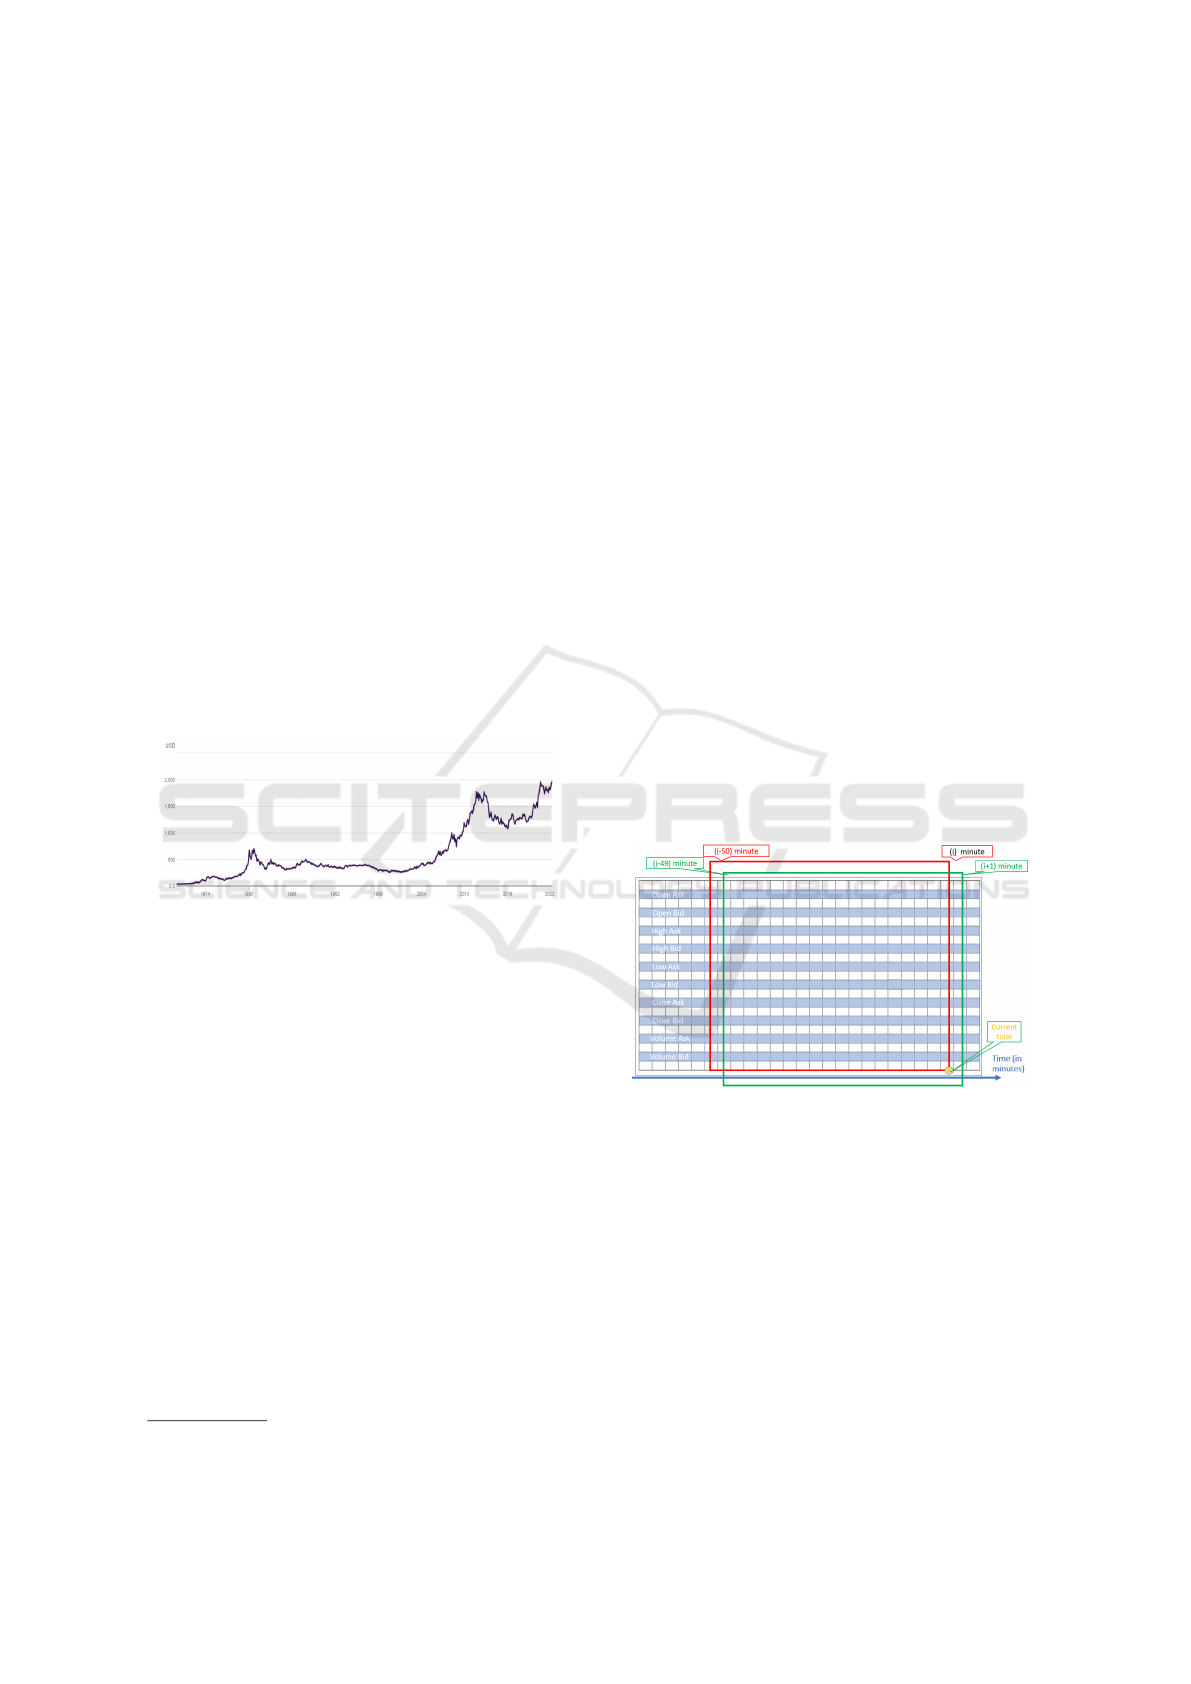
set. Figure 1 demonstrates the changes of the gold
prices from 1974 to 2022 (Dukascopy Swiss Banking
Group, 2022).
Figure 1: Gold prices from 1974 to 2022 (Dukascopy Swiss
Banking Group, 2022).
Gold is one of the most liquid financial assets be-
cause it is traded with large volumes on the spot, fu-
tures, and Forex markets(Hundal et al., 2013). There-
fore, evaluating and comparing various models using
gold datasets is a promising resource for future re-
search conducted on minute-to-minute datasets.
This research uses the gold market financial in-
strument (XAU/USD) in the Forex market. This
one-minute interval dataset is publicly available on
the Dukascopy Bank official website
1
. Data from
2020 has been chosen because it has been extremely
volatile due to the start of COVID-19 pandemic. The
features include the trading volume and the Ask and
Bid Values prices with date and time. There are
355,590 rows and 11 columns — Open, High, Low,
Close, Volume values for both Ask and Bid, and local
time for each minute.
The volumes of each transaction in the Forex mar-
ket, including gold instruments, contain only some
1
https://www.dukascopy.com/swiss/english/home/
volumes bought and sold at current prices in the world
since the Forex market is not centralised. However,
the volumes of transactions indicated in this data
repository sufficiently reflect the activity of market
participants and increase when the market is acti-
vated. Thus, transaction volumes are an additional
linearly independent parameter that has to be analysed
(Milke et al., 2017).
3.2 Experiments
3.2.1 Convolutional Neural Networks
The essential step in the data preprocessing for time-
series data is setting the rolling window size before
training the neural network models. The 50-minute
wide rolling window was used to generate mock im-
ages as inputs to the CNN. This window contains
minute prices and volumes vs time, advancing in min-
utes left-to-right (increasing time) increments. Each
minute generates a new chart for the previous 50 min-
utes, which then adds up to a 3D input tensor. Further,
to reduce the size occupied in RAM and improve the
metrics of correlation recognition, this 3D tensor was
transformed from pictures into a 3D tensor of time se-
ries slices. The process described above is shown in
Figure 2.
Figure 2: The 50-minute rolling window for generating 3D
tensor of inputs.
The 50-minute wide rolling window was chosen
as the maximum possible based on the performance
of the available GPU processors. For example, a 200-
minute wide rolling window increases the number of
input data by four times, and the number of calcula-
tions for training the neural network is proportional to
16 times.
As a consequence of this conversion, 2D arrays
of prices and volumes are converted into a 3D tensor.
The MinMaxScaler technique is used to normalize the
data that is then fed into a CNN for training and pat-
tern recognition. The sliced 2D windows in the 3D
ICAART 2023 - 15th International Conference on Agents and Artificial Intelligence
888

tensor may be associated with the previously known
financial practice of analysing Japanese candlestick
patterns, but on a newer technological platform (Ni-
son, 2011).
After preprocessing, the data is divided into
training (including 20 % for validation) and testing
datasets in a ratio of about 1:10; approximately 230
days for training and 30 days for testing.
The 2-convolutional layers CNNs, with 50 and
100 neurons each, are trained. Then max-pooling
layer is added to shrink the dimension with the aim
of reducing the redundant characteristics. After the
2-layer CNN network, a dense layer with 25 neurons,
with ReLU activation, was added to allow for addi-
tional customisation. Then the sequence proceeded to
the fully connected layer with the softmax activation
function to forecast expected outcomes; a dense layer
of four neurons was chosen as the last layer for cat-
egorising samples into Open, High, Low, and Close
values. Overall, 40,500 total weight parameters were
optimised during training.
The above conventional neural network architec-
ture was chosen to receive preliminary training out-
comes to assess the approach’s perspective. In further
research, the authors intend to use AutoML tools to
determine the optimal wide of the rolling window and
the best hyperparameters of the neural network used.
3.2.2 Long Short-Term Memory
The data preprocessing for the LSTM consists in re-
shaping the data to a one-dimensional array from the
CNN model’s close price data. This analysis can be
considered a regression task. Similarly, the train vali-
dation and test split of data are kept the same.
The first experiment used a single-layered LSTM
network where the 64-neuron layer is followed by a
25-neuron dense layer and a 4-neuron output dense
layer.
In the second experiment, a two-layered LSTM
network was built. It has 64 neurons on the first
LSTM-layer, followed by 128 neurons in the second
LSTM-layer, and the rest is the baseline of the dense
layers described above. Though the computational
time for two-layered networks is slightly higher than
for one-layered networks, the loss is 100 times less.
Finally, a third LSTM-layer with 256 neurons was
added to the two-layered LSTM network, which has
performed better both in specific computational speed
as well as with test loss. During training, a total of
516,400 total weight parameters were tuned.
4 RESULTS AND COMPARISON
Experiments with CNNs are carried out with dif-
ferent convolutional layers, optimisation algorithms,
loss functions, and metrics. 2-layer ReLu CNN net-
works were compared with 4- and 6-layer networks.
Keras Model Checkpoint callback function was
utilised to remember training results for every epoch,
with the epoch with the best error metrics being cho-
sen as the subsequent choice. Tests were conducted
with data batch sizes ranging from 10 to 100 and
epoch counts ranging from 5 to 100 for this research.
During the analysed period, 20 data batches and 10 to
50 epochs which were determined by the above call-
back function, produced the best results.
The CNN with the parameters showed in table 1
demonstrates a good performance.
Table 1: Hyper parameters settings of Final Model.
Parameter Parameter
Settings
Loss Function MSE
Optimizer Adam
Batch Size 20
Number of neurons in each layer 50
Epochs 50
Table 2 presents the results of both CNN and
LSTM for the error metrics MSE, MAE and MAPE,
used to evaluate model efficiency on each epoch. The
decrease in the error values shows that the model per-
forms well on the training and validation dataset.
Table 2: Table comparing error metrics of models for the
year 2020.
Model MSE MAE MAPE
CNN 0.000001017 0.001208 11.55
LSTM 0.000013088 0.002531 60.33
The predicted prices produced by the CNN on the
test data from 2020 are shown in Figure 3, alongside
the actual values of Open, High, Low and Close.
The visualisation for the LSTM training process
is shown in Figure 4 with Training and validation
losses. Figure 5 demonstrates the LSTM model re-
sults of Train, Test, Valid and Prediction prices.
Following the outcome of the models developed,
the CNN was chosen for further experiments as its
performance is greater than the one of LSTM for
the dataset used. After changing and comparing the
NN architectures and hyper-parameters, the CNN was
trained with parameters that are performing better to
produce fewer error rates.
Using Neural Network Architectures for Intraday Trading in the Gold Market
889
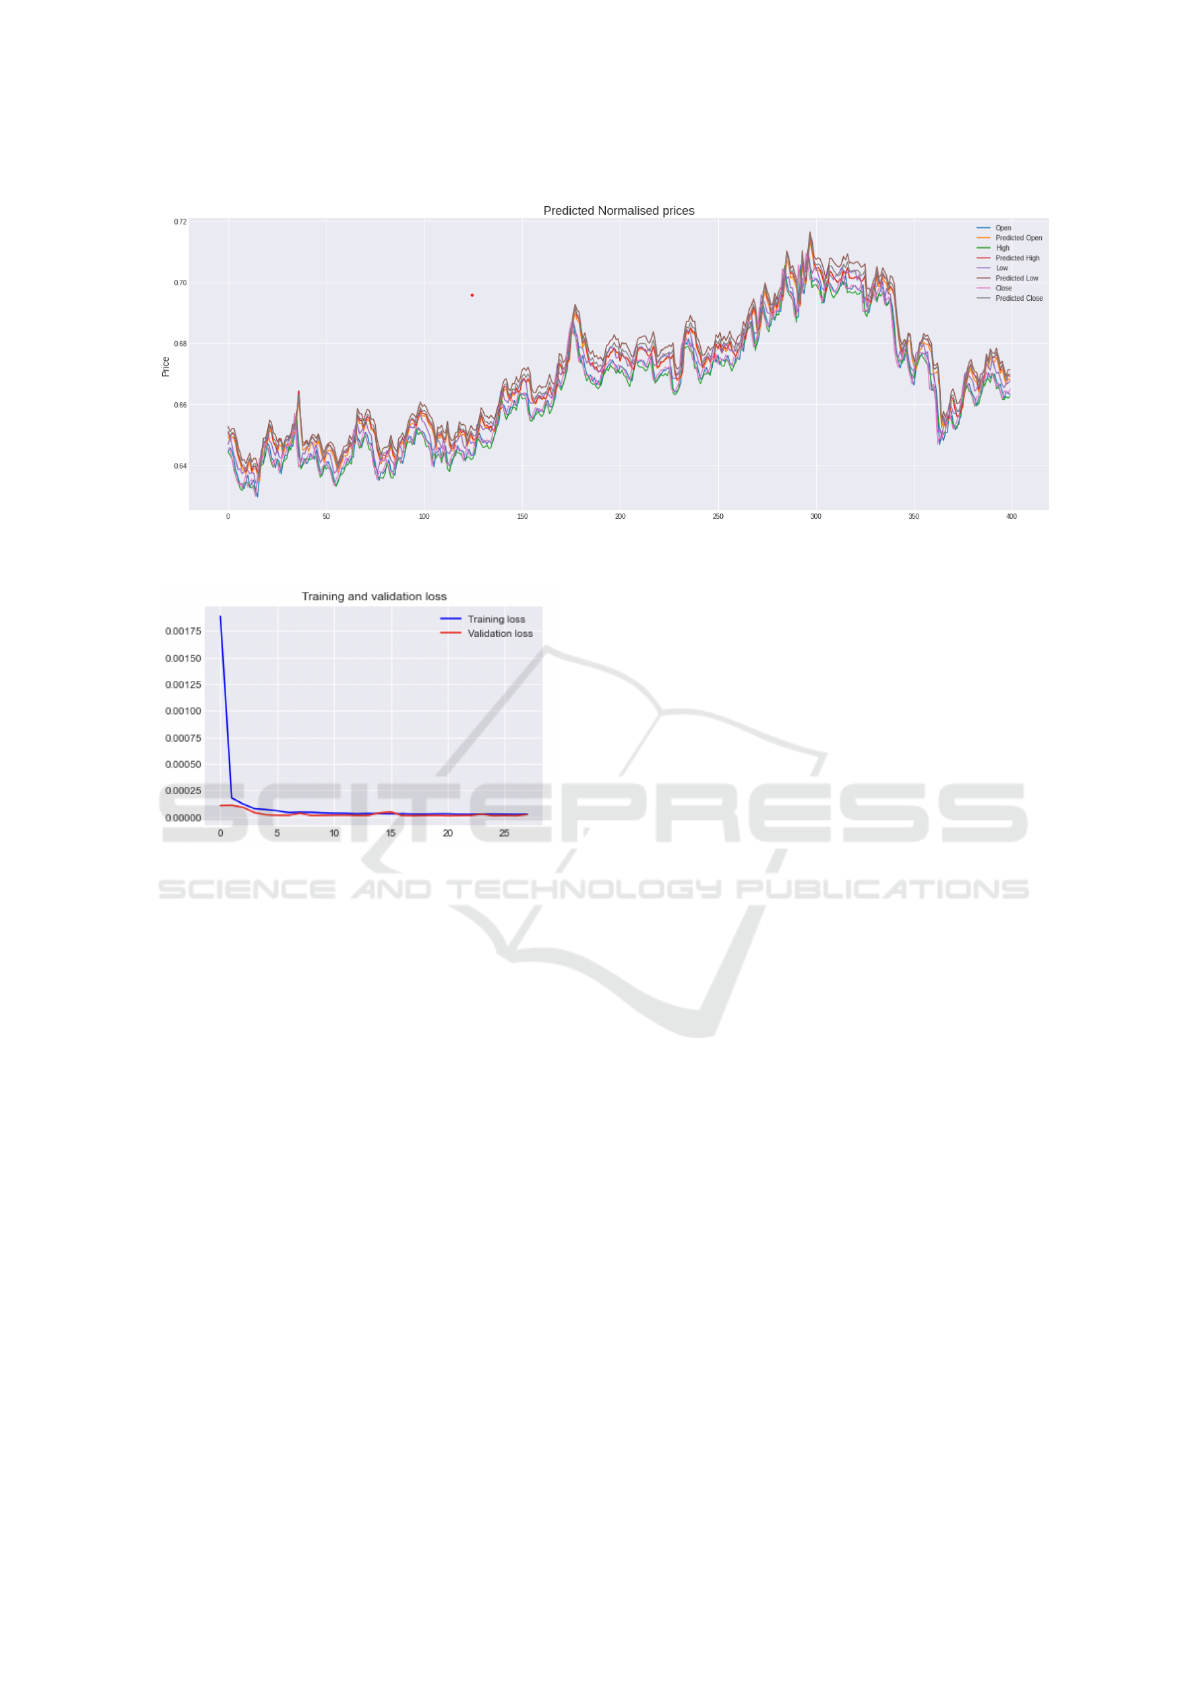
Figure 3: CNN model results for year 2020.
Figure 4: Training and Validation Loss for LSTM for year
2020.
5 DISCUSSION AND CRITICAL
ANALYSIS
The ability to recognise financial market patterns has
clear benefits for investors.
For this paper we employed the CNN and three-
layered LSTM models to forecast the future move-
ment of intraday financial market transactions utiliz-
ing non-standard approaches for preprocessing raw
data. The normalisation of nonlinear data as well as
the conversion of 2D data into a 3D tensor via the pro-
duction of consecutive data are both essential compo-
nents of the approach’s design. As a consequence, the
size of the incoming data grows substantially and im-
pacts the available resources. In this research, the data
was normalised using the min-max approach that is
one of the most often used data normalisation strate-
gies.
In transactions involving very high volume lots,
significant price fluctuations and probable delays in
the execution of market orders often occur, decreas-
ing the prediction’s quality. Therefore, deep learning
techniques, such as CNN and LSTM were chosen as
they are more accurate than basic neural networks.
Preliminary findings indicated a reasonably high
accuracy and error rate, which should yet be thor-
oughly confirmed in calculations, taking into consid-
eration the constraints imposed by the time-series data
set utilized in the calculations. The data was separated
into training and validation datasets in a 9:1 ratio, with
90% of the dataset utilized for training and 10% for
results validation. The results found that baseline 2-
layered CNN with the parameters shown in table 1
had the best performance in terms of MSE, MAE,
MAPE. The decrease in the error values shows that
the model has performed well on the training and val-
idation dataset.
After changing and comparing the hyper-
parameters, the model was trained againand it
produced fewer error rates.
6 CONCLUSION
In this research, two neural network architectures
were applied to gold Forex market data based on gold
spot market prices, using various deep learning ap-
proaches and non-linear data preprocessing. These
approaches were utilised to predict the intensity and
volatility of price movements in a short-term period.
This research presents a CNN model for pre-
dicting future intraday financial market price accel-
erations utilising non-standard data processing ap-
proaches. Based on the test results, it can be con-
cluded that the primary contribution of this research
is a statistical confirmation of the high probability
of the ability of traders (natural or legal persons)
to make profits through intraday forecasting of gold
ICAART 2023 - 15th International Conference on Agents and Artificial Intelligence
890
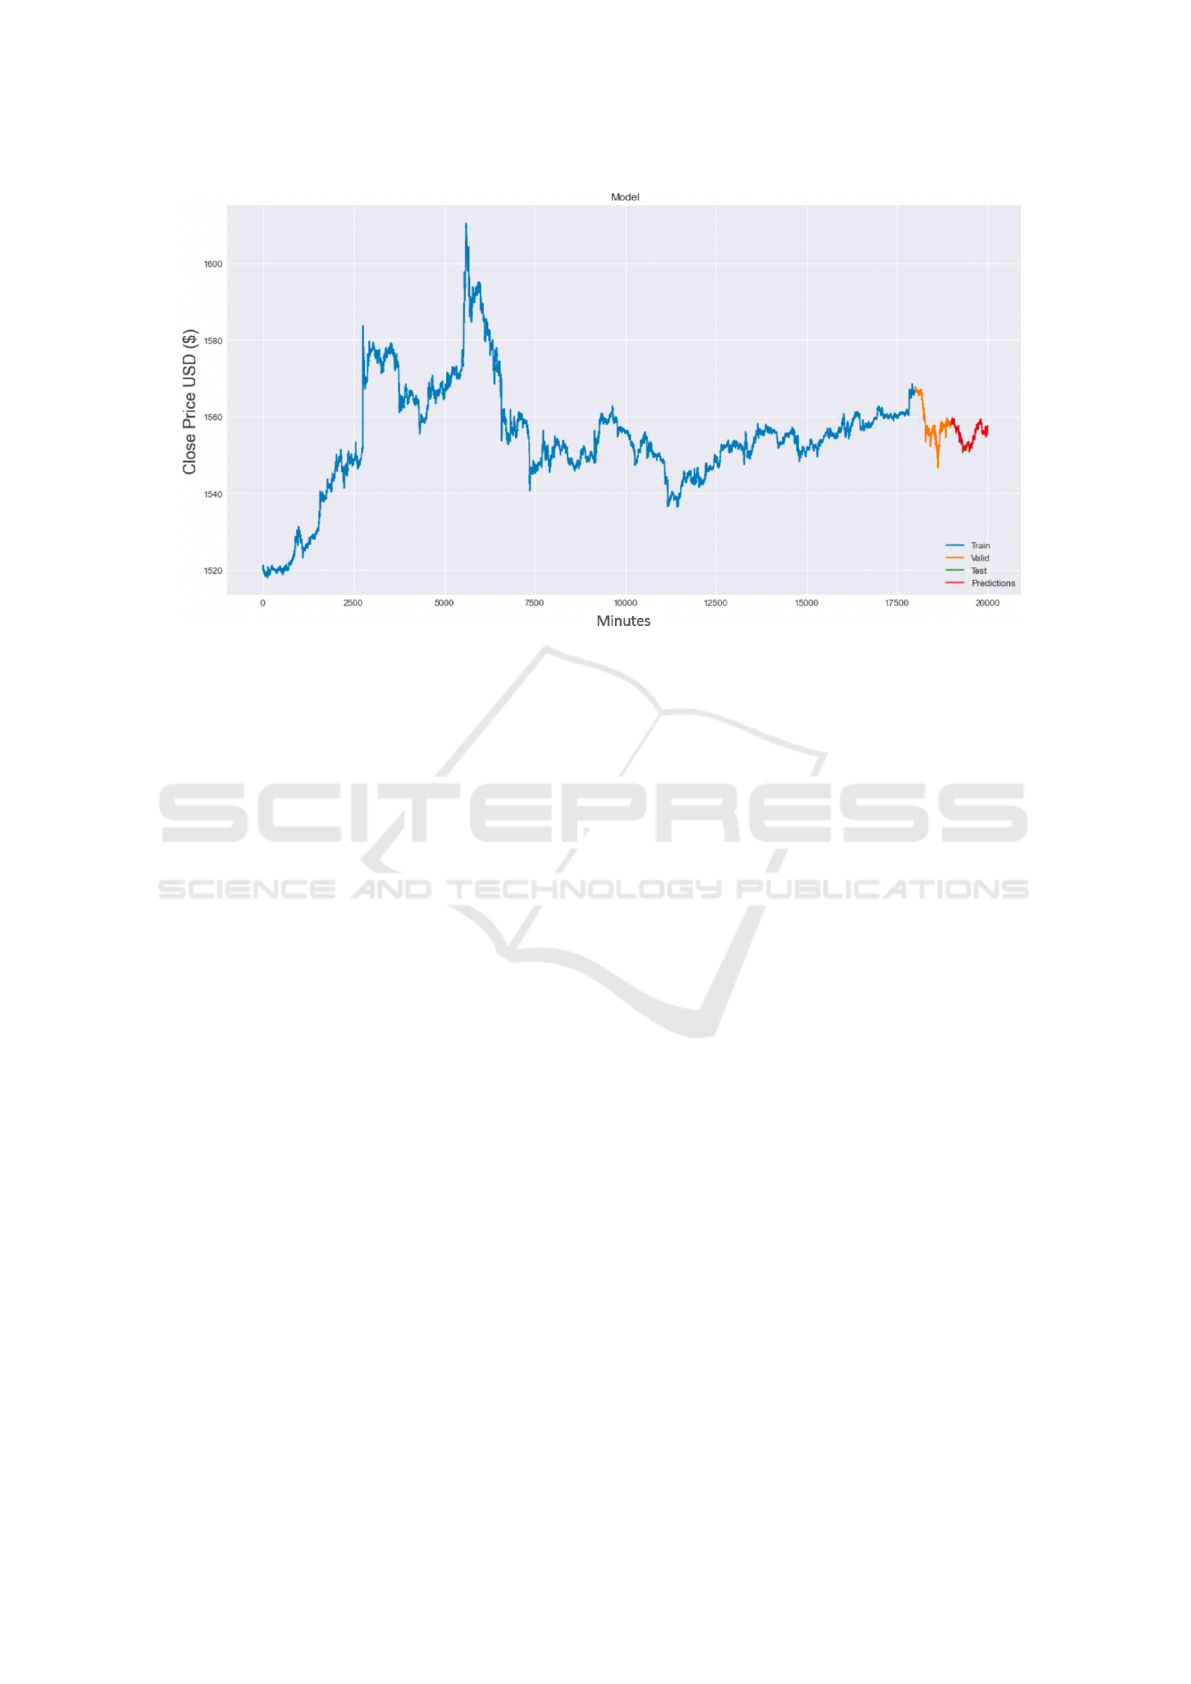
Figure 5: Prediction Result for LSTM for year 2020.
price movements.
On the basis of various hyper parameter values,
we compared the performance of the CNN and LSTM
neural networks in forecasting the prices of the gold
market index in intraday time periods . To evaluate
the resilience and performance of these models, we
compared the error metrics of the two neural networks
and concluded that CNN performs better based on low
error rates.
Future research should focus on including Au-
toML to optimise Hyper-parameters with hyper-
parameter optimization (HPO), Reinforcement Learn-
ing by normalising raw data. HPO eliminates the need
for a human expert to perform the time-consuming
task of hyper-parameter tuning. It is possible to create
self-learning agent using reinforcement learning (RL)
with the recognises not only market entry points with
the highest probability of profit but also market exit
points. Such a system will be evaluated in terms of
maximising the Sharpe ratio with RL algorithms like
Proximal Policy Optimization (PPO), Q-learning and,
Deep Q Neural Network.
REFERENCES
Bhat, A. A. and Kamath, S. S. (2013). Automated stock
price prediction and trading framework for nifty in-
traday trading. In 2013 Fourth International Confer-
ence on Computing, Communications and Networking
Technologies (ICCCNT), pages 1–6. IEEE.
Chandrabai, D. and Suresh, D. (2020). Assessment of ma-
chine learning techniques for gold price predictions.
Chen, D., Harimoto, K., Bao, R., Su, Q., Sun, X., et al.
(2019). Group, extract and aggregate: Summarizing
a large amount of finance news for forex movement
prediction. arXiv preprint arXiv:1910.05032.
Chen, S.-H., Kaboudan, M., and Du, Y.-R. (2018). The
Oxford handbook of computational economics and fi-
nance. Oxford University Press.
Chen, W. (2022). Estimation of international gold price by
fusing deep/shallow machine learning. Journal of Ad-
vanced Transportation, 2022.
Chollet, F. (2016). Building autoencoders in keras. The
Keras Blog, 14.
Das, S., Nayak, J., Kamesh Rao, B., Vakula, K., and Ran-
jan Routray, A. (2022). Gold price forecasting us-
ing machine learning techniques: Review of a decade.
Computational Intelligence in Pattern Recognition,
pages 679–695.
Demirer, R., Gupta, R., Pierdzioch, C., and Hus-
sain Shahzad, S. J. (2021). A note on oil price shocks
and the forecastability of gold realized volatility. Ap-
plied Economics Letters, 28(21):1889–1897.
dos Santos Pinheiro, L. and Dras, M. (2017). Stock mar-
ket prediction with deep learning: A character-based
neural language model for event-based trading. In
Proceedings of the Australasian Language Technol-
ogy Association Workshop 2017, pages 6–15.
Dukascopy Swiss Banking Group (2022). Historical
data feed. https://www.dukascopy.com/swiss/english/
marketwatch/historical/. Accessed: 2022-11-15.
Evans, M. D. (2018). Forex trading and the wmr fix. Jour-
nal of Banking & Finance, 87:233–247.
Ferreira, I. H. and Medeiros, M. C. (2021). Modeling and
forecasting intraday market returns: a machine learn-
ing approach. arXiv preprint arXiv:2112.15108.
Gil, C. (2022). Intraday trading of precious metals futures
Using Neural Network Architectures for Intraday Trading in the Gold Market
891

using algorithmic systems. Chaos, Solitons & Frac-
tals, 154:111676.
Huang, J., Li, Y., Suleman, M. T., and Zhang, H. (2021).
Effects of geopolitical risks on gold market return dy-
namics: Evidence from a nonparametric causality-in-
quantiles approach. Defence and Peace Economics,
pages 1–15.
Hundal, B., Grover, S., and Bhatia, J. K. (2013). Herd be-
haviour and gold investment: A perpetual study of re-
tail investors. IOSR Journal of Business and Manage-
ment, 15(4):63–69.
Islam, M. S. and Hossain, E. (2020). Foreign exchange cur-
rency rate prediction using a gru-lstm hybrid network.
Soft Computing Letters, page 100009.
Johnson, T. (2017). The ascendancy of financial economics.
In Ethics in Quantitative Finance, pages 195–220.
Springer.
Kinyua, J. D., Mutigwe, C., Cushing, D. J., and Poggi, M.
(2021). An analysis of the impact of president trump’s
tweets on the djia and s&p 500 using machine learn-
ing and sentiment analysis. Journal of behavioral and
experimental finance, 29:100447.
Liao, S., Chen, J., and Ni, H. (2021). Forex trading volatil-
ity prediction using neuralnetwork models. arXiv
preprint arXiv:2112.01166.
Lim, B., Zohren, S., and Roberts, S. (2019). Population-
based global optimisation methods for learning long-
term dependencies with rnns. arXiv preprint
arXiv:1905.09691.
Madan, I., Saluja, S., and Zhao, A. (2015). Automated
bitcoin trading via machine learning algorithms.
URL: http://cs229. stanford. edu/proj2014/Isaac%
20Madan, 20.
Makala, D. and Li, Z. (2021). Prediction of gold price with
arima and svm. In Journal of Physics: Conference
Series, volume 1767, page 012022. IOP Publishing.
Manjula, K. and Karthikeyan, P. (2019). Gold price pre-
diction using ensemble based machine learning tech-
niques. In 2019 3rd International Conference on
Trends in Electronics and Informatics (ICOEI), pages
1360–1364. IEEE.
McNally, S. (2016). Predicting the price of Bitcoin using
Machine Learning. PhD thesis, Dublin, National Col-
lege of Ireland.
Milke, V., Luca, C., and Wilson, G. (2017). Minimisation
of parameters for optimisation of algorithmic trad-
ing systems. In 2017 International Conference on
Optimization of Electrical and Electronic Equipment
(OPTIM) & 2017 Intl Aegean Conference on Electri-
cal Machines and Power Electronics (ACEMP), pages
1114–1119. IEEE.
Milke, V., Luca, C., Wilson, G., and Fatima, A. (2020).
Using convolutional neural networks and raw data to
model intraday trading market behaviour. In ICAART
(2), pages 224–231.
Nison, S. (2011). Strategies for Profiting with Japanese
Candlestick Charts, volume 132. John Wiley & Sons.
Raimundo, M. S. and Okamoto Jr, J. (2018). Application
of hurst exponent (h) and the r/s analysis in the clas-
sification of forex securities. International Journal of
Modeling and Optimization, 8(2):116–124.
Rundo, F., Trenta, F., di Stallo, A. L., and Battiato, S.
(2019). Grid trading system robot (gtsbot): A novel
mathematical algorithm for trading fx market. Applied
Sciences, 9(9):1796.
Semeyutin, A., Gozgor, G., Lau, C. K. M., and Xu, B.
(2021). Effects of idiosyncratic jumps and co-jumps
on oil, gold, and copper markets. Energy Economics,
104:105660.
Shen, J. (2021). Nine challenges in modern al-
gorithmic trading and controls. arXiv preprint
arXiv:2101.08813.
Siami-Namini, S. and Namin, A. S. (2018). Forecasting
economics and financial time series: Arima vs. lstm.
arXiv preprint arXiv:1803.06386.
U.S. Securities and Exchange Commission (2022).
Day trading. Online: https://www.investor.gov/
introduction-investing/investing-basics/glossary/
day-trading. Accessed: 2022-11-20.
Vargas, M. R., De Lima, B. S., and Evsukoff, A. G. (2017).
Deep learning for stock market prediction from finan-
cial news articles. In 2017 IEEE international con-
ference on computational intelligence and virtual en-
vironments for measurement systems and applications
(CIVEMSA), pages 60–65. IEEE.
Weeraddana, N., Silva, A., and Jayathilake, P. (2018). De-
tection of black regions in the forex market by analyz-
ing high-frequency intraday data. In 2018 18th Inter-
national Conference on Advances in ICT for Emerging
Regions (ICTer), pages 384–391. IEEE.
Weng, F., Chen, Y., Wang, Z., Hou, M., Luo, J., and Tian,
Z. (2020). Gold price forecasting research based on an
improved online extreme learning machine algorithm.
Journal of Ambient Intelligence and Humanized Com-
puting, 11(10):4101–4111.
Zeng, H. and Lu, R. (2022). High-frequency volatility
connectedness and time-frequency correlation among
chinese stock and major commodity markets around
covid-19. Investment Management and Financial In-
novations, 19(2):260–273.
Zhang, W., Yan, K., and Shen, D. (2021). Can the baidu
index predict realized volatility in the chinese stock
market? Financial Innovation, 7(1):1–31.
ICAART 2023 - 15th International Conference on Agents and Artificial Intelligence
892
