On Metavisualization and Properties of Visualization
Jaya Sreevalsan-Nair
a
Graphics-Visualization-Computing Lab, International Institute of Information Technology Bangalore, Bangalore, India
Keywords:
Metavisualization, Visualization, Visual Analytics, Analysis of Visualizations, Human-in-the-Loop, Deep
Learning, Machine Learning, Systems, Chart Classification, Text Summarization.
Abstract:
Metavisualization is the “visualization of visualizations” which is the commonly used definition. However,
there is a gap in the theoretical foundations of metavisualization. This gap has led to the under-utilization
of metavisualization, which is much needed today, given the proliferation of the use of visualizations in data
science. Two observations have inspired this work to build the theory of metavisualization: (i) the interdisci-
plinary differences in the understanding of metavisualization, and (ii) the inter-relationships between metavi-
sualization, analysis of visualizations, and visual analytics. Hence, we conduct a systematic literature review
on metavisualization, identify visualization properties that can be used for generating a metavisualization, and
propose a design space for these properties. This work is a theoretical discourse on metavisualization of visu-
alization and its properties, based on the visualization-based understanding and practice of metavisualization.
1 INTRODUCTION
With the advent of machine learning (ML), deep
learning (DL), and artificial intelligence (AI), visual-
ization has increasingly become a relatively new data
format of interest (Wu et al., 2021). Visualization is
observed to be a multimodal dataset that includes vi-
sual encodings, images, text, etc. AI and ML meth-
ods are used for analysis of visualizations (AV). This
type of analysis is not new (Savva et al., 2011), but
is different from visual analytics (Keim et al., 2008)
(VA), which is also called visual data mining (Nocke
and Schumann, 2002). VA is a data science workflow
for any dataset, but with visualization methods and a
feedback loop included. Both AV and VA are of in-
terest to the visualization research community today.
We find a high degree of similarity between the
hand-crafted features in these ML models in AV and
the data used in metavisualization (Gilbert, 2005)
(MV). Metavisualization is a visualization of visual-
izations that provides cues to the users to enhance the
interactivity for knowledge discovery (Weaver, 2005).
The properties of the visualization serve as input data
to MV and are also used as features in learning mod-
els in AV. They are analogous to the information of
the data, i.e., metadata (Nocke and Schumann, 2002).
Despite its established usefulness (Weaver, 2005;
Sikachev et al., 2011), metavisualization in itself is
a
https://orcid.org/0000-0001-6333-4161
not fully studied owing to its complexity of involving
both visualization design, user interactions, and per-
formance studies. This has led to the gap in extend-
ing metavisualization to the larger context of study
of visualizations as a data format. Integrating MV
with associated topics of AV and VA is bound to im-
prove its usage. The reason why metavisualization is
to be revived and studied further is primarily to cater
to the growing popularity of visual analytics. This
uptake may be attributed to publicly available third-
party visualization libraries especially in Python and
Javascript, and VA tools, e.g., Tableau®.
VA provides the third actor in our analysis owing
to its interconnected relationships with both MV and
AV. We look at two ways in which VA is used as an
input to the other two. Firstly, VA tools widely use
composite visualizations (Javed and Elmqvist, 2012),
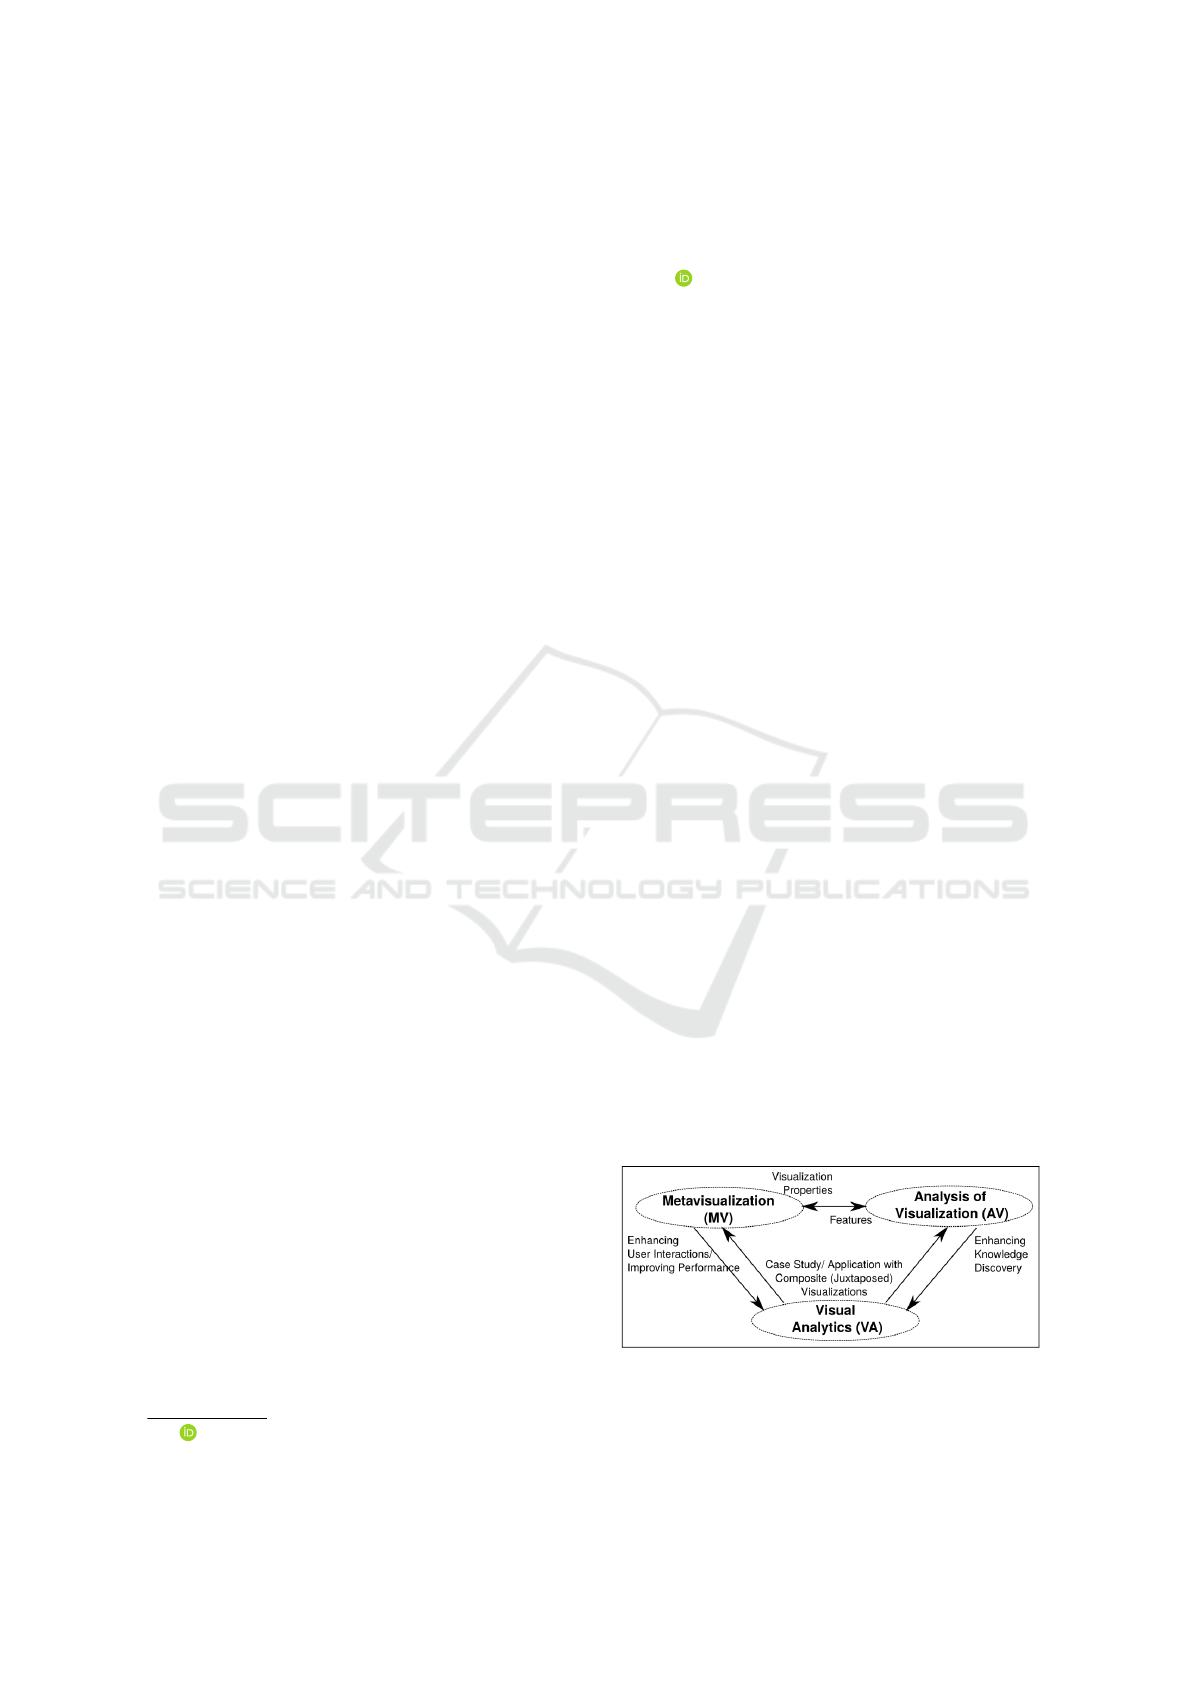
Figure 1: The interconnectedness between the three work-
flows (actors) pertaining to visualizations, namely, metavi-
sualization (MV), analysis of visualizations (AV), and vi-
sual analytics (VA).
230
Sreevalsan-Nair, J.
On Metavisualization and Properties of Visualization.
DOI: 10.5220/0011794300003417
In Proceedings of the 18th International Joint Conference on Computer Vision, Imaging and Computer Graphics Theory and Applications (VISIGRAPP 2023) - Volume 3: IVAPP, pages
230-239
ISBN: 978-989-758-634-7; ISSN: 2184-4321
Copyright
c
2023 by SCITEPRESS – Science and Technology Publications, Lda. Under CC license (CC BY-NC-ND 4.0)

especially the juxtaposed design. MV is used with co-
ordinated and multiple views (Knudsen and Carpen-
dale, 2016), which is the same as juxtaposed views.
Secondly, the surge in popularity of VA tools has led
to rapid growth in the volume of data visualizations,
especially information visualizations. This has in turn
led to its use as training and testing data for AI and
ML for visualizations in AV (Wu et al., 2021). In re-
turn, MV enables improving user interactions in VA,
by design, and AV improves knowledge discovery in
VA. Thus, we observe the tight interconnections be-
tween the three different workflows used in the visu-
alization research community (Figure 1).
The study of these interconnections leads to inter-
linking various practices in the visualization commu-
nity. Amongst the three actors here, VA is the most
studied and AV is an expanding topic. Hence, we fo-
cus on MV that has scope for reflection. The data used
in MV is the set of properties of visualization, which
needs to be explored in this specific context.
From an extensive literature review on the usage
of the term “metavisualization” (Dyer, 2021; Bertini
et al., 2011; Gilbert, 2005; Peck et al., 2019), we ob-
serve that there exists a gap in the understanding of
the term, “metavisualization.” This is attributed to
two key reasons, namely, (i) differences in the con-
ceptualization of metavisualization as used in the re-
search communities, and (ii) the lack of a systematic
study on which properties of visualization can be used
in its metavisualization. In this work, we study the
definition of metavisualization as the “visualization of
visualizations.” This definition is analogous to meta-
data being the ”data about data.” Here, we build the
theory of metavisualization based on the properties of
the visualizations that are usable in generating it.
In an in-depth study of metavisualization and
properties of visualizations, our contributions are:
• We conduct an extensive systematic literature re-
view on the usage of the term “metavisualization”
across different disciplines.
• We study the visualization properties currently
used as input to metavisualization, the hand-
crafted features in ML algorithms, the extractable
properties using AI/ML, and the indirect proper-
ties stemming from the user.
• We propose a high-level design space providing
three types of the visualization properties usable
in its metavisualization.
2 LITERATURE REVIEW
The etymology of the word is such that the prefix meta
refers to “transcending” (Merriam-Webster, 2022).
Thus, words such as “metadata,” “metaphysics,” and
“metapsychology” belong to the set of terms that de-
pict a scope transcending the object or topic of inter-
est, i.e., data, physics, and psychology, respectively.
We explore how the term “metavisualization” is per-
ceived in different communities in this section. To
the best of our knowledge, metavisualization is dis-
cussed widely in the research communities of STEM
(Science, Technology, Engineering, and Mathemat-
ics) learning and data visualization.
In STEM Learning: Visualization is a process of
determining and filtering out useful insights into data
through visual representation. In that train of thought,
metavisualization relates to the effectiveness of narra-
tion in learning, thus taking the learning outcomes as
an aspect of metavisualization (Dyer, 2021).
Metavisualization involves metacognition as per-
ceived in the domain of science education, where it
is a quality or property of the teacher and the stu-
dent (Chang, 2022). Since the focus of this def-
inition is the relationship between the human-in-
the-loop and the visualization, there are four key
aspects governing metavisualization (Chang, 2022).
Metavisualization of the user means his/her: (i) epis-
temic knowledge of visualization, i.e., the knowledge
of its scope, purposes, and limitations, (ii) demon-
stration of metacognitive capability in visualization,
where “metacognition” means “thinking of think-
ing” (Flavell, 1979), (iii) capability to critique visual-
izations using judgment criteria, and (iv) application
of metavisual strategies such as resourcing, focusing,
inducting, deducing, perfecting, intuitive modeling,
and recall. The use of visualization in education also
has been further studied through the lens of accessi-
bility for different subpopulations with respect to sev-
eral components of education (Peck et al., 2019), in-
cluding metavisualization.
Metavisualization gained significant attention
through Gilbert’s works which defined it as an im-
portant constituent of visualization competence, thus
upgrading metavisualization as an essential quality
of the teacher or the student (Gilbert, 2005; Gilbert,
2008). In all such studies, visualization plays an in-
dispensable role in STEM learning and education.
For instance, the role of visualization in learning
chemistry has been studied (Locatelli et al., 2010),
which serves as a case study in STEM education.
Provenance-enabled visualization systems are use-
ful for improving the learning experience of the
users (Davidson and Freire, 2008).
On Metavisualization and Properties of Visualization
231

In Data Visualization: In the visualization com-
munity, metavisualization is seen as a “visualiza-
tion of visualizations,” which is a sufficiently gen-
eral term used for the structure and operation of
nested visualization (Weaver, 2005). This perspec-
tive has led to work in metavisualization predomi-
nantly around structure, e.g., layout of views (Bertini
et al., 2011) in a juxtaposed composite visualiza-
tion (Javed and Elmqvist, 2012). In the evaluation
of high-dimensional data visualization, metavisual-
ization strategies refer to the list and matrix layouts of
views, where the scatter plot matrix is an example of
the latter. Metavisualization is then referred to as the
analysis and display of the inter-relationships between
the different views (or simpler visualizations) in the
layout, including their perceptual similarities (Pelto-
nen and Lin, 2013). The layout can be further opti-
mized by rearranging the plots in a scatter plot ma-
trix and other layouts by using a machine learning ap-
proach (Peltonen and Lin, 2013).
Going further beyond view layouts, metavisu-
alization has been referred to as the visualization
of view relations in coordinated and multiple views
(CMVs) (Knudsen and Carpendale, 2016). These
view relations are categorized into thirteen concepts,
namely, (i) tasks, (ii) interactions, (iii) brushing and
linking, (iv) axis relations, (v) legend relations, (vi)
visual components, (vii) grouping views, (viii) over-
lay/show more information, (ix) direction, flow, and
order, (x) line arrows, (xi) strength of relations, (xii)
clutter and scalability, and (xiii) interference with
views. The findings of these concepts are grouped as
tasks, representations, interactions, and challenges.
The integration of multiple views requires a sys-
tem implementation that uses several embeddings
to characterize the dynamic nature of the link-
ages (Weaver, 2005). The view relations can also be
part of a system that facilitates multiple users to in-
teract simultaneously and collaborate, and such a sys-
tem has been referred to as meta-visualization (Tobi-
asz et al., 2009).
In the context of CMVs, different from view lay-
outs, metavisualization has been referred to as visu-
alization of elements of data that can be categorized
as metadata (Roberts, 2007). Similarly, the interac-
tive exploration of the algorithm used in the visu-
alization has also been referred to as metavisualiza-
tion (Sikachev et al., 2011). The history of data and
workflows are part of a larger set of terms referred
to as visualization provenance (Callahan et al., 2006;
Ragan et al., 2015). Metadata is well-studied includ-
ing its classification (Nocke and Schumann, 2002).
The visualizations of the metadata itself provide in-
puts related to the filtering of data, which is done by
the user. Also, the metadata is considered a property
of the visualization. Thus, by design, visualization of
metadata is indeed a metavisualization.
Finally, different from being a visualization itself,
metavisualization has also been used as a framework
for interacting with the elements in the visualization
parameter space (Sikachev et al., 2011). These ele-
ments are mapping of data to parameters used in vi-
sualization algorithms, such as isosurface value in iso-
surface extraction.
Procedure for Systematic Literature Review
(SLR): We performed a systematic literature review,
adopting the method used in health sciences (Lame,
2019). We followed these steps:
1. Review question: We framed our review question
on the definition of metavisualization. This re-
view is necessary to find a widely accepted defini-
tion(s) needed for identifying usable visualization
properties.
2. Inclusion-Exclusion Criteria: We included all
publications using the word “metavisualization,”
“meta-visualization,” and “meta visualization.”
We did not use any specific explicit exclusion cri-
teria.
3. Locating Studies: We used Google Scholar and its
optimized search engine to identify the papers of
interest. The choice of database is important to
expand the search to the largest extent.
4. Study Selection: We selected all studies which
were not specifically case studies. This is because
a generalized understanding of metavisualization
is needed here.
5. Data Extraction: The author has exclusively col-
lected the selection of papers over a period of
three years along with the research on chart analy-
sis. Given the relatively smaller set of appropriate
papers, a single reviewer was sufficient. The au-
thor reviewed 8 papers in the visualization domain
and 10 papers in the education domain.
6. Result Presentation: The results have been pre-
sented in this paper in the form of reporting and
inter-domain comparisons.
Hereafter, we retain the focus on the definition
of metavisualization as perceived in the visualization
community, without delving deeper into the perspec-
tive of the education community.
IVAPP 2023 - 14th International Conference on Information Visualization Theory and Applications
232
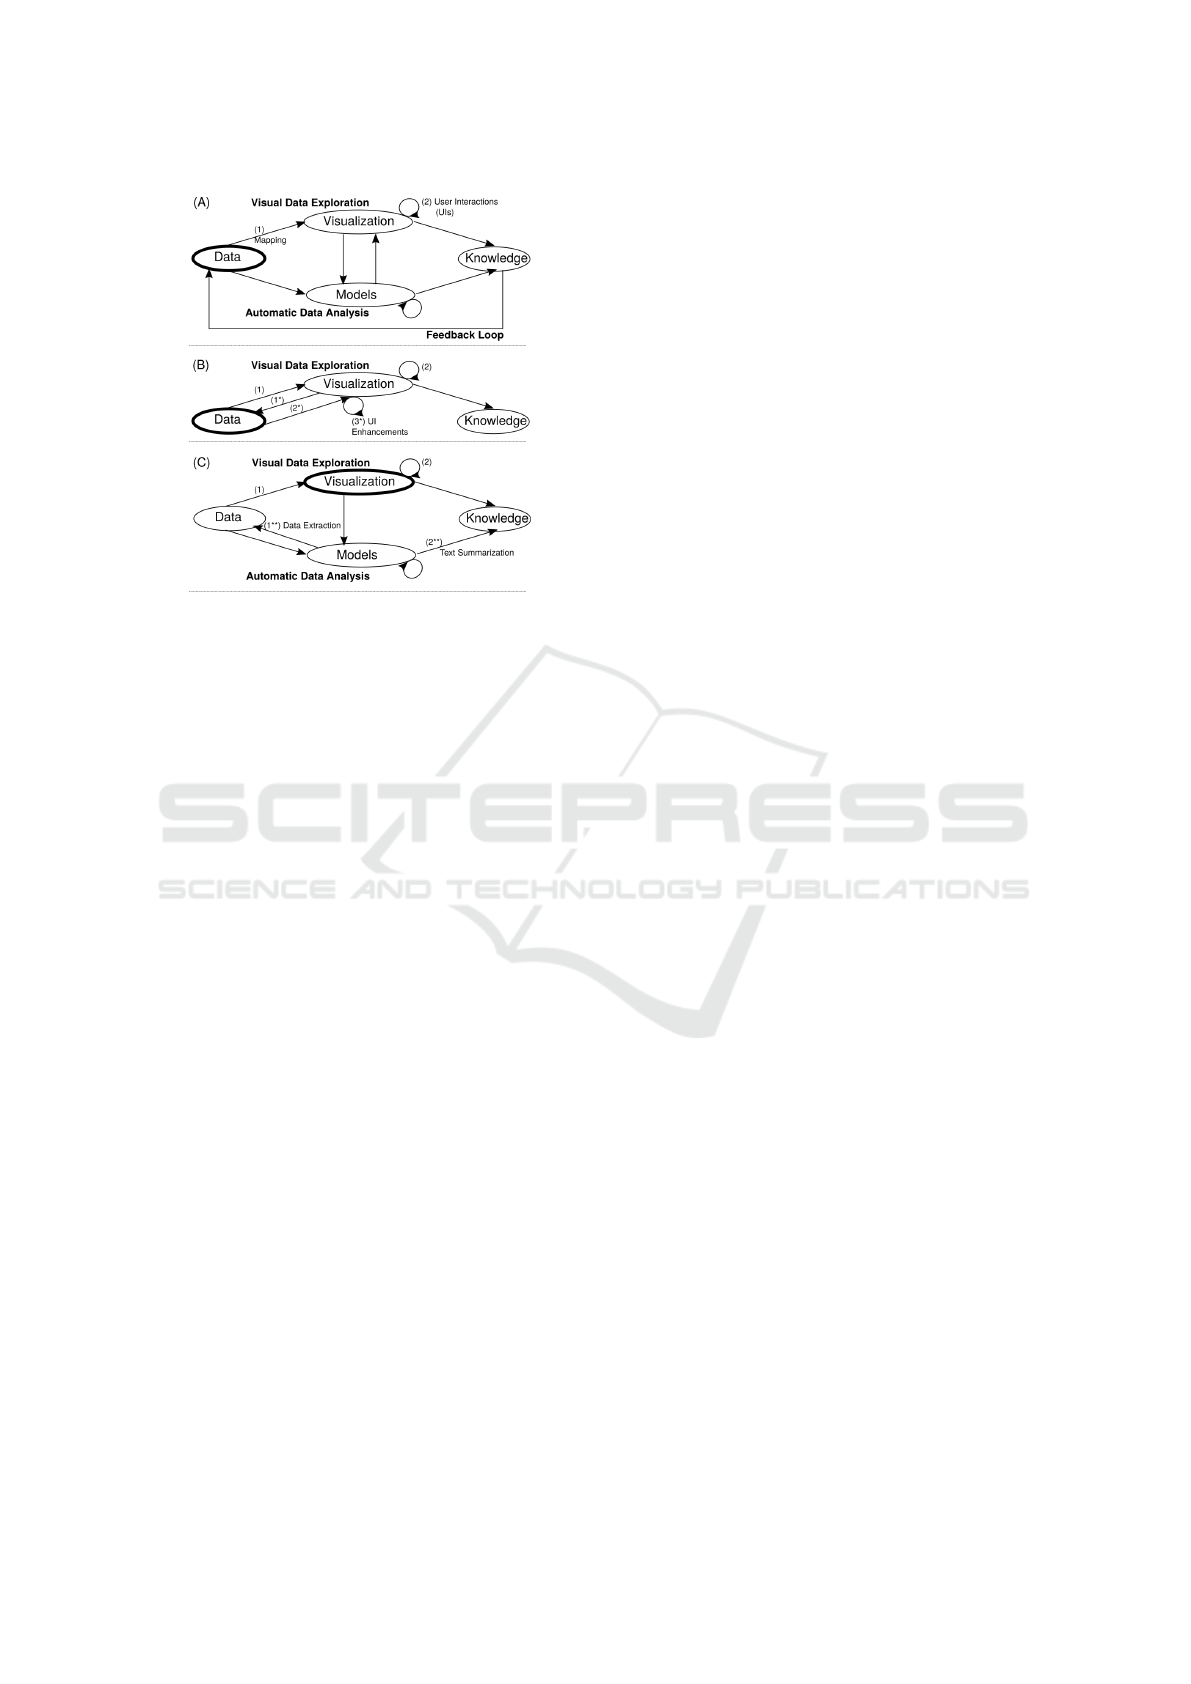
Figure 2: Comparing the workflows in (A) visual analytics
(VA) (Keim et al., 2008), (B) metavisualization (MV), and
(C) analysis of visualizations (AV) using machine learn-
ing models. (1) and (2) are present in all. (1*) and (2*)
correspond to data extraction and mapping exclusively for
MV, respectively. The bold ellipse indicates the input to the
workflow, and in (C), the input is a static visualization, and
(2) is applicable only for redesigned visualizations.
3 VISUALIZATION PROPERTIES
FOR METAVISUALIZATION
With the advent of modern methods of image pro-
cessing using learning models, i.e., ML and DL, we
observe that some of the properties of the visualiza-
tion can be extracted using automated systems. At the
same time, a few properties are already being used
in feature engineering in ML (Wu et al., 2021). We
compare the handcrafted features in ML methods and
the attributes used for metavisualization. Further, we
discuss the key image processing methods for extract-
ing these features. We then separate the visualization-
based and user-centric properties of MV, where the
latter has not been used in MV to the best of our
knowledge. We refer to them as direct and indirect
visualization properties, respectively. Finally, we pro-
pose a high-level design space of visualization prop-
erties usable in MV, and the implications of such a
design space.
3.1 ML Model Features and
Visualization Properties in MV
To establish the inter-relationships between input data
to MV and features extracted in AV, we first compare
MV and AV, respectively. We start with the familiar
VA workflow (Keim et al., 2008), based on the in-
terconnectedness of the trio (Figure 1). In Figure 2,
(A) is the simplified state diagram that shows the VA
workflow with the feedback loop and presence of data
science workflow. We mark the recurring features in
the trio, namely, (1) mappings and (2) user interac-
tions (UIs). In (B), we see that the source visual-
ization is used to retrieve data in (1*), and then the
target visualization, i.e., metavisualization is gener-
ated in (2*). We separate the UIs in metavisualiza-
tion as (3*) from th UIs of the original visualiza-
tion. In (C), the static visualization is the input to the
workflow, and it can be redesigned to an interactive
one using the extracted data using the learning mod-
els (1**). These learning models are required to ex-
tract information from the image and text data of the
visualization (Dadhich et al., 2021a; Dadhich et al.,
2021b). The extracted data and concerned learning
models for natural language generation (NLG) are
further used for text summarization (Al-Zaidy and
Giles, 2017). Thus, a comparative study of these
workflow diagrams conveys the similarities and dif-
ferences in these three known processes, and explains
their tight interconnectedness, as seen in Figure 1.
Narrowing down our focus to Figure 2 (B) and
(C), we now look at the similarities between visual-
ization properties (Weaver, 2005) and engineered fea-
tures (Wu et al., 2021). The data used in a metavi-
sualization tool, Improvise (Weaver, 2005) includes
relationships between windows (views), interactions,
and visualizations. Thus, these relationships are used
as visualization properties. Additionally, the layout
of the visualizations and their elements, in the form
of a list or matrix (Bertini et al., 2011), is a visualiza-
tion property. We also find the mappings from data to
visualization parameter space (Sikachev et al., 2011)
can be considered as properties. The data and its
metadata itself are also inputs (Nocke and Schumann,
2002). Given the disparate use-cases of metavisual-
ization, there is no systematic study on the specific
visualization properties that are used as its inputs.
At the same time, we observe that these proper-
ties recur in feature engineering in ML models. These
features are classified as graphics, program, text, and
underlying data (Wu et al., 2021). Amongst these,
graphics features include image descriptors, element
positions or localized regions, and element styles.
The program features include parameters, commu-
nicative signals, and design rules. The text includes
largely statistical model features, and data includes
both statistics and the one-hot vectors.
Narrowing down our scope to VA tools, the sim-
ilarities between these features and properties in-
clude the structure of visualizations and interac-
On Metavisualization and Properties of Visualization
233

tions/communicative signals. The features that have
the potential to be considered as inputs to MV in the
future are image descriptors and statistical models in
text. This is because the image and text properties of
the visualization can enhance user interactions.
3.2 Visualization Properties Extracted
from Images
With the advent of ML/DL practices and meth-
ods (Alom et al., 2018), e.g., ImageNet benchmark
database (Deng et al., 2009) and AlexNet (Krizhevsky
et al., 2017), tasks such as classification and segmen-
tation using artificial perception are automated (Beyer
et al., 2020). Applying modern image processing to
the images of visualizations may appear as a con-
flict with metavisualization, as “processing of visual-
ization” is different from “visualization of visualiza-
tions.” We argue that image processing can be seen as
an alternative to manually curating information about
the visualization, thus automating processes in gener-
ating metavisualization. At the same time, this opens
up questions on which outcomes of image analysis are
conventionally used in MV.
Here, we are interested only in those automated
tasks that provide such properties of the visual-
ization. Examples of such properties include its
chart/visualization type and the dataset used, includ-
ing its metadata. We also find that textual summa-
rization (Demir et al., 2008) is yet another task that
is descriptive in nature pertaining to the important as-
pects of the data, and textual content is generated us-
ing these findings from the chart visualization. Last
but not the least, the provenance of the visualization
is one of its key properties (Callahan et al., 2006).
There is also active research on the analysis of
visualizations that automate activities involving both
human perception and cognition systems, e.g., an-
swering a question on the data using the visualiza-
tion as an aid to understanding the data. In our
visualization-based MV, we refer to such information
gleaned from a visualization as indirect properties,
and they are further explained in Section 3.3.
Chart Classification: Chart classification is consid-
ered an important step in automated chart interpreta-
tion (Savva et al., 2011; Battle et al., 2018; Choi et al.,
2019; Dadhich et al., 2021a; Dadhich et al., 2021b).
This is because the consequent analysis of data extrac-
tion and chart redesign are chart type-dependent. For
type classification, low-level features are computed
on the images of charts and run on a supervised learn-
ing model (Savva et al., 2011; Battle et al., 2018).
Recently, convolutional neural networks are directly
used for the classification of such images, e.g., using
the ResNet (Choi et al., 2019) and VGG-16 (Dadhich
et al., 2021a; Dadhich et al., 2021b) architectures.
Data Extraction: Automated extraction of data from
images of charts has been a challenging problem of
interest in the last two decades. With a mix of ML/DL
models and geometry-based image processing, there
have been several works that extract data from sim-
pler charts, e.g., scatter plots (Cliche et al., 2017;
Dadhich et al., 2021b; Daggubati and Sreevalsan-
Nair, 2022), bar charts (Al-Zaidy and Giles, 2015;
Dadhich et al., 2021a; Daggubati et al., 2022), and
a mix of charts (Choi et al., 2019; Sreevalsan-Nair
et al., 2021). Such systems include object detection,
text detection and recognition using Optical Charac-
ter Recognition (OCR) and appropriate Natural Lan-
guage Processor (NLP) CNNs, and pixel-to-data con-
version in their workflows (Al-Zaidy and Giles, 2015;
Choi et al., 2019; Dadhich et al., 2021a; Dadhich
et al., 2021b).
The problem statement of data extraction from vi-
sualizations has spurned an important area of research
in making visualizations accessible to the visually
impaired (Choi et al., 2019; Dadhich et al., 2021a).
Given there are several images available on the web,
automated extraction and interpretation of those visu-
alizations enable improving the usage of the content.
Textual Summarization: There are several existing
works that focus on generating textual summaries of
the charts. Such summaries have been widely imple-
mented for bar charts (Demir et al., 2008; Al-Zaidy
et al., 2016; Dadhich et al., 2021a; Daggubati et al.,
2022). These summaries are generated using a proto-
form (Al-Zaidy et al., 2016), i.e., a template. One
such system identifies the sign of the trends in the
data represented by the bar chart (Demir et al., 2008).
Apart from data of salient bars, information is ex-
tracted using a semantic graph that connects the struc-
tural features of the graph, namely, the axis labels,
the legend information, etc. Further, design study
methodology (Sedlmair et al., 2012) has been used to
improve the content used in textual summaries (Dag-
gubati et al., 2022). Natural Language Generator
(NLG) neural networks are instrumental here.
Provenance of a Visualization: Vistrails is one of
the earliest frameworks to allow the user to explore
the provenance of a visualization (Callahan et al.,
2006). It is an important milestone as it reinforced
the importance of the data and algorithm used in a vi-
sualization. Also, while several discussions so far in
our work have examples of information visualization,
Vistrails is a framework that was primarily designed
for scientific visualization. Thus, discussing Vistrails
here makes our work inclusive of both scientific and
information visualization.
IVAPP 2023 - 14th International Conference on Information Visualization Theory and Applications
234

In an organizational framework for different per-
spectives surrounding provenance, two such cate-
gorizations have been proposed, namely, types of
provenance information and the purposes of prove-
nance (Ragan et al., 2015). In our work, we are
interested in the former which includes five types,
namely, of (i) data, (ii) visualization, (iii) interac-
tion, (iv) insight, and (v) rationale. Even with these
types, our study of visualization-based metavisualiza-
tion will be limited to the provenance types of data
and visualization alone, as the remaining types inter-
face with the users. Data provenance itself is given
significant attention in the visualization community,
as seen in several works (Xu et al., 2020). Data
provenance includes both prospective and retrospec-
tive types (Davidson and Freire, 2008), as well as
process provenance (Ragan et al., 2015). Provenance
analytics and visualization are useful to improve the
concerned visualization itself (Davidson and Freire,
2008), thus cementing the place of data and visual-
ization provenance as input data in MV.
3.3 Indirect Visualization Properties
There are properties of visualization that are not con-
ventionally used as data in MV. They stem indirectly
from visualization, and hence, have not been used in
MV until now. We discuss them here to indicate their
potential usability in the future.
We categorize such properties into the cognitive
insights to the visualization and the metavisual skills
of the user. The former involves processes culminat-
ing in human cognition and the latter involves the user
himself/herself. Thus, these properties are heavily de-
pendent on the interpretation and usage of visualiza-
tion by the human-in-the-loop. Overall, how they can
be represented as a tangible input to MV requires an
in-depth study. As discussed in Section 3.2, there is
new interest in cognitive outcomes owing to the recent
trend of them being automated using ML/DL meth-
ods, e.g., reasoning over charts, which may promote
the future use-cases.
Cognitive Insights to Visualization: The evalua-
tion of visualization is conventionally done using user
studies to accommodate the human-in-the-loop and
the generative nature of the visualization process (El-
lis and Dix, 2006). User study-based evaluation is an
important aspect of the design study methodology in
its implement and deploy stages in the Core Phase,
as given in the nine-stage framework (Sedlmair et al.,
2012). Thus, the evaluation provides more insight
into the visualization and its purpose for a specific
user in a specific context. The evaluation involves the
analysis of the visualization based on the capability
of the user, and hence, it directly does not provide in-
formation about the visualization. This may explain
why the evaluation of visualization has not been con-
sidered in MV as yet.
Reasoning over charts is another activity that pro-
vides insight into visualization using human cogni-
tion. This activity is the outcome of a question-
answering (QA) system based on charts. Such a sys-
tem is designed to automatically answer the ques-
tion posed to it concerning a plot. QA systems are
characterized by the answer types. The answers can
be binary (Kahou et al., 2017), from a fixed vo-
cabulary (Kafle et al., 2018), or from open vocabu-
lary (Methani et al., 2020). The core of such systems
is a neural network model.
The process involved in the tasks of data extrac-
tion and reasoning over charts follow similar work-
flows, and these tasks have been implemented for sim-
pler and more popular charts, namely, bar, line, and
scatter plots. However, the outcome of the former
can be seen as a direct visualization property, but not
the latter. This may be attributed to the characteristic
of the latter being user-centric and not visualization-
based, as it mimics and automates the responses from
the user. QA systems do not have to extract the data
in its entirety, as the models are trained to extract rel-
evant data to answer the questions alone. This is done
in practice to reduce the cost of training a model for
the entire dataset.
Metavisual Skills of the User: As discussed in
Section 2, in the context of science education, MV
is described as a metacognitive quality of the user
of the visualization to “acquire, monitor, integrate,
and extend” from a visual representation of a scien-
tific concept for learning purposes (Gilbert, 2005).
STEM education routinely suffers from representa-
tion dilemma as content learning requires that stu-
dents need the competency to understand visual rep-
resentations (Rau, 2017). For instance, in the chem-
istry laboratory, the students are expected to holis-
tically understand and navigate through the trans-
formations between macroscopic, sub-microscopic,
and symbolic visual representations in the experiment
design and implementation, i.e., representations of
equipments/chemicals, molecular models, and chem-
ical equations, respectively (Chittleborough and Trea-
gust, 2008). Thus, in the parlance of science edu-
cation, MV represents the perspective of representa-
tional competency of the learner, i.e., the competency
of the user in effectively using text and multiple vi-
sual representations (Rau, 2017). Such a conceptual-
ization of MV is essential in pedagogy.
Similarly, the data and visualization provenance
types have been used in MV (Section 3.2), but there
On Metavisualization and Properties of Visualization
235

are certain provenance types that have not been.
These include the provenance of interface with re-
spect to the user, i.e., of interactions, insight, and ra-
tionale (Ragan et al., 2015).
In the domain of computer science, analogous to
the usage of the term metadata, the focus on metavi-
sualization has been on the visualization structure and
user interactions, as opposed to the quality of the user.
The user-centric definition is a paradigm shift from
the focus on the visualization or its image representa-
tion. We currently do not have a framework to study
them both together or a user-centric study exclusively,
which may be considered for future study.
3.4 Design Space of Visualization
Properties in MV
Inspired by the types of metadata (Nocke and Schu-
mann, 2002; Riley, 2017), we propose types of visual-
ization properties used in MV. The reason to establish
this novel classification is two-fold. Firstly, it pro-
vides a design space, which is different from taxon-
omy, for identifying data required for generating MV.
Thus, it provides a set of visualization properties ren-
dered in MV. Secondly, as any design space (Javed
and Elmqvist, 2012), it opens up potential directions
for research in the future.
The four classes of metadata are namely de-
scriptive, structural, administrative, and markup lan-
guages (Riley, 2017). Descriptive metadata is infor-
mation on the source of the data or a resource. The
structural metadata describes the inter-relationships
of parts of resources. The administrative metadata
has three subtypes, namely, technical, preservation,
and rights. These pertain to the legal and manage-
ment aspects of the data. Finally, markup languages
are which integrate metadata with specific parts of the
data itself.
For visualization properties rendered in MV, we
propose three types, namely, “descriptive,” “struc-
tural,” and “provenantial.” We list specific proper-
ties as examples of each type, and suggest their corre-
sponding representative visualizations. These visual-
izations can then be added to MV.
Descriptive Metavisualization: Similar to that of
metadata, this type pertains to the type of visualiza-
tion, its creator, title, source, file format, and textual
summary. These can be provided as annotations to an
existing MV, as has been done for other forms of con-
tent (Knudsen and Carpendale, 2016). The type could
also be visualized in the form of an icon or glyph. The
textual summary can be visualized using a tag or word
cloud. We propose the addition of image and text de-
scriptors in the descriptive category.
Structural Metavisualization: This type pertains
to the relations between the views and their lay-
out in the visualization (Knudsen and Carpendale,
2016) and the mapping of data to its marks and chan-
nels (Munzner, 2014). View relations can be anno-
tated, thus adding to MV (Knudsen and Carpendale,
2016). The mapping between the set of visual vari-
ables, i.e., marks and channels, and that of the data
variables can be visualized using a node-link diagram
of the bipartite graph to study redundant encoding, as
an example.
Provenantial Metavisualization: This type pertains
to the provenance of the visualization. The prove-
nance of the visualization itself depends on the data
and the algorithm used to generate it (Weaver, 2005;
Callahan et al., 2006; Roberts, 2007; Sikachev et al.,
2011). The different examples of provenance studies
have also shown the visualizations used as MV. These
visualizations show the transformations to data and
states of the algorithm being executed.
3.5 Discussion
In summary, we define metavisualization as follows:
Definition 1 (Metavisualization). The visualization of
properties of a source visualization that are attributed
to its description, structure, and provenance is defined
as metavisualization of the source.
The design space of visualization properties in
MV (Section 3.4) now also provides the much-needed
scaffold to include any property that fits the type de-
scription. We also observe that this also opens up the
possibilities of different visualizations as MV.
We also use this work to provide interdisciplinary
perspectives in two ways. Firstly, we connect the ar-
eas of computer vision and image processing with
visualization where the results from the chart im-
age analysis can be used in metavisualization. This
specific relationship can be studied further in future
work. Secondly, we compare and discern the differ-
ences in perspectives of the word “metavisualization.”
While this is not an exhaustive study in its current
form, our work seeds a systematic investigation of
metavisualization in these directions in the future.
4 CONCLUSIONS
In this work, we have theoretically determined the
types of visualization properties that can be visual-
ized, thus providing metavisualization. We perform a
systematic study of existing literature to identify the
different understandings of the term “metavisualiza-
IVAPP 2023 - 14th International Conference on Information Visualization Theory and Applications
236

tion.” We have further identified appropriate proper-
ties to be used, and also created a design space for
them. This has been possible by bringing in inter-
relationships between metavisualization, the burgeon-
ing area of AI/ML methods of analysis of visualiza-
tion, and the widely used visual analytics.
Given the limited literature on metavisualization
despite its value as a visualization practice, there is
a need to formalize its implementation to improve its
usage. Hence, as a first step, we identify visualization
properties based on more recent and relevant prac-
tices, namely, AI/ML analysis of visualization and vi-
sual analytics. These properties are currently or have
the potential to be input data to metavisualization.
Also, there is a bias towards information visu-
alization systems and workflows in the literature on
metavisualization. At the same time, scientific visu-
alization has been studied at length in terms of prove-
nance. Hence, building more metavisualization has
the scope to expand the current state-of-the-art using
elements from both scientific and information visual-
ization practices. Such an expansion may prove ben-
eficial in reviving the use of metavisualization.
As a concluding remark, the use of metavisual-
ization is essential for enhancing usability and inter-
activity of increasingly complex visualization work-
flows; and this paper connects the theoretical aspects
of metavisualization to the current practices.
ACKNOWLEDGEMENTS
This article is a culmination of our collaborative
project with Sindhu Mathai, on how school students
use charts. This work has been inspired by the
joint research with Komal Dadhich and Siri Chandana
Daggubati. We are grateful to the Machine Intelli-
gence and Robotics (MINRO) grant of the Govern-
ment of Karnataka and IIITB for their continued sup-
port of this work.
REFERENCES
Al-Zaidy, R., Choudhury, S., and Giles, C. (2016). Auto-
matic summary generation for scientific data charts.
In WS-16-01, volume WS-16-01 - WS-16-15, pages
658–663, United States. AI Access Foundation.
Al-Zaidy, R. A. and Giles, C. L. (2015). Automatic Ex-
traction of Data from Bar Charts. In Proceedings of
the 8th International Conference on Knowledge Cap-
ture, K-CAP 2015, pages 1–4, New York, NY, USA.
Association for Computing Machinery.
Al-Zaidy, R. A. and Giles, C. L. (2017). A machine learning
approach for semantic structuring of scientific charts
in scholarly documents. In Twenty-Ninth IAAI Con-
ference.
Alom, M. Z., Taha, T. M., Yakopcic, C., Westberg, S.,
Sidike, P., Nasrin, M. S., Van Esesn, B. C., Awwal, A.
A. S., and Asari, V. K. (2018). The history began from
AlexNet: A comprehensive survey on deep learning
approaches. arXiv preprint arXiv:1803.01164.
Battle, L., Duan, P., Miranda, Z., Mukusheva, D., Chang,
R., and Stonebraker, M. (2018). Beagle: Automated
Extraction and Interpretation of Visualizations from
the Web. In Proceedings of the 2018 CHI Confer-
ence on Human Factors in Computing Systems, CHI
’18, pages 1–8, New York, NY, USA. Association for
Computing Machinery.
Bertini, E., Tatu, A., and Keim, D. (2011). Quality metrics
in high-dimensional data visualization: An overview
and systematization. IEEE Transactions on Visualiza-
tion and Computer Graphics, 17(12):2203–2212.
Beyer, L., H
´
enaff, O. J., Kolesnikov, A., Zhai, X., and Oord,
A. v. d. (2020). Are we done with ImageNet? arXiv
preprint arXiv:2006.07159.
Callahan, S. P., Freire, J., Santos, E., Scheidegger, C. E.,
Silva, C. T., and Vo, H. T. (2006). VisTrails: Visual-
ization Meets Data Management. In Proceedings of
the 2006 ACM SIGMOD international conference on
Management of data, pages 745–747.
Chang, H.-Y. (2022). Science teachers’ and students’
metavisualization in scientific modeling. Science Ed-
ucation, 106(2):448–475.
Chittleborough, G. and Treagust, D. (2008). Correct inter-
pretation of chemical diagrams requires transforming
from one level of representation to another. Research
in science education, 38(4):463–482.
Choi, J., Jung, S., Park, D. G., Choo, J., and Elmqvist, N.
(2019). Visualizing for the Non-Visual: Enabling the
Visually Impaired to Use Visualization. In Computer
Graphics Forum, volume 38(3), pages 249–260. Wi-
ley Online Library.
Cliche, M., Rosenberg, D., Madeka, D., and Yee, C. (2017).
Scatteract: Automated extraction of data from scat-
ter plots. In Joint European Conference on Machine
Learning and Knowledge Discovery in Databases,
pages 135–150, Cham. Springer.
Dadhich, K., Daggubati, S. C., and Sreevalsan-Nair, J.
(2021a). BarChartAnalyzer: Digitizing Images of
Bar Charts. In Proceedings of 1
st
International Con-
ference on Image Processing and Vision Engineering
(IMPROVE), pages 17–28. INSTICC, SciTePress.
Dadhich, K., Daggubati, S. C., and Sreevalsan-Nair, J.
(2021b). ScatterPlotAnalyzer: Digitizing Images of
Charts Using Tensor-based Computational Model. In
Paszynski, M., Kranzlm
¨
uller, D., Krzhizhanovskaya,
V. V., and Dongarra, Jack J.and Sloot, P. M., editors,
International Conference on Computational Science,
Computational Science – ICCS 2021, Part V, Lecture
Notes in Computer Science, volume 12746, pages 70–
83, Cham. Springer International Publishing.
Daggubati, S. C. and Sreevalsan-Nair, J. (2022). ACCirO:
A System for Analyzing and Digitizing Images of
Charts with Circular Objects. In Computational Sci-
On Metavisualization and Properties of Visualization
237

ence – ICCS 2022, Proceedings of the 22
nd
Interna-
tional Conference, Part III, chapter 50, pages 605–
612, Cham. Springer International Publishing.
Daggubati, S. C., Sreevalsan-Nair, J., and Dadhich, K.
(2022). BarChartAnalyzer: Data Extraction and Sum-
marization of Bar Charts from Images. SN Computer
Science, 3(500).
Davidson, S. B. and Freire, J. (2008). Provenance and
scientific workflows: challenges and opportunities.
In Proceedings of the 2008 ACM SIGMOD inter-
national conference on Management of data, pages
1345–1350.
Demir, S., Carberry, S., and McCoy, K. F. (2008). Generat-
ing Textual Summaries of Bar Charts. In Proceedings
of the Fifth International Natural Language Genera-
tion Conference, INLG ’08, pages 7–15, USA. Asso-
ciation for Computational Linguistics.
Deng, J., Dong, W., Socher, R., Li, L.-J., Li, K., and Fei-
Fei, L. (2009). Imagenet: A large-scale hierarchical
image database. In Proceedings of IEEE Conference
on Computer Vision and Pattern Recognition, pages
248–255. IEEE.
Dyer, R. (2021). Visualizing Your Visualizations: The
Role of Meta-visualization in Learning Analytics. In
Sahin, M. and Ifenthaler, D., editors, Visualizations
and Dashboards for Learning Analytics, pages 173–
188. Springer International Publishing, Cham.
Ellis, G. and Dix, A. (2006). An explorative analysis of
user evaluation studies in information visualisation.
In Proceedings of the 2006 AVI workshop on BEyond
time and errors: novel evaluation methods for infor-
mation visualization, pages 1–7.
Flavell, J. H. (1979). Metacognition and cognitive monitor-
ing: A new area of cognitive–developmental inquiry.
American Psychologist, 34(10):906.
Gilbert, J. K. (2005). Visualization: A metacognitive skill
in science and science education. In Visualization in
science education, pages 9–27. Springer.
Gilbert, J. K. (2008). Visualization: An emergent field of
practice and enquiry in science education. In Visu-
alization: Theory and practice in science education,
pages 3–24. Springer.
Javed, W. and Elmqvist, N. (2012). Exploring the design
space of composite visualization. In 2012 IEEE Pa-
cific Visualization Symposium, pages 1–8. IEEE.
Kafle, K., Price, B., Cohen, S., and Kanan, C. (2018).
DVQA: Understanding data visualizations via ques-
tion answering. In Proceedings of the IEEE con-
ference on computer vision and pattern recognition,
pages 5648–5656.
Kahou, S. E., Michalski, V., Atkinson, A., K
´
ad
´
ar,
´
A.,
Trischler, A., and Bengio, Y. (2017). FigureQA: An
annotated figure dataset for visual reasoning. arXiv
preprint arXiv:1710.07300.
Keim, D., Andrienko, G., Fekete, J.-D., G
¨
org, C., Kohlham-
mer, J., and Melanc¸on, G. (2008). Visual analytics:
Definition, process, and challenges. In Information
visualization, pages 154–175. Springer.
Knudsen, S. and Carpendale, S. (2016). View rela-
tions: An exploratory study on between-view meta-
visualizations. In Proceedings of the 9th Nordic Con-
ference on Human-Computer Interaction, pages 1–10.
Krizhevsky, A., Sutskever, I., and Hinton, G. E. (2017). Im-
ageNet Classification with Deep Convolutional Neu-
ral Networks. Communications of the ACM, 60(6):84–
90.
Lame, G. (2019). Systematic literature reviews: An intro-
duction. In proceedings of the design society: inter-
national conference on engineering design, volume 1,
pages 1633–1642. Cambridge University Press.
Locatelli, S., Ferreira, C., and Arroio, A. (2010). Metavisu-
alization: An important skill in the learning chemistry.
Problems of Education in the 21st Century, 24:75.
Merriam-Webster (2022). Metadata – Definition and Mean-
ing. https://www.merriam-webster.com/dictionary/
metadata. Last accessed on November 20, 2022.
Methani, N., Ganguly, P., Khapra, M. M., and Kumar, P.
(2020). PlotQA: Reasoning over Scientific Plots. In
The IEEE Winter Conference on Applications of Com-
puter Vision, pages 1516–1525.
Munzner, T. (2014). Visualization analysis and design.
CRC press.
Nocke, T. and Schumann, H. (2002). Meta data for visual
data mining. In Proceedings Computer Graphics and
Imaging (CGIM), pages 358–064. ACTA Press.
Peck, E. M., Ayuso, S. E., and El-Etr, O. (2019). Data is per-
sonal: Attitudes and perceptions of data visualization
in rural pennsylvania. In Proceedings of the 2019 CHI
Conference on Human Factors in Computing Systems,
pages 1–12.
Peltonen, J. and Lin, Z. (2013). Information retrieval per-
spective to meta-visualization. In Asian Conference
on Machine Learning, pages 165–180. PMLR.
Ragan, E. D., Endert, A., Sanyal, J., and Chen, J. (2015).
Characterizing provenance in visualization and data
analysis: an organizational framework of provenance
types and purposes. IEEE transactions on visualiza-
tion and computer graphics, 22(1):31–40.
Rau, M. A. (2017). Conditions for the effectiveness of mul-
tiple visual representations in enhancing STEM learn-
ing. Educational Psychology Review, 29(4):717–761.
Riley, J. (2017). Understanding Metadata: What is Meta-
data and What is it for? Washington DC, United
States: National Information Standards Organization,
23.
Roberts, J. C. (2007). State of the art: Coordinated &
multiple views in exploratory visualization. In Fifth
international conference on coordinated and multiple
views in exploratory visualization (CMV 2007), pages
61–71. IEEE.
Savva, M., Kong, N., Chhajta, A., Fei-Fei, L., Agrawala,
M., and Heer, J. (2011). ReVision: Automated Clas-
sification, Analysis and Redesign of Chart Images. In
Proceedings of the 24th Annual ACM Symposium on
User Interface Software and Technology, UIST ’11,
pages 393–402, New York, NY, USA. Association for
Computing Machinery.
Sedlmair, M., Meyer, M., and Munzner, T. (2012). Design
study methodology: Reflections from the trenches and
IVAPP 2023 - 14th International Conference on Information Visualization Theory and Applications
238

the stacks. IEEE Transactions on Visualization and
Computer Graphics, 18(12):2431–2440.
Sikachev, P., Amirkhanov, A., Laramee, R., and Mistel-
bauer, G. (2011). Interactive algorithm exploration
using meta visualization. Technical report, Institute
of Computer Graphics and Algorithms, Vienna Uni-
versity of Technology, Vienna, Austria, TR-186-2-11-
2.
Sreevalsan-Nair, J., Dadhich, K., and Daggubati, S. C.
(2021). Tensor Fields for Data Extraction from Chart
Images: Bar Charts and Scatter Plots. In Hotz, I.,
Bin Masood, T., Sadlo, F., and Tierny, J., editors,
Topological Methods in Data Analysis and Visualiza-
tion VI, pages 219–241. Springer, Cham and arxiv
preprint.
Tobiasz, M., Isenberg, P., and Carpendale, S. (2009). Lark:
Coordinating co-located collaboration with informa-
tion visualization. IEEE transactions on visualization
and computer graphics, 15(6):1065–1072.
Weaver, C. (2005). Visualizing coordination in situ. In
IEEE Symposium on Information Visualization (IN-
FOVIS), pages 165–172. IEEE.
Wu, A., Wang, Y., Shu, X., Moritz, D., Cui, W., Zhang,
H., Zhang, D., and Qu, H. (2021). AI4VIS: Survey
on artificial intelligence approaches for data visualiza-
tion. IEEE Transactions on Visualization and Com-
puter Graphics.
Xu, K., Ottley, A., Walchshofer, C., Streit, M., Chang, R.,
and Wenskovitch, J. (2020). Survey on the analysis
of user interactions and visualization provenance. In
Computer Graphics Forum, volume 39, pages 757–
783. Wiley Online Library.
On Metavisualization and Properties of Visualization
239
