
A Comparative Study of GAN Methods for Physiological Signal
Generation
Nour Neifar
1
, Achraf Ben-Hamadou
2
, Afef Mdhaffar
1
, Mohamed Jmaiel
1
and Bernd Freisleben
3
1
ReDCAD Lab, ENIS, U niversity of Sfax, Tunisia
2
Centre de Recherche en Num´erique de Sfax, Laboratory of Signals, Systems, Artificial Intelligence and Networks,
Technopˆole de Sfax, Sfax, Tunisia
3
Department of Mathematics and Computer Science, Philipps-Universit¨at Marburg, Germany
freisleben@uni-marburg.de
Keywords:
GAN, Time Series, ECG, PPG, P hysiological Signals
Abstract:
Due to medical data scarcity and complex dynamics of physiological signals, different solutions based
on generative adversarial networks (GANs) have been proposed to generate physiological signals, such as
electrocardiograms (ECG) and photoplethysmograms (PPG). In this paper, we present a comparative study of
existing methods for ECG and PPG signal generation. The competing methods are evaluated on the MIT-BIH
arrhythmia and the PPG-BP datasets. Experimental results demonstrate the benefits of incorporating prior
knowledge in the generation process and the robustness of these methods for the synthesis of realisti c ECG
and PPG signals.
1 INTRODUCTION
Clinical referenc e tests such as electrocard iograms
(ECG) and photoplethysmograms (PPG) are
frequently used for continuous health m onitoring
(Lanza, 2007; Kamaruddin et a l., 2012; Song et al.,
2011; Ave et al., 2015). Since cardiovascular
diseases (CVDs) ar e reported to be the leading
causes of deaths worldwide (Deaton et al., 2011;
Mensah et al., 2019), several machine learning
methods have been proposed in recent years with
the aim of preventing, detecting, and classifying
CVDs. However, the performance of these solutions
is limited by the lack of the available annotated
training data. Medical data collectio n is challenging
either because of ethical issues and data privacy
laws or the limitations of acquirin g pathological
data during critical situations (i.e., strokes and
seizures). Therefore, several medical data generation
techniques have recently b een developed to addr ess
these issues. Generative Adversarial Ne tworks
(GANs) (Goodfellow et al., 2014) represent one
of the most e fficient solu tions for data synth e sis.
Over the past few years, GANs have proven their
ability to synthesize high -quality data in various
domains. The ir effects have mainly been observed in
the me dical field, such as physiolog ical time series
P
T
Q
S
R
(a)
Systolic Peak
Diastolic Peak
Pulse Wave Begin
Pulse Wave End
Dicrotic Notch
(b)
Figure 1: Illustration of ECG heartbeat (a) and PP G pulse
waves (b).
generation. Beyond realistic data generation, one
expected benefit of developing GAN-based methods
on p hysiological signals is to leverage synthetic data
for improving clinical applications, particularly in
cases of low-volume of datasets. In th is paper, we
condu c t a c omparative study of GAN-based methods
for physiologica l signal gener ation, namely ECG
and PPG, which play crucial roles in diagnosing
various cardiac diseases. ECG and PPG represent
the electrical and hemodynamic activity of the heart,
respectively. E ach signal has its specific waveform
and main fea tures. An ECG signal is a sequence of
cardiac cycles (i.e., heartbeats), where each cycle
is represented by a succession of waves. A typical
heartbeat consists of a P wave, a QRS co mplex, and a
Neifar, N., Ben-Hamadou, A., Mdhaffar, A., Jmaiel, M. and Freisleben, B.
A Comparative Study of GAN Methods for Physiological Signal Generation.
DOI: 10.5220/0011794200003411
In Proceedings of the 12th International Conference on Pattern Recognition Applications and Methods (ICPRAM 2023), pages 707-714
ISBN: 978-989-758-626-2; ISSN: 2184-4313
Copyright
c
2023 by SCITEPRESS – Science and Technology Publications, Lda. Under CC license (CC BY-NC-ND 4.0)
707
T wave, each defined by specific pattern (see Figure
1a), while PPG is a series of pulses where every pulse
is defined by two peaks (systolic and diastolic peaks)
and a dicrotic notch (see Figure 1b).
Most existing methods for ECG and PPG signal
generation (Wang et al., 2020; Hazra and By un,
2020; Kiyasseh et al., 2020) ar e based on usin g the
standard GAN architecture, which does not consider
the complex properties and dynamic nature of these
signals. However, recent attempts were proposed to
leve rage customiz e d prior knowledge about ECG and
PPG dynamics in the genera tion process to synthesize
more realistic data (Golany and Radinsky, 2019;
Golany et al., 2021; Kang et al., 2022).
In this paper, w e conduct a comparative
study by comparing the quality of the ge nerated
physiological signals and assessing the impact
of using existing da ta generation approaches in
improving th e performance o f baseline classification
approa c hes. The obtain ed results demonstrate that
augmen ting the trainin g data with synth etic data
systematically improves ECG arrhythm ia and PPG
hypertension classifications. In pa rticular, the
synthetic data generate d by the competing advanced
GAN-based methods can significantly enhance
the performance of the state-of-art classification
baselines compared to standard GAN architecture.
Furthermore, the various tested setups o n ECG and
PPG datasets show that ad vanced generation methods
can syn thesize realistic data even in the case of
relatively small datasets.
The remainder of this paper is organized as
follows. In Sec tion 2, we provide an overview of
GANs. We discuss the generation methods selected
for this comparison and the used datasets for their
training. In Section 3, we present the conducted
experiments and discuss our obtained results of this
compariso n. Section 4 summarizes our findings and
conclud es our paper with some suggestions fo r future
research.
2 METHODS AND MATERIALS
This section starts with a brief introduction to GANs.
Then, we introduc e the competing methods for
compariso n as well as the training datasets.
2.1 Generative Adversarial Networks
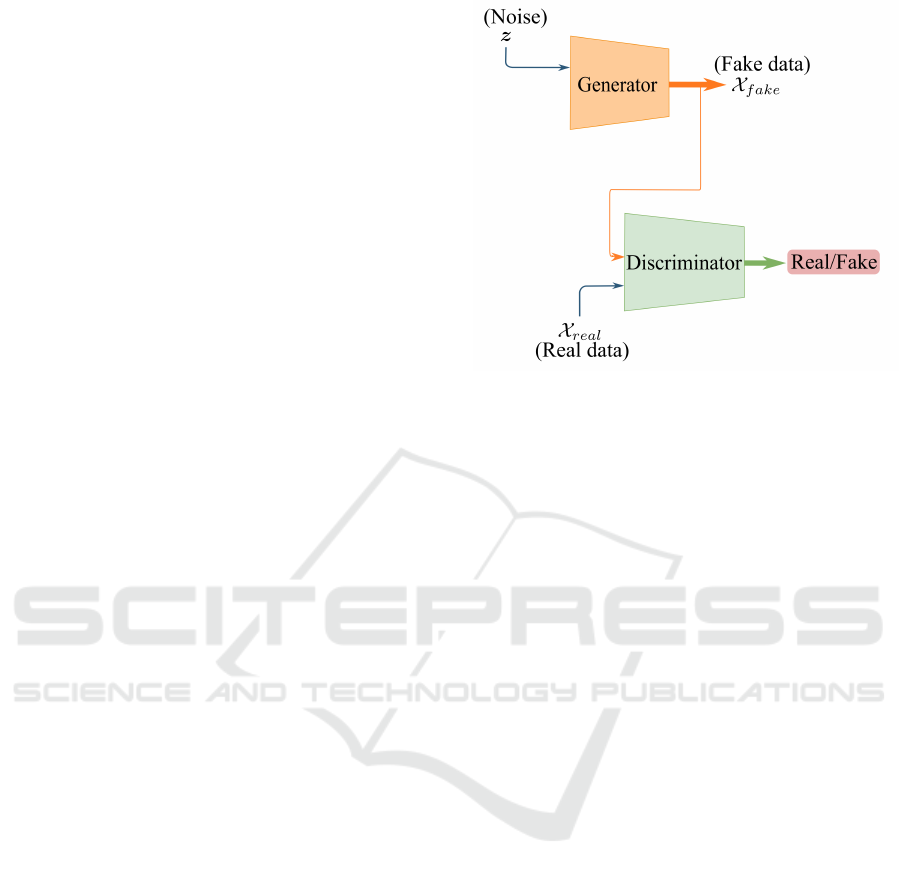
Generative Adversarial Networks (Goodfellow et al.,
2014) are made up of a pair of models called the
generato r and the discriminato r. Competing with its
adversary, the generative model tries to sy nthesize
Figure 2: Training architecture of generative adversarial
networks.
data similar to real data, while the discriminator learns
to determine whether a sample is from the generator
or f rom the tr a ining data (Figu re 2). The whole
framework correspond s to a two-player minima x
game, where the gene rator tries to minimize its loss
function and the discriminator tries to maximize its
loss function.
2.2 Methods
The majo rity of existing E CG and PPG signal
generation methods are based on the adaptation of
standard GAN arc hitectures (Wang et al., 2020; Hazra
and Byun, 2020; Kiyasseh et al. , 2020). Howeve r,
recent so lutions argue tha t due to the complexity of
ECG and PPG signals, their generation r emains a
challengin g task (Golany and Radinsky, 2019; Golany
et al., 2021; Kang et al., 2022). For this purpose,
advanced solutions have been proposed to incorporate
prior knowledge about ECG and PPG dynamics into
the generation networks.
We conside r three different methods in this
compara tive study. The first one is ba sed on standard
GAN architecture for reference (Goodfellow et al.,
2014). The second one (Neifar et al., 2022b) and the
third one (Neifar et al., 2022a) are recent approaches
that incorporate shape priors to the generation
networks. The architecture of the generator and the
discriminator networks in (Goodfellow et al., 2014) is
based on multilaye r p e rceptron layers. The generator
directly outputs the synthe tic signal from an input
noise vector.
Neifar et al. proposed to incorporate ECG shape
prior in the generation process by defining a number
of ECG shape clusters called anchors (Neifar et al.,
ICPRAM 2023 - 12th International Conference on Pattern Recognition Applications and Methods
708

2022b). T he gener ator is designed to only learn to
synthesize a ra nge of variations relative to anchors.
In this work, the authors also proposed disentanglin g
the temporal and a mplitude dynamics (i.e., variations)
of ECG signals leading to 1-D pattern dynamics
modeling.
Furthermore, Neifar et al. introduced leveraging
2-D statistical shape prior abou t the ECG signals
patterns into the generation process (Neifar et al.,
2022a ). The statistical shape modeling provides
prior knowledge about the global shape of ECG
signal clusters as well as the range of possible shape
variations inside a single ECG signal cluster. In
this way, the generator learns to generate a realistic
combination of variations relative to the average
shape obtained from a semantically similar ECG
signal set.
2.3 Datasets
2.3.1 MIT-BIH Arrhythmia Dataset
The MIT-BIH arrhyth mia dataset is the most
widely used dataset for arrhythmia detection and
classification. 48 h alf-hour ECG recordin gs from
patients who were examined at the BIH Arrhythmia
laboratory between 1975 a nd 1979 are included in this
dataset. Each recor d consists of two 30-minutes ECG
lead signals that have been digitally recorded at 360
samples per second and annotated by cardiologists.
The dataset contains over 100,000 heartbeats, most
of them are representing the normal class. Three
classes of heartbeats are typically considered for the
generation of ECG: the normal beats (class N), th e
premature ventricular co ntraction beats (class V), and
fusion beats (class F).
2.3.2 PPG-BP Dataset
The PPG-BP da ta set (Liang et al., 2018a) is widely
used for the no n-invasive detection of cardiovascular
disease. It contains 657 data segments from 219
patients with hypertension and/or diabetes aged from
8 to 22 years. The record s were sampled at a rate
of 1 kHz, and each patient record contains three
2.1-second PPG segments. This dataset provides
four diagnosis classes of hypertension including
normotension (N), prehyper te nsion (P), stage 1
hypertension (H1), and stage 2 hypertension ( H 2).
3 EXPERIMENTS AND RESULTS
Two types of experiments were performed to compare
the performance of the competing generation
methods. First, a quantitative evaluation is carried
out to assess the impact of adding synthetic signals to
the r e al tr aining sets on different baseline arrhythmia
and hypertension classifiers. On th e other hand,
a qualitative evaluation is carried out by visually
inspecting the g enerated signals for inc oherence and
artifacts.
3.1 Training Settings
Our evaluation is conducted following four settings
of training baseline classifiers for both ECG and PPG
signals. These different settings are a s follows:
Setting 1: the models are trained with only real
training set without any additional synthetic (i.e.,
generated) data.
Setting 2: the classification m odels are trained
using a comb ination of real data a nd synthe tic data
generated b y the standard GAN (Goodfellow et al.,
2014).
Setting 3: similar to setting 2, but the synthetic data
are generated by (Neifar e t al., 2022b).
Setting 4: similar to th e setting 3, but the synthetic
data are generated using (Neifar e t al., 2022a).
3.2 Quantitative Evaluation
Experiments were c onducted separately for ECG and
PPG signals.
3.2.1 Experiments on ECG Signals
In addition to comparin g the pe rforman ce of the
competing generation approa ches, we are particularly
interested in highlighting their gen eration ability in
the case of relatively small data volumes. To this end,
we propose two evaluation dataset setups built from
the MIT-BIH dataset:
• Setup 1: the entire MIT-BIH dataset (N, V ,and F
classes) is considered.
• Setup 2: a reduced MIT-BIH dataset is considered
where the nu mber of samples in the dataset is
down sampled to 10 %.
Classification Baselines: Before discussing
the experimental results, we present the used
classification baselines, In these experiments, four
classification baselines are used.
The classifier model introduced by Kachue e et al.
(Kachuee et al., 2018) includes a 1-D convolutional
layer, five residual convolution sets, two fully
connected (FC) layers and a softmax layer to output
A Comparative Study of GAN Methods for Physiological Signal Generation
709

Table 1: Performance of our classification baseline model
for ECG classification with the entire MIT-BIH (setup 1).
Accuracy Precision Recall F1 score
Setting 1 0.98 0.90 0.92 0.91
Setting 2 0.98 0.94 0.95 0.93
Setting 3 0.99 0.96 0.95 0.95
Setting 4 0.99 0.98 0.96 0.96
Table 2: Performance of (Kachuee et al., 2018) model for
ECG classification wi th the entire MIT-BIH (setup 1).
Accuracy Precision Recall F1 score
Setting 1 0.96 0.87 0.74 0.77
Setting 2 0.97 0.87 0.79 0.82
Setting 3 0.99 0.96 0.95 0.95
Setting 4 0.99 0.96 0.96 0.96
Table 3: Performance of (Kumar et al., 2019) model for
ECG classification wi th the entire MIT-BIH (setup 1).
Accuracy Precision Recall F1 score
Setting 1 0.98 0.87 0.82 0.84
Setting 2 0.98 0.93 0.91 0.92
Setting 3 0.98 0.96 0.94 0.95
Setting 4 0.99 0.97 0.95 0.96
Table 4: Performance of (Acharya et al., 2017) model for
ECG classification wi th the entire MIT-BIH (setup 1).
Accuracy Precision Recall F1 score
Setting 1 0.97 0.93 0.89 0.91
Setting 2 0.98 0.94 0.91 0.92
Setting 3 0.98 0.95 0.93 0.94
Setting 4 0.99 0.97 0.95 0.94
the class probabilities. In every residual block , two
1-D convolution layers, two ReLU activation layers,
a residual skip conn e ction, and finally a pooling layer
are used.
The architecture o f the mo del p roposed by
Acharya et al. (Ach arya et al., 2017) is made
up o f three 1-D convolution lay ers and three FC
layers. Each convolution layer is succeeded by a
max-pooling layer. A softmax function is applied to
the last output to generate classification scores.
Kumar et al. (Kumar et al., 2019) proposed
a classifier model composed of four blocks, each
contains a FC layer followed by both a batch
normalization layer and ReLU activation function. A
FC layer with a softmax activation function is used
after the last block.
In addition to these baselines, we propose
our classification model based on ResNet34 (He
et al., 2016) and transformer (Vaswani et al., 2017)
networks in which we ta ke advantage of transformer
Table 5: Performance of our classification baseline model
for ECG classification with the reduced MIT-BIH (setup 2).
Accuracy Precision Recall F1 score
Setting 1 0.67 0.75 0.72 0.59
Setting 2 0.88 0.84 0.90 0.84
Setting 3 0.98 0.98 0.99 0.98
Setting 4 0.99 0.99 0.99 0.99
Table 6: Performance of (Kachuee et al., 2018) model for
ECG classification wi th the reduced MIT-BIH (setup 2).
Accuracy Precision Recall F1 score
Setting 1 0.57 0.55 0.57 0.51
Setting 2 0.64 0.57 0.59 0.57
Setting 3 0.66 0.58 0.60 0.58
Setting 4 0.75 0.62 0.61 0.60
Table 7: Performance of (Kumar et al., 2019) model for
ECG classification wi th the reduced MIT-BIH (setup 2).
Accuracy Precision Recall F1 score
Setting 1 0.62 0.58 0.61 0.57
Setting 2 0.73 0.78 0.78 0.72
Setting 3 0.93 0.88 0.95 0.90
Setting 4 0.97 0.98 0.98 0.97
Table 8: Performance of (Acharya et al., 2017) model for
ECG classification wi th the reduced MIT-BIH (setup 2).
Accuracy Precision Recall F1 score
Setting 1 0.56 0.74 0.64 0.46
Setting 2 0.79 0.79 0.83 0.74
Setting 3 0.98 0.98 0.96 0.97
Setting 4 0.98 0.99 0.97 0.97
benefits to capture the temporal information present in
the signals. In this model, extracted features from the
ResNet blo cks are passed to the transfo rmer encoder
before being finally fed to the classification layer.
Results. Tables 1, 2, 3, and 4 show the performance
metrics of the four state-of-art classification methods
for dataset setup 1 (i.e., the entire MIT-BIH) in
the different training settings described above.
We can observe that adding synthetic heartbeats
from generative models definitely improves the
classification performance for all generation
approa c hes. In particular, the performanc e of
classifiers in settings 3 and 4 is superior to classifiers
performance in setting 2. We can confirm so that
leve raging shape prior in the advanced generation
approa c hes (i.e., training settings 3 and 4) has a
significant impact on the quality of the generated
data. For example, Acharya et al. (Acharya et al.,
ICPRAM 2023 - 12th International Conference on Pattern Recognition Applications and Methods
710

Table 9: Performance of our classification baseline model
for PPG 3 classes classification (setup 1).
Accuracy Precision Recall F1 score
Setting 1 0.42 0.42 0.39 0.39
Setting 2 0.46 0.45 0.46 0.45
Setting 3 0.49 0.51 0.46 0.47
Setting 4 0.53 0.54 0.50 0.50
Table 10: Performance of ( Wang et al., 2017) model for
PPG 3 cl asses classification (setup 1).
Accuracy Precision Recall F1 score
Setting 1 0.37 0.25 0.41 0.31
Setting 2 0.40 0.39 0.42 0.38
Setting 3 0.45 0.47 0.44 0.39
Setting 4 0.46 0.50 0.45 0.40
Table 11: Performance of (Liu et al., 2020) model for PPG
3 classes classificati on (setup 1).
Accuracy Precision Recall F1 score
Setting 1 0.35 0.23 0.30 0.26
Setting 2 0.40 0.41 0.37 0.37
Setting 3 0.44 0.44 0.45 0.44
Setting 4 0.46 0.45 0.47 0.46
2017) achieve (Accu racy, Recall, Precision, F1 score)
= (0.98, 0. 95,0.93, and 0.94) and (0.99, 0.97, 0.95,
and 0.94) in training settings 3 and 4, respectively vs.
(0.98, 0.94, 0.91, and 0.92) in settin g 2. The obtained
results also sh ow that the classification performance
of all classifiers in setting 4 were slightly higher
than in setting 3, where synthetic data from Neifar
et al. (Neifar et al., 2022b) were used for additional
training, which demonstrates that Neifar et al..’s
approa c h (Neifar et al., 2022a) is more efficient than
Neifar et al.’s (Neifar et al., 2022b) in generating
more realistic ECG heartbeats.
The performance results of the classifiers models
for dataset setup 2 (i.e., reduced MIT-BIH) are
shown in Tables 5, 6, 7, and 8. The o btained results
demonstra te that augmenting the real training set
with g e nerated heartbe ats obtain ed from (Goodfellow
et al., 2014; Neifar et al., 2022b; Neifar et al., 2022a)
trained with small a volume dataset has improved
the classifiers’ performance. In particular, classifiers
trained with added synthetic ECG heartbeats
generated by the advanced GAN approa ches (Neifar
et al., 2022b; Neifar et al., 2022a) ou tperform the
standard GAN.
3.2.2 Experiments on PPG Signals
For PPG experiments, different dataset setups were
used in comparison to the ECG experiments because
Table 12: Performance of our classification baseline model
for PPG 2 classes classification (setup 2).
Accuracy Precision Recall F1 score
Setting 1 0.64 0.58 0.60 0.58
Setting 2 0.65 0.60 0.64 0.60
Setting 3 0.75 0.66 0.66 0.66
Setting 4 0.79 0.71 0.66 0.66
Table 13: Performance of ( Wang et al., 2017) model for
PPG 2 cl asses classification (setup2).
Accuracy Precision Recall F1 score
Setting 1 0.57 0.56 0.54 0.53
Setting 2 0.63 0.56 0.57 0.55
Setting 3 0.64 0.57 0.58 0.56
Setting 4 0.64 0.57 0.59 0.57
Table 14: Performance of (Liu et al., 2020) model for PPG
2 classes classificati on (setup 2).
Accuracy Precision Recall F1 score
Setting 1 0.56 0.56 0.59 0.53
Setting 2 0.61 0.57 0.60 0.56
Setting 3 0.62 0.59 0.62 0.57
Setting 4 0.66 0.59 0.62 0.59
the PPG-BP dataset has a relatively small data
volume. However, following the state of the art
methods (Liang et al., 2018b; Sannino et al., 2020),
we defined two data set setups for hypertension
classification:
• Setup 1: three classes classification, where the
class H1 and H2 are consider ed as one class.
• Setup 2: two classes classification, where the
classes (H1 and H2) and (N and P) are considered
as one class, respectively.
Classification Baselines: Three classification
baselines were used in these experiments. Liu et
al. (Liu et al., 2020) used a classifier based on the
traditional VGG19 model (Simonyan and Zisserman,
2014) with a unique on e change in the last FC output
layer. Th e time series classification model proposed
by Wang et al. (Wang et al., 2017) is c omposed
of three FC layers with the ReLU activation, each
followed by a dropout layer. Th e final layer is a FC
with softmax function.
We also tested our classification approach,
previously used for ECG signals, as a com peting
method for PPG signals classification.
Results: Tables (9, 10, 11) an d ( 12, 13, 14)
summarize the obtained performance values for PPG
A Comparative Study of GAN Methods for Physiological Signal Generation
711
(a)
0 5 0 1 00 15 0 2 00 25 0
0.1
0.0
0.1
0.2
Class N
Class V
Class F
0 5 0 1 00 15 0 2 00 25 0
0.05
0.00
0.05
0.10
0.15
0 5 0 1 00 15 0 2 0 0 25 0
0.0
0.1
0.2
-
(b)
0 50 1 0 0 1 5 0 2 0 0 25 0
0.0
0.1
0.2
0.3
0 50 1 0 0 1 5 0 2 0 0 25 0
0.0
0.1
0.2
0 50 1 0 0 1 5 0 2 0 0 25 0
0.00
0.05
0.10
0.15
0.20
Class N
Class V
Class F
(c)
0 50 1 00 1 50 2 00 2 50
0.0
0.1
0.2
0.3
0 50 1 00 1 50 2 00 2 50
0.0
0.1
0.2
0 50 1 00 1 50 2 00 2 50
0.00
0.05
0.10
0.15
0.20
Class N
Class V
Class F
(d)
0 50 1 0 0 1 5 0 2 0 0 25 0
0.0
0.1
0.2
0 50 1 0 0 1 5 0 2 0 0 25 0
0.0
0.1
0.2
0 50 1 0 0 1 5 0 2 0 0 25 0
0.1
0.0
0.1
0.2
0.3
Class N
Class V
Class F
-
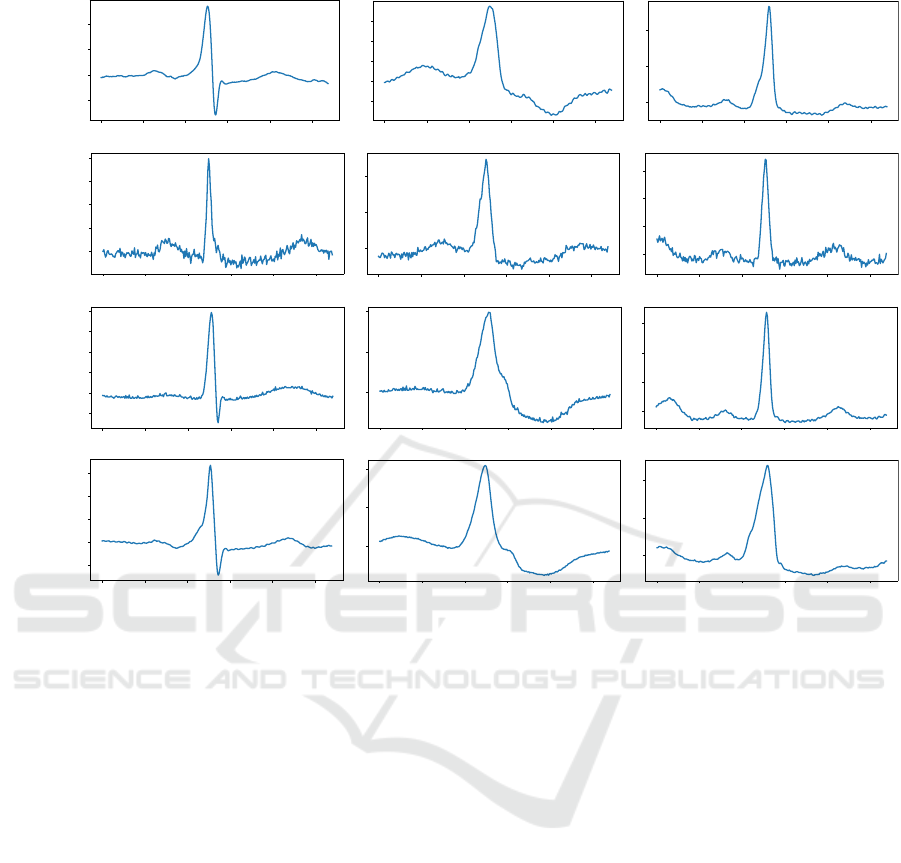
Figure 3: (a) Examples of real heartbeats from the classes (N, V, and F) taken from the training dataset. (b) Examples of
synthetic heartbeats from the classes (N, V, and F) generated by the standard GAN (Goodfellow et al., 2014). (c) Examples of
synthetic heartbeats from the classes (N, V, and F) generated by (Neifar et al., 2022b). (d) Examples of synthetic heartbeats
from the t he classes (N, V, and F) generated by ( N ei far et al., 2022a).
classification for dataset setups 1 and 2, respectively.
It is obvious that the pe rforman ce of the three baseline
classifiers in the training settings, where the training
dataset is augme nted by synthetic data, is higher tha n
setting 1. I n particular, the performance has been
improved with additional synthetic data generated
by (Neifar et al., 2022b; Neifar et al. , 2022a).
For example, our classification baseline ac hieves for
dataset setup 1 (Accuracy, Recall, Precision, F1
score) = (0.49, 0.51, 0.46, and 0.47) and (0.53,
0.54, 0.50, and 0.5 0) in training settings 3 and 4,
respectively vs (0.46, 0.45, 0.46, an d 0.45) in train ing
setting 2. On the other hand, for dataset setup 2, it
achieves (Accuracy, Recall, Precision, F1 score) =
(0.75, 0.66, 0.66, and 0.66) and (0.79,0.71, 0. 66, a nd
0.66) in setting 3 and 4 ,respectively vs. (0.65, 0.60,
0.64, and 0.60) in setting 2.
Neifar et al. (Neifar et al., 2022b), (Neifar
et al., 20 22b) have clearly demonstrated robustness
in generating realistic PPG signals, resulting in
better classification performance even in low-volume
datasets. The results also show an imp rovement of
the performance be tween the training settings 3 and
4. For instance, the accuracy of Wang et al. (Wang
et al., 2017) ha s in creased by 2% for dataset setup
1 a nd 4% for dataset setup 2. This confirms that
the advanced ge neration method based on modeling
the temporal and amplitude variations as 2-D shapes
is more efficient in dealing with the complicated
dynamics of ECG and PPG patterns.
3.3 Qualitative Evaluation
Figure 3 shows examples of real heartbeats and
synthetic heartbeats generated by the three studied
generation approaches from classes N, V and F,
respectively. We can observe that the heartbea ts
generated by Ne ifar et al. (Ne ifar et al., 2022a)
(Figure 3d) and Neifar et al. (Neifar et al., 2022b)
(Figure 3c) maintain realistic shap e s similar to real
heartbeats (Figure 3a). The synthetic heartbeats
obtained by the standard GAN (Figures 3b), on
the other hand, do not always follow the full ECG
morphology. We can also notice that the h eartbeats
generated b y the standard GAN (Goodfellow et al.,
2014) contains significantly m ore artifacts. O n the
ICPRAM 2023 - 12th International Conference on Pattern Recognition Applications and Methods
712
(a)
0 20 0 40 0 60 0
0.00
0.25
0.50
0.75
Class N
0 20 0 40 0 60 0
0.00
0.25
0.50
0.75
Class H1
0 20 0 40 0 60 0
0.5
1.0
Class H2
0 20 0 40 0 60 0
0.25
0.50
0.75
1.00
Class P
(b)
0 20 0 40 0 60 0
0.0
0.5
1.0
Class N
0 20 0 40 0 60 0
0.0
0.5
0 20 0 40 0 60 0
0.0
0.5
1.0
Class H2
0 20 0 40 0 60 0
0.25
0.50
0.75
1.00
Class H1
Class P
(c)
0 200 400 600
0.00
0.25
0.50
0.75
1.00
Class N
0 200 400 600
0.2
0.4
0.6
0.8
0 200 400 600
0.4
0.6
0.8
1.0
Class H2
0 200 400 600
0.2
0.4
0.6
0.8
1.0
Class H1
Class P
(d)
0 2 00 4 0 0 60 0
0.5
1.0
Class
0 2 00 4 0 0 60 0
0.5
1.0
Class H1
0 2 00 4 0 0 60 0
0.0
0.5
1.0
Class H2
0 2 00 4 0 0 60 0
0.25
0.50
0. 5
1.00
Class P
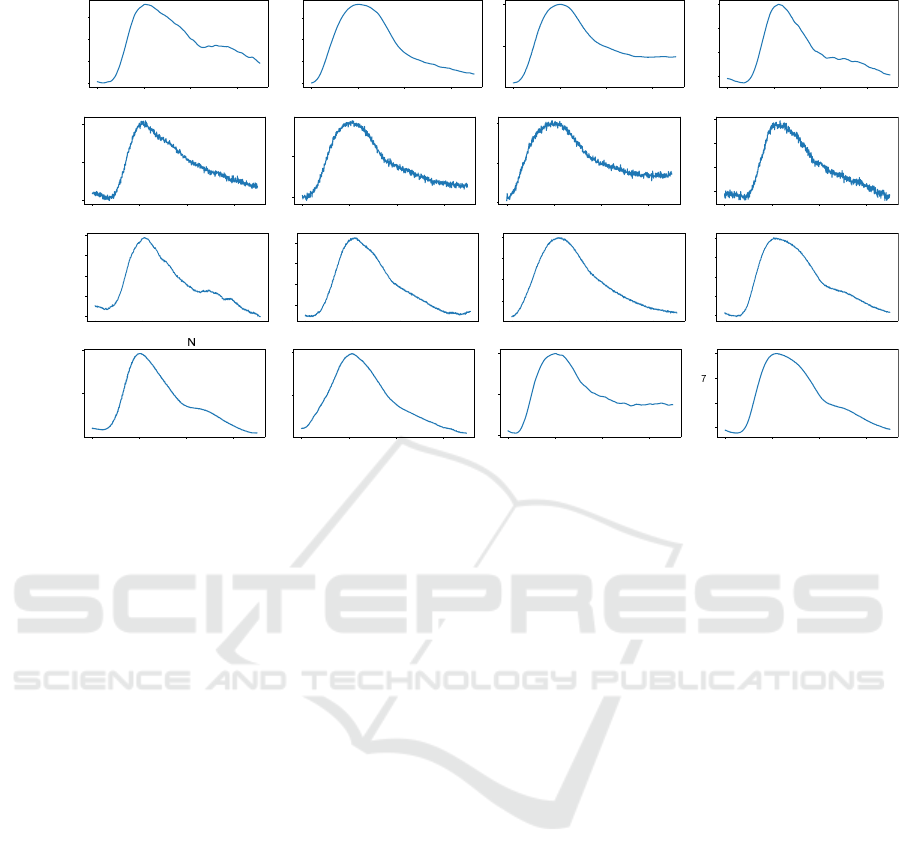
Figure 4: (a) Examples of real PPG pulses from the classes (N, H1, H2, P) taken from the training dataset. (b) Examples of
synthetic PPG pulses from the classes (N, H1, H2, P) generated by the standard GAN. (c) Examples of synthetic PPG pulses
from the classes (N, H1, H2, P) generated by (Neifar et al., 2022b). (d) Examples of synthetic PPG pulses from the classes
(N, H1, H2, P) generated by (Neifar et al., 2022a).
other hand, the gener ated heartbeats by Neifar et al.
(Neifar e t al., 2022b) a re slightly noisy than the real
and synthesized heartbeats obtained by Neifar et al.
(Neifar et al. , 2022a).
Figure 4 depicts examples of real pulses and
synthetic pulses ob ta ined by the three studied
generation approaches from classes (N, H1, H2, and
P). As ECG heartbeats, the PPG pulses generated
by the approach of Neifar et al. (Neifar et al.,
2022a ) (Figure 4d) and gene rated by the approach
of Neifar et al. (Ne ifar et al. , 2022b) (Figure 4c)
maintain also realistic morphology. For example,
the generated pu lses from normal class in Figures 4 c
and 4 d contain the total waves: the systolic peak,
the diastolic peak, and the dicro tic notch. For the
synthetic PPG pulse of the normal class in Figure 4b
obtained from the standard GAN, the morphology is
not comp le te , where the diastolic peak has not been
respected.
4 CONCLUSION
We presented a compa rison of th ree GAN-based
methods for generating ECG and PPG signals.
The obtained results demonstrated that augmenting
the training data with synthetic data systematically
improves ECG arrhythmia and PPG hypertension
classifications. In particular, the synthe tic data
generated by the competin g advanced GAN-based
methods significantly enhanced the performance of
the state-of-art classification baselines compared to
standard GAN architecture. Furthermore, the various
tested setups on ECG and PPG datasets demonstrated
that advanced generation methods can synthesize
realistic data even in the case of relatively small
datasets. We propose three axes of exten sio n of this
study as future work. We intend to expand the study
to include other competing generation methods. We
would like to cover more physiolo gical signal types
and represen ta tions.
ACKNOWLEDGEMENTS
This work is supported by the German Academic
Exchange Service (DAAD) (Transformation
Partnership: Theralytics Project)
REFERENCES
Acharya, U. R., Oh, S. L., Hagiwara, Y., Tan, J. H. ,
Adam, M., Gertych, A., and San Tan, R. (2017). A
deep convolutional neural network model to classify
heartbeats. Computers in biology and medicine,
89:389–396.
Ave, A., Fauzan, H., Adhitya, S. R., and Zakaria, H.
A Comparative Study of GAN Methods for Physiological Signal Generation
713

(2015). Early detection of cardiovascular disease
with photoplethysmogram (ppg) sensor. In 2015
International Conference on Electrical E ngineering
and Informatics (ICEEI), pages 676–681. IEEE.
Deaton, C., Froelicher, E. S., Wu, L. H., Ho, C., Shishani,
K., and Jaarsma, T. (2011). The global burden
of cardiovascular disease. European Journal of
Cardiovascular Nursing, 10(2
suppl):S5–S13.
Golany, T., Freedman, D., and Radinsky, K. (2021). ECG
ODE-GAN: Learning ordinary differential equations
of ECG dynamics via generative adversarial learning.
Proceedings of the AAAI Conference on Artificial
Intelligence, 35:134–141.
Golany, T. and Radinsky, K. (2019). PGANs: Personalized
generative adversarial networks for ecg synthesis
to improve patient-specific deep ECG classificati on.
Proceedings of the AAAI Conference on Artificial
Intelligence, 33(01):557–564.
Goodfellow, I., Pouget - A badie, J., Mirza, M., Xu, B.,
Warde-Farley, D., Ozair, S., Courville, A., and
Bengio, Y. (2014). Generative adversarial nets.
Advances in neural information processing systems,
27:2672–2680.
Hazra, D. and Byun, Y.-C. (2020). SynSigGAN: Generative
adversarial networks for synthetic biomedical signal
generation. Biology, 9(12):441.
He, K., Zhang, X. , Ren, S ., and Sun, J. (2016).
Deep residual learning for image recognition. In
Proceedings of the I EEE conference on computer
vision and pattern recognition, pages 770–778.
Kachuee, M., Fazeli, S., and Sarrafzadeh, M. (2018).
Ecg heartbeat classification: A deep transferable
representation. In 2018 IEEE International
Conference on Healthcare Informatics (ICHI),
pages 443–444, New York, United States. IEEE.
Kamaruddin, N. H., Murugappan, M., and Omar,
M. I. (2012). Early prediction of cardiovascular
diseases using ecg signal: Review. In 2012 IEEE
Student Conference on Research and Development
(SCOReD), pages 48–53.
Kang, P., Jiang, S., and Shull, P. B. (2022). Synthetic
emg based on adversarial style transfer can effectively
attack biometric-based personal identification models.
bioRxiv.
Kiyasseh, D., Tadesse, G. A., Nhan, L. N. T., Van Tan,
L., Thwaites, L., Zhu, T., and Clifton, D. (2020).
Plethaugment: Gan-based ppg augmentation for
medical diagnosis in low-resource settings. IEEE
Journal of Biomedical and Health Informatics,
24(11):3226–3235.
Kumar, G., Pawar, U., and O’Reilly, R. (2019). Ar r hythmia
detection in ecg signals using a multilayer perceptron
network. In The 27th Irish Conference on Artificial
Intelligence and Cognitive Science, pages 353–364,
Galway, Ireland. AICS.
Lanza, G. A. (2007). The electrocardiogram as a prognostic
tool for predicting major cardiac events. Progress in
cardiovascular diseases, 50(2):87–111.
Liang, Y., Chen, Z., Liu, G., and Elgendi, M. (2018a). A
new, short-recorded photoplethysmogram dataset for
blood pressure monitoring in china. Scientific data,
5(1):1–7.
Liang, Y., Chen, Z., Ward, R., and Elgendi, M.
(2018b). Hypertension assessment using
photoplethysmography: a risk stratification approach.
Journal of clinical medicine, 8(1):12.
Liu, S.-H., Li, R.-X., Wang, J.-J., Chen, W., and Su, C.-H.
(2020). Classification of photoplethysmographic
signal quality with deep convolution neural networks
for accurate measurement of cardiac stroke volume.
Applied Sciences, 10.
Mensah, G. A., Roth, G. A., and Fuster, V. (2019). The
global burden of cardiovascular diseases and risk
factors: 2020 and beyond.
Neifar, N., Ben-Hamadou, A., Mdhaffar, A., Jmaiel, M.,
and Freisleben, B. (2022a). Leveraging stati stical
shape priors i n gan-based ecg synthesis. arXiv
preprint arXiv:2211.02626.
Neifar, N., Mdhaffar, A., Ben-Hamadou, A., Jmaiel,
M., and Freisleben, B. (2022b). Disentangling
temporal and amplitude variati ons in ecg synthesis
using anchor ed gans. In The 37th ACM/SIGAPP
Symposium on Applied Computing, pages 645—-652,
New York, USA. ACM.
Sannino, G., De Falco, I., and De Pietro, G. (2020).
Non-invasive risk stratification of hypertension:
a systematic comparison of machine learning
algorithms. Journal of Sensor and Actuator N et works,
9(3):34.
Simonyan, K. and Zisserman, A. (2014). Very
deep convolutional networ ks for large-scale image
recognition. arXiv preprint arXiv:1409.1556.
Song, J.-M., Jin, G.-H., Seo, S.-B., Park, J.-S., Lee, S.-B.,
and Ryu, K.-H. (2011). Design and implementation of
a prediction system for cardiovascular diseases using
ppg. Journal of the Korean Society of Radiology,
5(1):19–25.
Vaswani, A., Shazeer, N., Parmar, N., Uszkoreit, J., Jones,
L., Gomez, A. N., Kaiser, L. u., and Polosukhin,
I. (2017). Attention is all you need. In Guyon,
I., Luxburg, U. V., Bengio, S. , Wallach, H., Fergus,
R., Vishwanathan, S., and Garnett, R. , editors,
Advances i n Neural Information Processing Systems,
volume 30. C urran Associates, Inc.
Wang, H. , Ge, Z., and Wang, Z. (2020). Accurate ECG
data generation with a simple generative adversarial
network. In Journal of Physics: Conference Series,
volume 1631, page 012073. IOP Publishing.
Wang, Z., Yan, W., and Oates, T. (2017). Time
series classification from scratch with deep neural
networks: A strong baseline. In 2017 International
joint conference on neural networks (IJCNN), pages
1578–1585. IEEE.
ICPRAM 2023 - 12th International Conference on Pattern Recognition Applications and Methods
714
