
How Different Elements of Audio Affect the Word Error Rate of
Transcripts in Automated Medical Reporting
Emma Kwint, Anna Zoet, Katsiaryna Labunets
a
and Sjaak Brinkkemper
b
Department of Information and Computing Sciences, Utrecht University, Princetonplein 5, Utrecht, The Netherlands
Keywords:
Speech Recognition, Automated Speech Recognition Software, Automated Medical Reporting, Word Error
Rate.
Abstract:
Automated Speech Recognition software is implemented in different fields. One of them is healthcare in
which it can be used for automated medical reporting, the field of focus of this research. For the first step of
automated medical reporting, audio files of consultations need to be transcribed. This research contributes to
the investigation of the optimization of the generated transcriptions, focusing on categorizing audio files on
specific characteristics before analyzing them. The literature research within this study shows that specific
elements of speech signals and audio, such as accent, voice frequency and noise, can have influence on the
quality of a transcription an Automated Speech Recognition system carries out. By analyzing existing medical
audio data and conducting an pilot experiment, the influence of those elements is established. This is done by
calculating the Word Error Rate of the transcriptions, a useful percentage that shows the accuracy. Results of
the analysis of the existing data show that noise is an element that carries out significant differences. However
the data of the experiment did not show significant differences. This was mainly due to having not enough
participants to reason with significance. Further research into the effect of noise, language and different
Automated Speech Recognition technologies should be done based on the outcomes of this research.
1 INTRODUCTION
Nowadays, audio-based speech recognition systems
are implemented in many types of smartphones and
other devices. These recognition systems convert spo-
ken language into written text. When used in settings
such as healthcare, this kind of software could be use-
ful to ease the process of creating reports of consulta-
tions. The administrative tasks take over 100.000 full-
time positions and cost over five billion euros per year
in the Netherlands alone (Maas et al., 2020). This
calls for a solution to lower this burden in the health-
care sector and allow medical professionals to spend
more of their time on patients.
One proposed solution is Care2Report, a combi-
nation of hardware and software that makes use of
multi-sensory input to translate and interpret infor-
mation. This is done in such a way that allows the
care provider and patient to interact without the ad-
ministrative burden a consultation creates. One of the
sensory inputs is speech. This is translated through
a
https://orcid.org/0000-0003-0884-2440
b
https://orcid.org/0000-0002-2977-8911
Speech Recognition software into a formal represen-
tation of a medical report (Maas et al., 2020). How-
ever, the output of such Automated Speech Recog-
nition (ASR) software can be corrupted, which de-
creases the accuracy of the translation.
In other words, ASR can come with certain dif-
ficulties. Machine learning techniques interpret the
software’s inputs, for example using (hidden) Markov
Models. This is a machine learning technique that
classifies input, trained on a set of data that updates
the performance of the Markov Model (Fung and Kat,
1999). It is then tested on another set of data to finally
determine the goodness of fit of the technique. In this
case this means that the final speech input would be
correctly transcribed. Taking all elements of speech
and audio files into account that can have an impact
on the outcome of the ASR software is cumbersome.
For example, patients can slur words or have a heavy
accent, that is not or hardly picked up by the software.
Furthermore, the distance to the microphone could
be too grand, which is why certain sounds are not
picked up on, or why too much external noise might
be recorded. Such elements can impact the accuracy
of the error rate of the transcription that is given as an
Kwint, E., Zoet, A., Labunets, K. and Brinkkemper, S.
How Different Elements of Audio Affect the Word Error Rate of Transcripts in Automated Medical Reporting.
DOI: 10.5220/0011794100003414
In Proceedings of the 16th International Joint Conference on Biomedical Engineering Systems and Technologies (BIOSTEC 2023) - Volume 5: HEALTHINF, pages 179-187
ISBN: 978-989-758-631-6; ISSN: 2184-4305
Copyright
c
2023 by SCITEPRESS – Science and Technology Publications, Lda. Under CC license (CC BY-NC-ND 4.0)
179

output.
A research into the elements of speech and audio
that might impact this rate has been performed. This
has been done by the application of a mixed-method
approach. First, a literature research has been carried
out. This is described in Section 3. Furthermore, a
data set consisting of audio files and transcripts has
been analyzed. These have been checked for errors
and were labeled with speech or audio elements that
were come across during the literature research. This
can be found in Section 4. The next step entailed the
computation of the Word Error Rate of every file in
the data set and then comparing these to each other.
The results are described in Section 5.
2 BACKGROUND
As was already briefly mentioned in Section 1,
Care2Report facilitates automated healthcare report-
ing using speech recognition technology and action
recognition technology in combination with language
tools. This way they record and summarize the in-
teraction between the healthcare worker and the pa-
tient in order to minimize administrative work (Maas
et al., 2020). To automatically create a medical report
of a medical consultation, domain ontology learning
and ontological conversation interpretation are com-
bined, as can be seen in Figure 1. This domain ontol-
ogy learning is used for the semantic interpretation
of the conversation between the healthcare worker
and patient. By combining medical guidelines and a
medical glossary, SNOMED CT, the statements of a
patient are translated into defined medical concepts.
Ontological conversation interpretation consists of 4
steps of which the first one is the most important for
this research. The ontological conversation interpre-
tation starts with consultation transcription, in which
the audio file of the consultation is converted into
written text utilizing Automated Speech Recognition
software. As this is step results in a transcript of a
medical consultation, it is extremely important that
this transcription is close to perfect. That is what this
this study shows too. Within this research, even short
spoken sentences such as ’I have a neck pain when I
sit in-front of my laptop’ are transcribed as ’I have a
big thing when I sing in front of my laptop’. Besides,
’My heart is beating fast and it scares me’ was tran-
scribed as ’My heart is bleeding ... ’. Crucial parts
of conversation for medical reports are substituted or
deleted in these two examples. The relevance of op-
timizing this transcription process becomes clear. To
optimize the transcription process, one may look at
the software that is used, because these ASR systems
Figure 1: Care2Report ontological conversation interpreta-
tion (ElAssy et al., 2022).
are far from optimally accurate now. However, the
audio file resulting from a recorded medical consul-
tation and used by the ASR systems, can maybe be
optimized as well. The focus of this study can thus be
placed before consultation transcription in Figure 1,
out of the scope of the Care2Report project described
in the paper of Elassy et al. (ElAssy et al., 2022).
When going back in time, TRACE was one of
the first computational models of spoken-word recog-
nition. It is the pioneer of matching multiple word
candidates to speech input. Weber and Scharenborg
(2012) mention that on hearing the word sun, TRACE
would then also consider under and run, for exam-
ple. The best match between the speech input and the
utterances known to the machine is eventually cho-
sen and transcribed (Weber and Scharenborg, 2012).
This means that the probability of occurrence of the
so-called invariance problem would then be mini-
mized. This problem entails the possibility of speech
input being disrupted, because sounds might be re-
duced, deleted, inserted or even substituted (Scharen-
borg et al., 2005). Besides making sure the language
model on which the speech recognizer is based is op-
timized for understanding its input, there is another
manner in which the recognizer’s performance can be
measured (Wang et al., 2003).
2.1 Defining a Research Question
Namely the Word Error Rate (WER), which is an
error metric that is widely used to determine a ma-
chine’s accuracy in ASR. It measures the amount of
words that differ from hypothesis and result. Four sit-
uations are possible (Evermann, 1999):
• The word in the transcript is the same as in the
hypothesis: the word is correct;
• The word in the hypothesis is substituted with an-
other word that should not be in the transcript;
• A word has been inserted that was not in the hy-
pothesis;
• A word has been deleted in its entirety, which was
in the hypothesis.
HEALTHINF 2023 - 16th International Conference on Health Informatics
180

The WER is calculated by the division of the num-
ber of word errors by the total reference words. How-
ever, it should be noted that the WER treats every er-
ror with the same weight. This means that every er-
ror is treated equally, even though some mistakes are
graver than others (Evermann, 1999). This is why
we would like to look into mistakes that are made
and see which elements seem to have the biggest im-
pact. When possibly improving these elements and
preventing such errors to happen as frequently, the
WER could be decreased. This has lead to the fol-
lowing main research question:
What elements of speech and audio affect the
Word Error Rate of the transcripts of audio
files the most in Automated Speech Recogni-
tion Software?
To answer this research question, it is important to
look into two factors. First of all, literature will pro-
vide insight into the existing elements of speech and
audio. When these have been researched extensively,
a connection can be made to the WER. However, it
should first be clear what an acceptable WER would
be and how this can be achieved, before possible so-
lutions to decrease this rate can be proposed. This is
why the following questions will be answered primar-
ily; a) what would be an acceptable Word Error Rate,
b) what are the elements of speech that are impor-
tant for Automated Speech Recognition and c) what
are the elements of audio that are important for Auto-
mated Speech Recognition.
3 LITERATURE RESEARCH
This Section gives an extensive overview of ASR soft-
ware and its accuracy, based on elements of speech
and audio. First, a definition of Automated Speech
Recognition is given, as well as a superficial expla-
nation of its functionality. Then, it is compared with
Human Speech Recognition and resulting Word Er-
ror Rate. Furthermore, the accuracy of the WER is
explained, after which the various speech and audio
elements are elaborated upon separately.
3.1 Automated Speech Recognition
Technologies
The goal of speech recognition is for a machine to
be able to ’hear’, ’understand’ and ’act upon’ spoken
information (Gaikwad et al., 2010). A speech rec-
ognizer attempts to fulfill its goal by matching input
with known data, such as (expected) words or sen-
tences (Kotelly, 2003).
Nowadays, this speech recognition technology is
a very common feature of smartphones and thus be-
coming widely available (Moore and Cutler, 2001).
This is called small vocabulary voice command-and-
control, which can be used for everyday tasks, such as
searching the web or setting a timer. However, speech
recognizers designed specifically for sectors - such as
healthcare - need to be able to create a more accu-
rate transcription using the correct terminology. In
other words, ASR that is used for such specific tasks
should be fully developed before being put into prac-
tice. Therefore, a lot of research has been done to
determine whether ASR could perform as greatly as
human speech recognition can.
3.2 Human Speech Recognition Versus
Automated Speech Recognition
Human Speech Recognition (HSR) focuses on under-
standing how listeners recognize words that are spo-
ken. This is mainly done by computational models
that simulate and explain data related to the recogni-
tion of words (Scharenborg, 2007). ASR, on the other
hand, researches the building of algorithms that rec-
ognize these utterances automatically, whilst taking
many contexts into account and trying to achieve an as
accurate transcript as possible (Scharenborg, 2007).
ASR is said to be an end-to-end system, whereas HSR
only focuses on the human speech process. Humans
are able to recognize spoken nonsense, even when
little grammatical information is given (Lippmann,
1997). Lippmann (1997) states that speech recogniz-
ers still lack performance in comparison to humans,
even when spontaneous, noisy or quietly read speech
is compared (Lippmann, 1997).
ASR models can recognize speech, but offer lit-
tle when looking at human behavior. A study by
Scharenborg et al. (2005) shows promising results.
Their investigation has proven that the parallels be-
tween HSR and ASR are not as grand as was ex-
pected. Even though ASR makes use of techniques,
such as dynamic programming (DP) and preprocess-
ing, while HSR drives on human lexical capacity and
auditory perception, the two are more connected than
inititally thought (Scharenborg et al., 2005). These
results have not only lead to a new, computational
speech recognition model, but also shows improve-
ment in the models or tools used might lead to a closer
resemblance of ASR to HSR. In other words, these
results might indicate that a resembling performance
between the two fields is indeed possible.
How Different Elements of Audio Affect the Word Error Rate of Transcripts in Automated Medical Reporting
181

3.3 Word Error Rate
To increase the resemblance between these two fields,
one goal is to decrease the WER. As has been stated
in Section 2.1, the resulting transcription is compared
to the hypothesis to determine the WER, which gives
an indication of the speech recognizer’s performance.
This indication is a percentage resembling the error
rate of transcribed words that have not been recog-
nized or wrongly classified. But from what rate would
a performance be considered acceptable?
The transcription error rate is less than 4% for
recorded conversations over the phone between hu-
man listeners, according to R.P. Lippmann (1997)
(Lippmann, 1997). However, human listeners are able
to achieve an error rate of 1.6% during normal face-
to-face conversations. With an WER of around 9%,
Automated Speech Recognition software could still
be improved and peak performance seems yet to be
achieved.
3.4 Accuracy of Word Error Rate
As has been explained, there are four states a word
can be in, regarding the word error rate. Vilar et al.
(2006) state that of all input errors, substitutions are
responsible for more than half (54.7%) (Vilar et al.,
2006). Deleted words take up a quarter of the to-
tal amount of errors (25%) and insertions a little less
(23%). Deletion or insertion errors are not as impact-
ful as substitution errors might be, since those types of
mistakes would not necessarily change the semantics
of a sentence. However, substitution errors could al-
ter the context, which might lead to confusion or even
drastic mistakes.
3.5 Elements That Affect Accuracy of
WER
An average of 9% WER still seems to be too high
and is therefore worth researching whether it could
be reduced. However, it is necessary to find out what
kind or errors are made and how these can possibly
be prevented. There are certain elements that affect
the accuracy of the WER more than others. In this
Section, first, elements having an effect on speech
will be elaborated upon. Then, the elements of audio
files that might impact the WER of ASR software are
described.
3.5.1 Different Elements of Speech
To address the possible difficulties of ASR software,
it is important to look into the elements of speech and
audio first. There are three aspects that make map-
ping the speech input to known words cumbersome
(Weber and Scharenborg, 2012). Firstly, many words
have a high resemblance. Therefore, context is ut-
terly important (Kaplan, 1990). Secondly, speech has
a high variability. The existing literature mentions
four main features of speech, namely speaker accents,
speaking style, speaking rate and phonological con-
text (Scharenborg et al., 2005). Lastly, speech is con-
tinuous and brief.
Additionally, words and sentences spoken by fe-
males are harder to recognize than when produced
by males (Lippmann, 1997). This means that differ-
ences in speaking style definitely affect the accuracy
of ASR software and should be taken into account.
Men tend to speak louder and slower, whereas fe-
males speak softly, but fast, whilst applying correct
grammar. Females tend to enunciate more as well
(Simpson, 2009). Furthermore, males and females of-
ten differ in voice frequency, which results in a either
high or low sounding voice.
Due to the invariance problem, the WER can be
rather high. This determines whether the system suc-
cessfully hears, understands and acts upon the speech
input. Solutions are proposed to this problem, which
aim at the expansion of (acoustic) language models
with more (acoustic) realizations of words (Simpson,
2009). This would ease the classification of words
and therefore create a better accuracy because of a de-
creased WER. Furthermore, as was used in TRACE,
multiple-word candidate matching increases the accu-
racy of the transcription and should therefore be im-
plemented more to ensure better results.
3.5.2 Different Elements of Audio
The characteristics such as speaker variability and
style are important to take into account when catego-
rizing audio files. However, not only the characteris-
tics of different speakers are important to distinguish
different audio files. Other elements that might influ-
ence the quality of the audio file, but are not related
to the speaker, need to be reviewed too. The first el-
ement of audio that is independent from the speech
signal but does influence the quality, is noise (Fors-
berg, 2003). When recording a consultation in a med-
ical setting, unwanted sounds, such as the ticking of
a clock or a creaking door, can disturb the purity of
the audio file. This might make it harder to convert
the speech input into written text. Another element
that could infer the speech signal is called the echo
HEALTHINF 2023 - 16th International Conference on Health Informatics
182

effect. This occurs when the speech signal is bounced
on something within the room and arrives in the mi-
crophone a few seconds later again.
The two elements that are stated above that in-
fluence the audio file are both focused on additional
sounds. Another aspect of sound itself that is im-
portant to take into account is the channel variabil-
ity. This accounts for the setting in which the audio is
recorded. The quality of the microphone and the dis-
tance of the microphone to the speaker belong to this
kind of variability (Forsberg, 2003).
Lastly, sounds can be characterized using acous-
tic features that already have been used to analyze
different audio files. These traditional, acoustic fea-
tures are pitch, loudness, duration, and timbre (Wold
et al., 1996). As Wold et al. (1996) state in their pa-
per, every feature except timbre is relatively easy to
measure and model. As these features can be differ-
ent for every audio file, investigating correlations be-
tween these features and the WER of the correspond-
ing transcripts can be interesting.
4 RESEARCH METHOD
To answer the main research question stated in Sec-
tion 2.1, we used a mixed-method approach, starting
with extensive literature research. The overview of
all relevant literature is stated in the previous Section
3. Table 1 presents a set of null and alternative re-
search hypotheses. To test these research hypothe-
ses, we conducted two studies. In the first study, we
took an existing dataset of medical audio recordings
(Mooney, 2018) that we manually labeled with re-
spect to the presence of Accent, levels of Frequency
and Noise. In the second study, we conducted a small
pilot experiment to test the observations from the first
study. Figure 2 provides an overview of our research
method. In both studies, the independent variables
are the presence of the speaker’s Accent, levels of
voice Frequency and Noise, and the dependent vari-
able is the WER. These variables were derived from
the existing literature as core factors potentially af-
fecting the quality of speech recognition and limiting
our study score to this set for practical reasons.
4.1 Study 1 – Existing Medical Data
For the analysis of existing medical audio files, an on-
line available data set is used. The data set (Mooney,
2018) has been retrieved from the Kaggle platform.
The audio files are recordings of two sentences at
most and are pronounced by different speakers, each
in possession of distinguishable speaking styles and
Table 1: Experimental Hypotheses.
Hyp Null Hypothesis Alternative Hypothesis
H1 No difference in WER be-
tween samples with and with-
out Accent.
There is a difference in WER
between samples with and with-
out Accent.
H2 No difference in WER be-
tween samples with different
levels of Frequency.
There is a difference in WER
between samples with different
levels of Frequency.
H3 No difference in WER be-
tween samples with different
levels of Noise.
There is a difference in WER
between samples with different
levels of Noise.
rates. The spoken language is English and the sen-
tences are along the lines of the following example:
”Oh, my head hurts me. I try to be calm but I
can’t.”
The data set consisted of 8.5 hours of audio in to-
tal, however, we included only 30 random files in our
study.
Labeling Audio Files The selected files were as-
signed with specific labels to enable the classifica-
tion and comparison of the different files. For accent,
voice frequency and noise, the file got assigned with
different intensities. The speaker accent is a binary
item: ”Accent” or ”No accent”. British English was
considered no accent, which automatically classifies
every other accent as yes. The frequency and noise
can both be assigned a level, namely high, medium
or low. However, according to the source of the used
data set containing existing audio files, the noise of
every item was either low or non-existent (Mooney,
2018), thus no noise was included as an intensity for
noise too.
Obtaining Corresponding Transcriptions Using
ASR Software After having labeled the audio files, the
files were exposed to an Automated Speech Recog-
nition technology, namely an application which is
called voice recorder (Software, ). This gave a tran-
scription, which was compared to the expected out-
come. The difference between the hypothesis and ex-
pected transcript is the Word Error Rate. The WERs
of all transcripts were calculated, so further analysis
could be done.
Grouping Characteristics And Comparing Error
Rates As the labels and the computed WERs of the
files and corresponding transcripts were noted, the
last step of the medical data analysis was taken. The
files were then grouped, to ease the process of com-
puting possible significant differences between the
characteristics of the files. This and the statistical
analyses are done by a short Python script. To dou-
ble check the results of statistical test and calculate
effect size, we used R.
How Different Elements of Audio Affect the Word Error Rate of Transcripts in Automated Medical Reporting
183
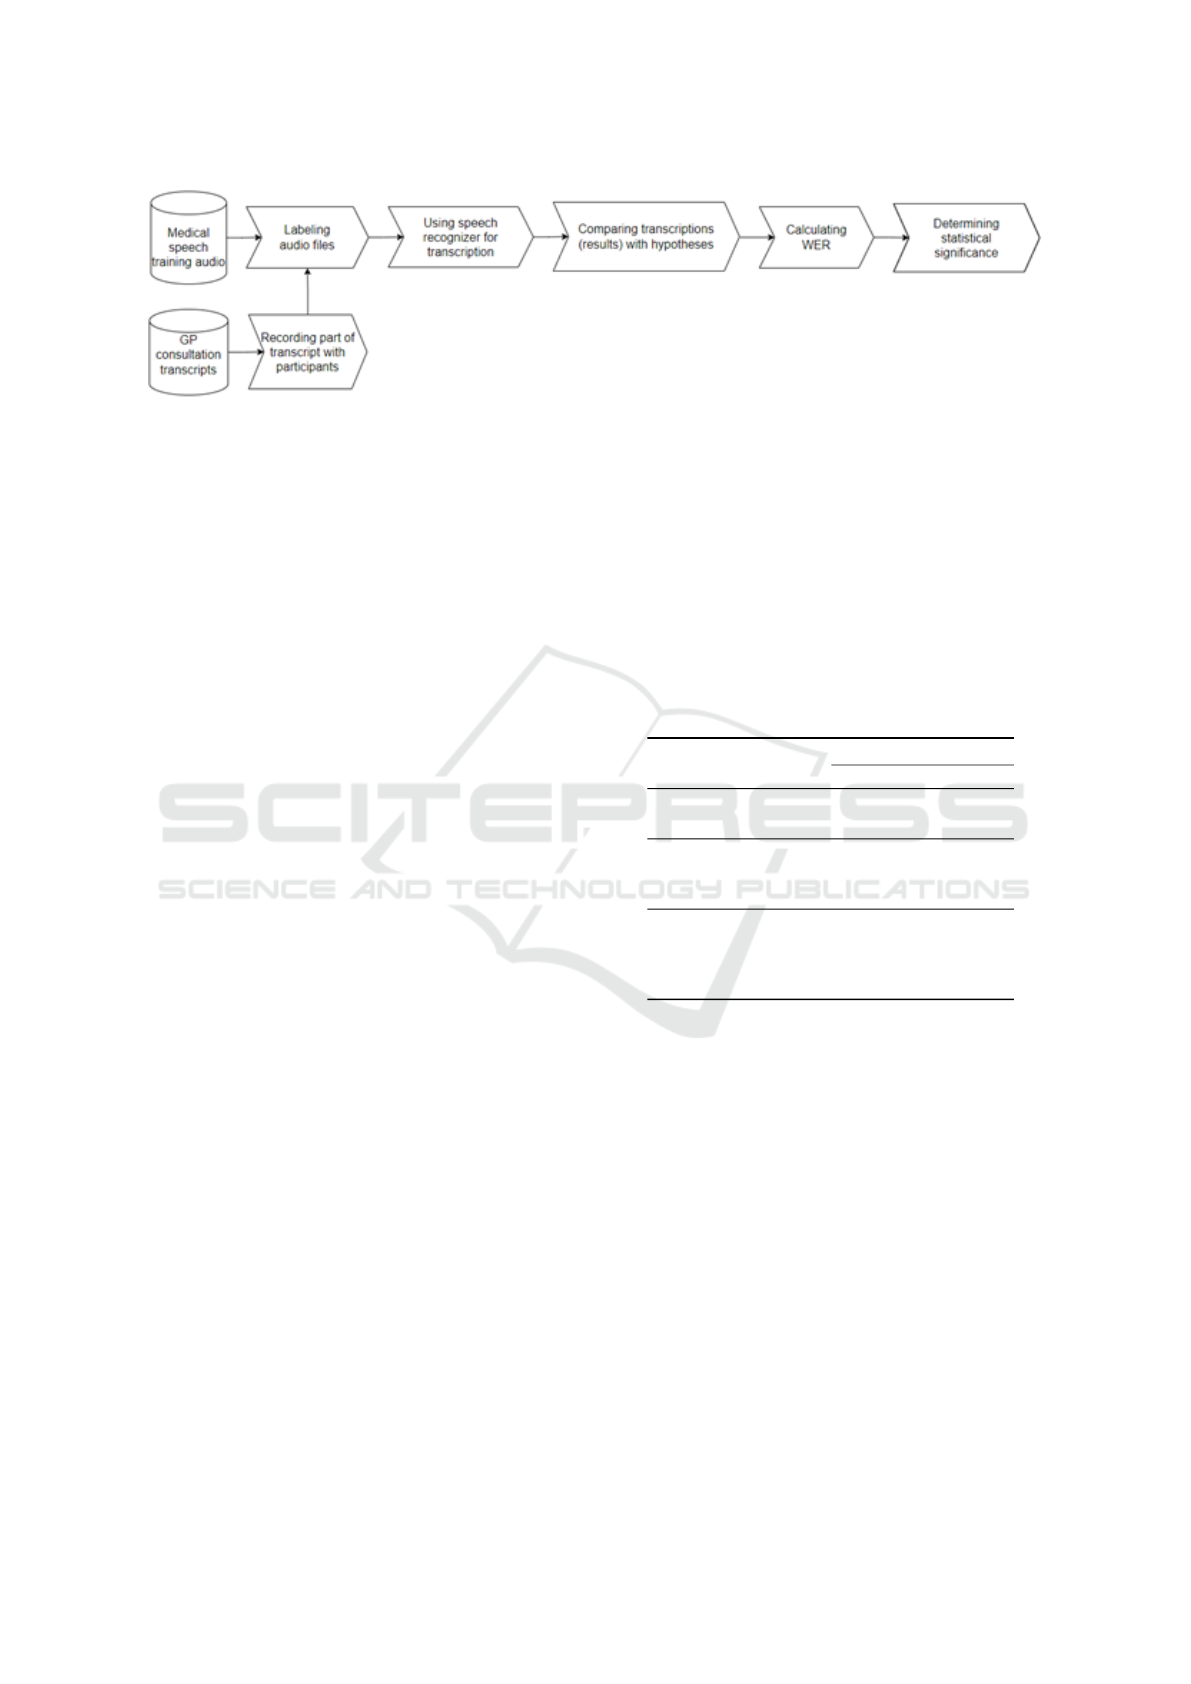
Figure 2: Steps of the Research Method.
4.2 Study 2 – Pilot Experiment
In this study, we conducted a small pilot experiment
with five Dutch speakers. We asked our participants
to read out loud two times a part of a medical consul-
tation transcript in Dutch and recorded them. There-
fore, we adopted a within-subject design. The differ-
ence between the two recordings is the presence of
noise. Besides, the participants differed in voice fre-
quency. Due to confidentiality reasons, we did not
include the transcript that the participants had to read
out loud. The script was a dialogue of roughly 3 min-
utes in which one of the authors acted as the general
practitioner.
Experiment execution The participants were gath-
ered using convenience sampling. At the beginning of
the experiment, we introduced our research quickly
and asked participants to sign the informed consent.
The microphone was placed directly in front of them.
Based on the outcomes of the first study, we focus on
the control for the noise factor. To limit the effect of
the order of treatment levels, we recorded three partic-
ipants reading first with noise and then without noise,
while the other two participants followed the opposite
order (first reading without noise, then with noise).
Thus, we collected two sets of recordings from five
participants resulting in ten recordings in total.
Analysis of the data resulting from the experiment
Similarly to the first study, we labelled the audio files
with respect to Accent, Frequency, and Noise (see
Section 4.1). We used the ASR software of Microsoft
to recognise speech and generate transcripts, because
the technology used in Study 1 only transcribed up to
1 minute of audio input. We then calculated the WER
value for each transcript and used statistical tests to
test our research hypotheses (see Table 1).
5 RESULTS
5.1 Results – Study 1 (Existing Medical
Data)
We calculated the Word Error Rate (WER) for every
audio file transcription. Table 2 reports the descriptive
statistics of WER value per level of each factor.
Table 2: Study 1 – Descriptive Statistics.
WER
mean med std
Accent
Yes 0.19 0.13 0.23
No 0.14 0.04 0.27
Frequency
Low 0.28 0.25 0.28
Medium 0 0 0
High 0.12 0.06 0.21
Noise
No 0.14 0.1 0.22
Low 0.06 0 0.11
Medium 0.42 0.375 0.22
High 0.46 0.4 0.36
We observed a lot of deletion and substitution
errors made by the Speech Recognition technology.
For example, ’whiteheads’ was transcribed as ’white
hats’ and ’there’ was transcribed as ’where’. Spoken
words such as ’ran’ were substituted with ’rang’ and
’knee’ was transcribed as ’name’. These errors were
counted, and statistical tests were done. Table 3 re-
ports the p-value returned by a corresponding statisti-
cal test for each independent variable and whether the
corresponding null hypothesis is rejected or not.
To validate our null hypotheses, we could use
the ANOVA test as we have two or more levels for
some of our independent variables. However, the
ANOVA test requires our samples to be normally
distributed (tested by Shapiro–Wilk test) and have a
homogeneity of variance (tested by Levene’s test).
Our samples do not have distribution normality.
Therefore, for H1, we use Mann–Whitney test, and
for H2 and H3, we use the Kruskal–Wallis (KW) test
HEALTHINF 2023 - 16th International Conference on Health Informatics
184

and a post-hoc Mann–Whitney (MW) test (corrected
for multiple tests with the Bonferroni method). We
adopt 5% as a threshold of α (i.e., the probability
of committing a Type-I error). For the statistically
significant results, we also report the approach to
report effect size following Tomczak & Tomczak
(2014).
Table 3: Study 1 – Summary of the findings.
Variable Statistical test p-value Null hyp.
Accent MW test 0.34 Not rejected
Frequency KW test 0.14 Not rejected
Noise KW test 0.016 Open*
*The post-hoc test did not confirm any statistically sig-
nificant difference between each pair of Noise levels.
Our statistical tests did not reveal any statisti-
cally significant differences in WER for the Accent
and Frequency variables. Therefore, we cannot reject
the corresponding null hypotheses. For H3, the KW
test returned p − value = 0.016, showing a statisti-
cally significant effect of the Noise on WER with a
large effect (η
2
= 0.281). However, the post-hoc MW
test with Bonferroni correction did not confirm this
(p − value ≥ 0.18). Thus, we keep our H3 hypothe-
sis open and explore the effect of Noise further in the
follow-up study.
5.2 Results – Study 2 (Experiment)
In our experiments, we focus on the effect of Noise
(based on the findings from Study 1) and Frequency
(based on the literature study results). Accent was left
out, because none of the participants’ speaking style
was classified as having an accent. The transcripts
produced by the ASR software contained a lot of sub-
stitution errors and even more deletion word errors,
comparing to the Study 1 results. Table 4 reports the
descriptive statistics of WER value per levels of each
factor.
Similar to Study 1, we used statistical analysis to
test the remaining null hypothesis H2 and H3. Due
to low number of data points and to keep the anal-
ysis as close as possible to Study 1, we used non-
parametric tests. As we followed a within-subject de-
sign, for H2 we used Wilcoxon test (paired compar-
ison) and for H3 we used KW test. Table 5 reports
the results of our analysis. For Frequency, the KW
test return p − value = 0.23 and, thus, we cannot re-
ject the null hypothesis H2. The Wilcoxon test did
not show any statistically significant results for Noise
(p − value = 0.92) and, therefore, we cannot reject
the null hypothesis H3.
Table 4: Study 2 – Descriptive Statistics.
WER
mean med std
Sample without noise
Frequency
Low 0.27 0.27 N/A
Medium 0.20 0.21 0.025
High 0.29 0.29 N/A
Sample with noise
Frequency
Low 0.28 0.28 N/A
Medium 0.21 0.19 0.09
High 0.26 0.26 N/A
Table 5: Study 2 – Summary of the findings.
Variable Statistical test p-value Null hyp.
Noise Wilcoxon test p=0.91 Not rejected
Frequency KW test p=0.23 Not rejected
6 DISCUSSION
6.1 Limitations
This research was limited in a number of ways.
Firstly, the literature on the topic of one of our sub-
questions was limited. Scientific papers on acceptable
Word Error Rates within the medical field do not exist
widely since this is a new field of research. A specific
limit was therefore not being selected and the research
was forced to only look into the differences between
groups instead of meeting a specific criteria.
For the analysis on both the data selected of the
data set already available and the data that was col-
lected through participants, limitations arose too. The
two studies differed in language and ASR systems
used. As the audio files of Study 1 was in English
and ASR systems are likely to have been trained on
English words more often, WER values of Study 1
could be lower. Results of both studies are therefore
hard to compare.
What is important to consider too, is that the pi-
lot experiment that was carried out was not ecologi-
cally valid. The participants read a script out loud in
a controlled setting. If the optimization of Automated
Reporting would be researched any further, an uncon-
trolled setting is recommended.
Lastly, due to time constraints, we had to select a
set of thirty files for the first analysis. For the experi-
ment only five participants were included. To strongly
state differences, data of more participants should be
gathered.
How Different Elements of Audio Affect the Word Error Rate of Transcripts in Automated Medical Reporting
185

6.2 Future Work
The field of Automated Medical Reporting is a rel-
atively new research field. The first step of Auto-
mated Medical Reporting is transcribing the consulta-
tion, which was the main focus of this research. It was
concluded that there are elements of speech and audio
that have influence on the Word Error Rate, which is
a useful start for further research. The experimental
part of this research took place in a controlled setting
and was therefore not ecologically valid as explained
in the previous Section 6.1. For studies that want to
build upon the results within this study, audio files
of real consultations should be used as data. Then,
research can be focused on the speaking style of pa-
tients. It is important to consider that patients are try-
ing to convey symptoms and possible diagnoses that
they thought about themselves. This is often not a
fluent story and might be hard to translate into a tran-
scription and eventually report.
Other interesting factors such as language and dif-
ferent Automated Speech Recognition technologies
were not included in this research and can be relevant
in the field of automated medical reporting. If doing
so, more participants need to be included as well. A
significant difference was hard to find on the data of
the experiment within this study, due to the lack of
participants as a result of the lack of time. There is
definitely a lot to build upon.
Furthermore, as stated by Fung and Kat (Fung
and Kat, 1999) using an accent-adaptive recognizing
system would decrease the overall error rate. Their
research showed that using a dictionary focused on
speech with accents in regard to knowledge about the
native speech allows for less errors being made when
the speech recognizer is trained well on this dictio-
nary. Their Word Error Rate dropped 4% and this
outcome not only shows that a lot can be achieved
when using training data that takes into account vari-
ous speakers, but also promising results for future re-
search on the accuracy of Word Error Rates.
7 CONCLUSION
This research started with the main question stated in
Section 2.1. Through extensive literature research, it
can be concluded that speech input can be classified
through various elements, focusing on either speech
or audio features. Speech can be distinguished in
speaking style, rate, accent and context, whereas au-
dio is distinguishable through channel variability and
style. There is no standard regarding the Word Error
Rate yet, but findings in the literature research show
there is still a lot of improvement that can be made.
This research focused on the influence of noise, voice
frequency and accent on the Word Error Rate of tran-
scriptions generated by Automated Speech Recogni-
tion software. We can partly state that noise has a
significant impact on the WER since this was true for
a selection of existing data of an online data set; the
English short monologues that we have investigated.
The statistical analyses that were performed indicate
that only noise in comparison to the WER shows a
statistically significant difference. Noise is an impor-
tant factor to cancel out when optimizing Automated
Medical Reporting. However, for the experiment car-
ried out afterwards, a dutch medical dialog, no signifi-
cant differences were found on any of the observed el-
ements. The direct declaration for this was not found
within this research. The overall conclusion is that
more research into noise, the difference in language
and the difference between monologue and dialogue
need to be done.
ACKNOWLEDGEMENTS
We would like to acknowledge Sandra van Dulmen
for providing real transcripts of Dutch general practi-
tioner consultations. Based on these transcripts we
were able to create a script for the pilot study that
came as close to a real consultation as possible.
REFERENCES
ElAssy, O., de Vendt, R., Dalpiaz, F., and Brinkkemper,
S. (2022). A semi-automated method for domain-
specific ontology creation from medical guidelines. In
International Conference on Business Process Mod-
eling, Development and Support, International Con-
ference on Evaluation and Modeling Methods for
Systems Analysis and Development, pages 295–309.
Springer.
Evermann, G. (1999). Minimum word error rate decoding.
Cambridge University, UK, pages 45–67.
Forsberg, M. (2003). Why is speech recognition difficult.
Chalmers University of Technology.
Fung, P. and Kat, L. (1999). Fast accent identification and
accented speech recognition.
Gaikwad, S. K., Gawali, B. W., and Yannawar, P. (2010). A
review on speech recognition technique. International
Journal of Computer Applications, 10(3):16–24.
Kaplan, D. (1990). Words. Proceedings of the Aristotelian
society, supplementary volumes, 64:93–119.
Kotelly, B. (2003). The art and business of speech recogni-
tion: creating the noble voice. Addison-Wesley Pro-
fessional.
HEALTHINF 2023 - 16th International Conference on Health Informatics
186

Lippmann, R. P. (1997). Speech recognition by machines
and humans. Speech communication, 22(1):1–15.
Maas, L., Geurtsen, M., Nouwt, F., Schouten, S. F.,
Van De Water, R., Van Dulmen, S., Dalpiaz, F.,
Van Deemter, K., and Brinkkemper, S. (2020). The
care2report system: automated medical reporting as
an integrated solution to reduce administrative burden
in healthcare.
Mooney, P. (2018). Medical speech, transcription, and in-
tent [dataset].
Moore, R. K. and Cutler, A. (2001). Constraints on theories
of human vs. machine recognition of speech. In Work-
shop on Speech Recognition as Pattern Classification
(SPRAAC), pages 145–150. Max Planck Institute for
Psycholinguistics.
Scharenborg, O. (2007). Reaching over the gap: A review
of efforts to link human and automatic speech recog-
nition research. Speech Communication, 49(5):336–
347.
Scharenborg, O., Norris, D., Ten Bosch, L., and McQueen,
J. M. (2005). How should a speech recognizer work?
Cognitive Science, 29(6):867–918.
Simpson, A. P. (2009). Phonetic differences between male
and female speech. Language and linguistics com-
pass, 3(2):621–640.
Software, A. Geluid opnemen - dictafoon (version 1.1)
[software].
Vilar, D., Xu, J., d’Haro, L. F., and Ney, H. (2006). Er-
ror analysis of statistical machine translation output.
In Proceedings of the fifth international conference on
language resources and evaluation (LREC’06).
Wang, Y.-Y., Acero, A., and Chelba, C. (2003). Is word
error rate a good indicator for spoken language un-
derstanding accuracy. In 2003 IEEE workshop on au-
tomatic speech recognition and understanding (IEEE
Cat. No. 03EX721), pages 577–582. IEEE.
Weber, A. and Scharenborg, O. (2012). Models of spoken-
word recognition. Wiley Interdisciplinary Reviews:
Cognitive Science, 3(3):387–401.
Wold, E., Blum, T., Keislar, D., and Wheaten, J. (1996).
Content-based classification, search, and retrieval of
audio. IEEE multimedia, 3(3):27–36.
How Different Elements of Audio Affect the Word Error Rate of Transcripts in Automated Medical Reporting
187
