
Combined Unsupervised and Supervised Learning for Improving
Chest X-Ray Classification
Anca Ignat
and Robert-Adrian Găină
Faculty of Computer Science, University “Alexandru Ioan Cuza” of Iași, Romania
Keywords: Chest X-Ray, Pneumonia, Deep Learning Networks, Support Vector Machines (SVM), Random Forest (RF),
Clustering Methods.
Abstract: This paper studies the problem of pneumonia classification of chest X-ray images. We first apply clustering
algorithms to eliminate contradictory images from each of the two classes (normal and pneumonia) of the
dataset. We then train different classifiers on the reduced dataset and test for improvement in performance
evaluators. For feature extraction and also for classification we use ten well-known Convolutional Neural
Networks (Resnet18, Resnet50, VGG16, VGG19, Densenet, Mobilenet, Inception, Xception, InceptionResnet
and Shufflenet). For clustering, we employed 2-means, agglomerative clustering and spectral clustering.
Besides the above-mentioned CNN, linear SVMs (Support Vector Machines) and Random Forest (RF) were
employed for classification. The tests were performed on Kermany dataset. Our experiments show that this
approach leads to improvement in classification results.
1 INTRODUCTION
Image processing methods allow us to perform some
operations over an image in order to extract relevant
information. One domain that highly benefits from
this type of techniques is Medical Imaging. Medical
images make up most of the data available in
healthcare. CT, MRI and X-Ray are only some
examples of files that are used for in-depth
non-invasive exploration of internal anatomy. This
way of transmitting data about a patient is available
for medical staff to improve treatment.
The chest X-ray (CXR) is one of the most
commonly accessible radiological examinations used
in diagnosis lung diseases or respiratory symptoms.
The benefits of this type of examinations that made it
one of the most popular methods used even today are:
cost-effectiveness, low radiation dose and ease of
pathology detection from the results obtained.
Pneumonia is one of the most common lung
diseases caused by viruses, bacteria or fungi.
Pneumonia causes the inflammation of either one or
both of the lungs with fluids that can cause cough and
difficulty in breathing. When suffering from
pneumonia, the exchange rate between carbon
1
https://www.news-medical.net/health/Pneumonia-Epide
miology.aspx
dioxide (CO2) and oxygen (O2) at the alveolar
membrane level decreases. Pneumonia is treated
based on the pathogen that caused the infection. Thus,
for bacterial pneumonia antibiotics are used whilst for
viral pneumonia antiviral drugs are administrated and
antifungal drugs for the fungal pneumonia. Anyone
can be affected by this disease though children and
people over 65 are more susceptible of contacting it
while lowering the chances of survival. A common
approach used by radiologists in order to recognize a
patient suffering from pneumonia is the analysis of a
CXR. The main difference is based on the presence
of white hazy regions that are not present in lungs of
a healthy person.
The presence of pneumonia in the human body is
a classification problem that radiologists face daily.
However, due to a high demand in examinations and
low number of experts able to give a diagnostic, there
is a direct relation between the infection rate caused
by pneumonia and the medical infrastructure
available over a certain region
1
. Because of this,
recent studies focused on developing classification
models able to recognize pneumonia based on CXRs.
The decisions usually made by medical staff can be
helped by computer-aided diagnosis (CAD) tools that
Ignat, A. and G
˘
ain
˘
a, R.
Combined Unsupervised and Supervised Learning for Improving Chest X-Ray Classification.
DOI: 10.5220/0011793000003417
In Proceedings of the 18th International Joint Conference on Computer Vision, Imaging and Computer Graphics Theory and Applications (VISIGRAPP 2023) - Volume 4: VISAPP, pages
475-482
ISBN: 978-989-758-634-7; ISSN: 2184-4321
Copyright
c
2023 by SCITEPRESS – Science and Technology Publications, Lda. Under CC license (CC BY-NC-ND 4.0)
475

can output a verdict based on the data given. A flow
that a CAD system usually performs has three steps.
In the first step, the CXR is pre-processed in order to
prepare it for the next operations (Caseneuve et al.,
2021). This implies resizing, reorienting or colour
correcting operations in order to standardize images
from multiple sources.
In the second step, features are extracted from the
pre-processed image. The last step consists of
analysing the features extracted in order to output a
final result. Some relevant surveys that summarize
recent progress in CXR image analysis are in (Khan,
Zaki, Ali, 2021), (Çallı et al., 2021), (Li et al. 2020).
In these papers one finds lists of datasets with CXR
images, methods used for solving different types of
problems that are CXR related and results obtained
with several performance evaluators.
(Ayan and Ünver, 2019) use transfer learning and
fine-tuning on Xception and VGG16 for detecting
pneumonia. The tests are computed on Kermany
(Kermany, Zhang, Goldbaum, 2018) dataset. In
(Sharma, Jain, Bansal, 2020) different variations of a
CNN architecture are presented with the use of
neurons dropout. All the models with dropout
outperform the normal model but the quality of the
results depends on the probability of dropout. The
experiments are performed on Kermany dataset with
training and test sets different from those used in this
article. (Hammoudi et al., 2021) compares VGG,
Densenet and Inception Resnet tailored for the
Kermany database in order to improve the results.
After training, the model is also tested with a dataset
containing CXR for adults, this dataset contains also
the medical history of each person. It is shown that
transfer learning can be efficient even if the data
sources are differently collected. In (Mabrouk et al.,
2022) the authors combine the results computed with
three neural networks to improve the pneumonia
classification results. They use Kermany dataset for
their computations. In (Kundu et al., 2021) the
authors also use ensemble methods with three neural
networks and test their method on Kermany and
RSNA datasets. The experiments are performed with
a 5-fold cross-validation procedure. (Couhan et al.,
2020) propose five models in order to classify the
same dataset that is discussed in this paper and after
analysing the results another meta-model that
combines the previous ones achieves state-of-the art
performance for the problem proposed, on Kermany
dataset. (Zhang et al., 2021) present an analysis of the
performance for different CNN architectures. They
2
https://www.kaggle.com/datasets/paultimothymooney/
chest-xray-pneumonia
pre-process the dataset and develop a smaller VGG-
like architecture for solving the pneumonia detection
problem. They use Kermany dataset with a random
split 70% for training, 10% for validation and 20%
for testing.
The main novelty of our work is the use of
clustering methods for the training set improvement,
and thus, obtaining better classification results.
The article has five sections. The first presents the
problem and the related work. The second section
presents the Kermany dataset employed in the
experiments. The clustering methods, the feature
extraction process, the classification procedure and
the methodology of combining them are described in
Section 3. Section 4 is dedicated to the results of our
tests. The final section presents conclusions and
future directions of research.
2 DATASET
We used in our tests the Kermany dataset (Kermany,
Zhang, Goldbaum, 2018). This dataset was
downloaded from Kaggle
2
. This is a data collection of
grayscale chest X-ray images. The images are in
JPEG format, the sizes of these images are variable.
The dataset is divided in three folders: test, val and
train. In each of these folders there are two
directories, labelled “normal” and “pneumonia”. We
merged the train and val folders thus obtaining a
training set with 1349 chest X-ray images of normal
lungs and 3883 images for lungs affected by
pneumonia. In the test set there are 234 images
labelled “normal” and 390 with “pneumonia”. We
did not apply any pre-processing enhancement
method.
In Fig. 1 are two samples of images from this
dataset, the first is a chest X-ray for normal lungs and
the second is for lungs with pneumonia.
3 METHODS
The idea behind our computations is based on the
observation that on the same medical image different
physicians can establish different diagnostics. When
working with medical image datasets, the images
have one label, not always knowing how this label
was settled.
VISAPP 2023 - 18th International Conference on Computer Vision Theory and Applications
476
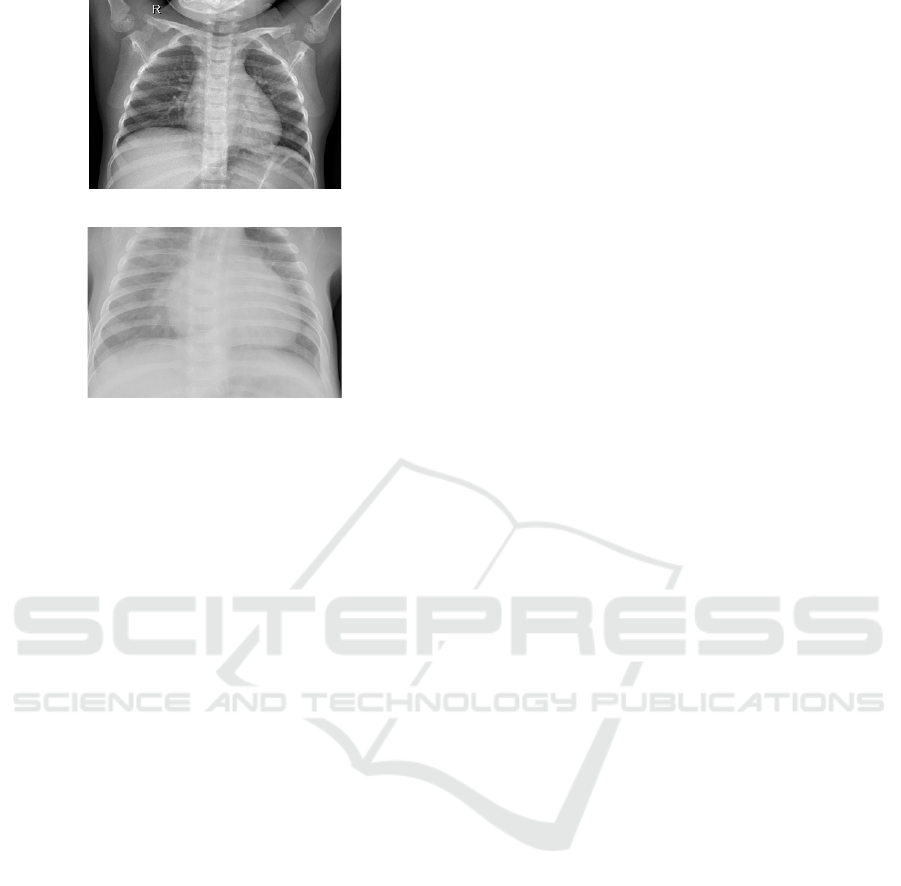
Normal lung chest X-ray image
Pneumonia affected lung chest X-ray image
Figure 1: Samples of images from the Kermany dataset.
In order to increase the coherence of the dataset,
we intend to apply clustering methods on the training
set of images, without taking into account the original
labels of these images. We hope that the clustering
algorithms will grasp hidden patterns in the CXR
images, patterns that better define the differences
between the healthy lungs and the pneumonia
affected lungs.
The clustering methods are applied for dividing
the training set in two clusters. Then, we retain in a
given class, only the images that were also selected
by the clustering algorithm. Thus, one obtains a
reduced training set, assumingly more consistent than
the original one. We consider that the new content of
the two classes is formed by images which are better
representatives of the modelled reality.
In this work we tested three clustering techniques.
The first is k-means (in our case, 2-means) with two
distances, Euclidean and Manhattan (Tan, Steinbach,
and Kumar, 2019). The second algorithm is
agglomerative clustering, with four types of cluster
distances (Landau et al., 2011). The third technique is
spectral clustering (Wierzchoń and Kłopotek, 2018).
The k-means algorithm is an iterative method that
starts with k initial points and then it aggregates the
data around these points. One computes the centroids
of these clusters and computes a new cluster
distribution. The process iterates until a certain
cohesion criteria is fulfilled or a maximal number of
iteration is achieved.
The agglomerative clustering starts with a number
of clusters equal with the number of points in data.
Then it aggregates two of these clusters that are at a
minimum distance. At each step one has at least one
cluster less than at the previous step. The process
stops when the required number of clusters is
achieved. The resulting clusters content depends on
the chosen distance between clusters. We used four
distances. For the first, the distance between clusters
is given by the closest points of the two clusters. This
method is called single linkage. The second distance
is defined by the furthest points (complete linkage),
the third computes the distance by averaging all the
distances of points from different clusters (average
linkage). The forth method of computing a distance
measure between clusters is called Ward distance and
depends on the centroids of the two clusters and the
number of elements in each cluster.
The spectral clustering algorithm is a technique
borrowed from graph theory, where the nodes are
grouped in separate sets by computing eigenvalues
and eigenvectors of the Laplacian matrix associated
to the graph and keeping a reduced number of the
eigenvalues, eigenvectors. In our particular situation,
the nodes of the graph are the CXR images, the edges
are defined by the similarity matrix (or distance
matrix) between the images in the training set, this
matrix is considered a generalized adjacency matrix
for the graph.
We tested all these clustering algorithms on our
dataset, and in all computations the single linkage
algorithm performed poorly, one of the clusters
having very few or no elements. Thus, we do not
provide in this paper results for this clustering
technique.
For applying clustering methods one needs
features for image characterization. For this purpose,
we first trained several well-known neural networks
on the given dataset. We used two methods from the
Resnet family, Resnet18 and Resnet50 (He, Zhang,
Ren, Sun, 2016), two VGG networks, VGG16 and
VGG19 (Simonyan, Zisserman, 2014), three
Inception type methods, Inception v3, Xception, and
InceptionResnet v2 (Szegedy et al, 2016), (Chollet,
2017), Densnet201 (Huang et al., 2017), Mobilenet
v2 (Sandler et al., 2018) and Shufflenet (Zhang,
Zhou, Lin, Sun, 2018). If one passes an image through
the network and stops the network’s evolution before
the classification step, one obtains feature vectors for
that image. Thus, we obtain ten sets of feature
vectors, for each set we performed the classification
process.
For clustering purposes, we used for feature
extraction only five of the above mentioned networks:
Resnet18, Resnet50, VGG16, InceptionResnet v2 and
Densenet201.
Combined Unsupervised and Supervised Learning for Improving Chest X-Ray Classification
477
Besides the five networks mentioned above, we
also trained the following networks: VGG19,
Mobilenet, Inception v3, Xception and Shufflenet.
For all these networks we performed data
augmentation before training them and a 70%-30%
split for the validation process. For augmentation
translations and scaling were applied. We used a
standard set of values for the usual parameters (batch
size, learning rate). All the networks were trained
under the same conditions. Our interest was to obtain
good classification results with these networks, but
our main goal was to test if the selection process
performed on the dataset using clustering methods
can improve the results obtained on the original
dataset. The majority of tests were performed by
using these ten networks for feature extraction and
then employing linear SVM and Random Forest for
classification. We also computed classification
results using Resnet18 trained on some of the reduced
training sets. We monitored if there are improvements
of the performance evaluators.
As performance evaluators we used the accuracy
(the percentage of correctly identified chest X-ray
images from the total number of test images) and the
Area Under the Curve ROC (Receiver Operating
Characteristics), abbreviated AUC.
4 RESULTS
The experiments were performed on a laptop, with
Intel(R) Core(TM) i7-8565U CPU, with a NVIDIA
GeForce RTX 3060 GPU, in MATLAB 2020.
All the networks were trained 60 epochs, using the
Stochastic Gradient Descent optimizer, mini batches
of size 16, and cross-entropy loss function.
We adopted the following abbreviations for the
clustering methods: E for 2-means with Euclidean
distance, M – 2-means with Manhattan distance, C –
complete linkage, A – average linkage, W – Ward
linkage, S – spectral clustering.
All the results presented on this section are
obtained on the test set, using the ten networks for
feature extraction.
We began by computing the classification results
using the original, unselected dataset, employing the
trained neural networks, the linear SVM and Random
Forest. For the last two classification methods we
used the feature vectors produced by the same
convolutional neural network, stopped before the
classification layers. In Table 1 are the accuracies and
in Table 2 the AUC values for these methods.
As expected, the trained networks provide the
better results than the SVM and RF, Shufflenet
producing the best overall result.
Table 1: Classification results on the original dataset:
accuracies (%).
Metho
d
Networ
k
SVM RF
Resnet18 94.87 85.58 89.90
Resnet50 94.07 91.35 89.74
VGG16 94.23 89.58 89.90
VGG19 96.63 88.46 90.87
Densenet 96.47 93.59 92.15
Mobilenet 95.03 92.15 90.38
Inception 94.53 93.11 91.51
Xce
p
tion 95.51 90.87 89.42
IncResnet 94.87 91.99 91.83
Shufflenet 96.79 91.99 89.26
Table 2: Classification results on the original dataset: AUC
values.
Metho
d
Networ
k
SVM RF
Resnet18 0.9367 0.8628 0.8654
Resnet50 0.9243 0.8855 0.8632
VGG16 0.9256 0.8628 0.8662
VGG19 0.9576 0.8470 0.8791
Densenet 0.9572 0.9171 0.8970
Mobilenet 0.9380 0.8962 0.8726
Inception 0.9551 0.9107 0.8876
Xception 0.9444 0.8808 0.8624
IncResnet 0.9367 0.8966 0.8936
Shufflenet 0.9623 0.8940 0.8585
After performing the selection process described
in the previous section, we were interested to see how
many images in each class were selected. The new
dimensions for the new training set classes are shown
in Table 3. The first number in the cell is the number
of normal chest X-ray images selected and the second
is those with pneumonia. Note that all the clustering
methods and networks select the great majority of the
normal images in the first class. The complete and
average linkage have difficulties in distinguishing
between normal and pneumonia affected lungs. The
VGG19 network has a good selection capability,
regardless of the clustering method. We consider a
good selection one that produces a pneumonia class
that has at least 2500 images.
We performed classification tests using all the
clustering methods and all the 10 types of deep
learning generated features, with both SVM and RF.
Table 4 and Table 5 show the best classification
results obtained and the average accuracies for the
five clustering method we tested. For the best results
we show the accuracy value, the network that
produced the feature vectors for classification and the
VISAPP 2023 - 18th International Conference on Computer Vision Theory and Applications
478

network that produced the feature vectors for the
selection process. The average value is over the
accuracies produced with the five networks employed
in our computations for reducing the training set, for
each clustering method. Table 4 shows the results
obtained using the linear SVM classifier and Table 5
present the results for RF.
Table 3: New sizes of the dataset after the unsupervised
selection process.
E M C A W S
Resnet18 1349/
2816
1349/
3259
1349/
739
1349/
26
1349/
2440
1307/
146
Resnet50 1346/
2431
1342/
3338
1345/
6
1348/
0
1345/
2176
1244/
293
VGG19 1347/
3796
1347/
3765
1342/
3864
1338/
3869
1342/
3870
1007/
973
IncResnet 1341/
3597
1342/
3709
1349/
5
1349/
1
1348/
19
1348/
17
Densenet 1347/
3550
1347/
3673
1348/
1214
1349/
1
1334/
3869
1246/
366
Table 4: SVM results for different clustering techniques.
Best Average
Accuracy
Feat net Selection
E 96.79% VGG19
Densenet
Resnet50
Resnet18
94.79%
M 96.31% VGG16
Densenet
Shufflenet
Resnet18
Resnet18
Resnet18
94.34%
C 96.96% VGG16
Densenet
Ince
p
tion
Densenet
Densenet
Densenet
78.59%
A 93.91% Densenet VGG16 57.66%
W 97.12% VGG16
Densenet
Resnet18
Resnet18
90.75%
S 96.96% Densenet Resnet18 90.71%
Table 5: RF results for different clustering techniques.
Best Average
Accuracy
Feat net Selection
E 96.31% Densenet Resnet50 93.25%
M 95.51% VGG19 Resnet18 92.43%
C 96.79% VGG19 Resnet18 75.09%
A 92.63% VGG19
Densenet
Resnet18
VGG16
53.88%
W 96.15% Densenet Resnet50 87.06%
S 96.63% Resnet18
Mobilenet
Ince
p
tion
Resnet18
Densenet
Resnet17
88.58%
We then studied which type of network employed
for feature extraction provided the best classification
result for each clustering method. In Table 6 are this
type of dependency using the SVM classifier, and in
Table 7 are the results for the RF. We use the
following abbreviations for the five networks
employed in the selection process: R18 and R50 for
Resnet18 and Resnet50, respectively, D for Densenet,
IR for InceptionResnet.
Note that certain clustering methods favour
certain selection networks. For example, the 2-means
clustering and Ward agglomerative method favour
the Resnet class selection networks for both SVM and
RF. Complete linkage favours features extracted with
Densenet and average linkage prefers the VGG16
network. One notes that in these tables the
InceptionResnet selection does not appear. The
results presented in these two table are similar but not
identical. From these tables one can deduce that a
good choice for feature extraction in the selection
process is a network from the class Resnet.
Table 6: Networks that provided best SVM accuracy results
for each clustering method.
E M C A W S
Resnet18
R50
R18 D Vgg16 R50 R18
Resnet50 R18 R18 D Vgg16 R18 R50
VGG16 R50 R18 D Vgg16 R18 R50
VGG19 R50 Vgg16 D Vgg16 R18 R18
Densenet R18 R18 D Vgg16 R18 R18
Mobilenet R18 R18 D Vgg16 R50 R18
Inception R50 R18 D Vgg16 R50 D
Xception R18 R18 D Vgg16 R18 R18
IncResnet R18 R18 D Vgg16 R50 R50
Shufflenet R18 R18 D Vgg16 R18 R50
Table 7: Best RF accuracy results for each clustering
method.
E M C A W S
Resnet18
R50
R18 D Vgg16 R18 R18
Resnet50 R18 R18 D Vgg16 R18 R50
VGG16 R50 R18 D R18 R50 R18
VGG19 R18 R18 R18 R18 R18 R18
Densenet R50 R18 R18 Vgg16 R50 D
Mobilenet R50 R18 D Vgg16 R18 D
Inception R50 R18 D Vgg16 R50 R50
Xception R50 R18 R18 Vgg16 R50 R50
IncResnet R50 R18 D Vgg16 R18 D
Shufflenet R50 R18 D Vgg16 R18 D
Combined Unsupervised and Supervised Learning for Improving Chest X-Ray Classification
479
This choice will be more evident from Table 8,
where the best accuracy results depending on the
clustering method are presented. The best
improvement in accuracy result (97.12%) was
obtained by using SVM on a dataset selected with
Resnet50 or Resnet18 features with Ward or spectral
clustering, the classification feature computed with
VGG16 or Densenet. Comparing these results with
those in Table 1, we deduce that there is an overall
significant improvement in accuracy. The same
happens when comparing the AUC values.
Table 8: Networks that provided best SVM accuracy results
for each clustering method.
SVM RF
Acc. Clust met Acc. Clust met
Resnet18 96.15% M 96.63% S
Resnet50 96.15% W 95.99% S
VGG16 97.12% W, S 96.63% C
VGG19 96.79% E 96.96% C
Densenet 97.12% W 96.15% S
Mobilenet 96.15% E 96.47% S
Inception 96.96% C 95.83% C
Xception 96.63% E 95.83% S
IncResnet 95.03% E 94.71% E
Shufflenet 96.63% E 95.99% S
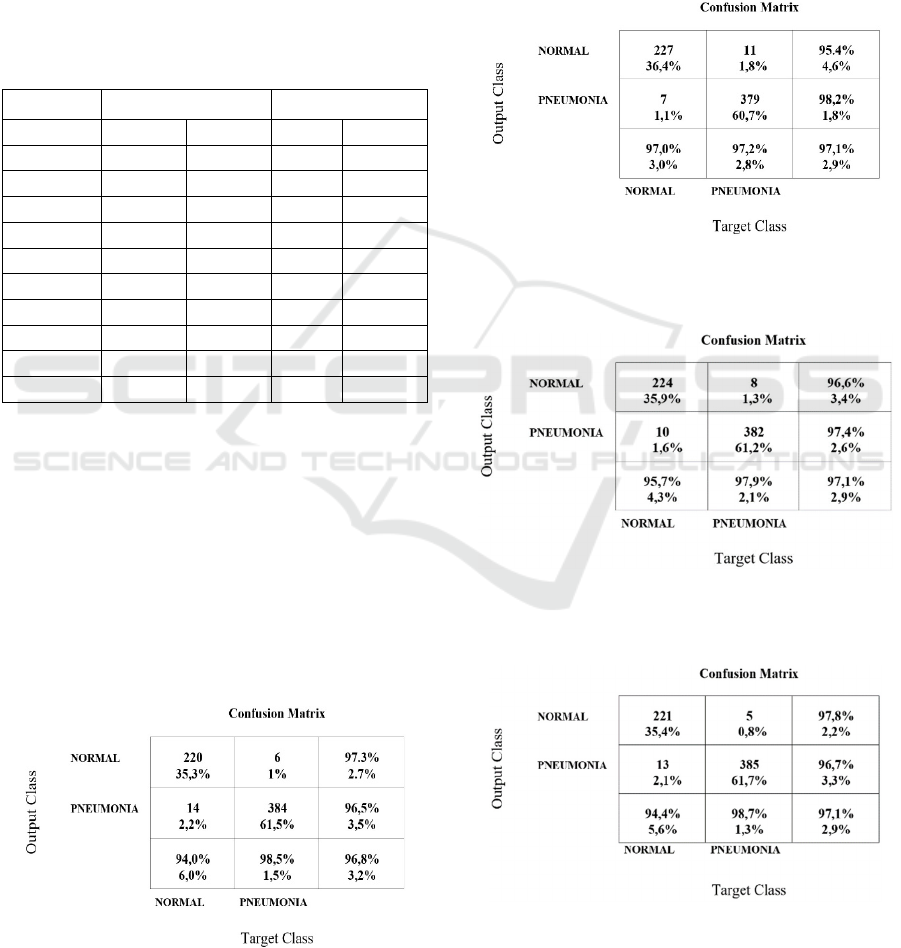
We present in the next figures the confusion
matrices for classification results obtained on the
whole dataset and on datasets selected using different
clustering methods.
We show the confusion matrices for the classifiers
that provided the best results: Shufflenet, for the
original dataset (see Fig. 2), Densenet (Fig. 3 and 4)
and VGG16 for the selected dataset (Fig. 5). Because
in the selection process the main reduction was
performed on the class of pneumonia images, we
expect that the improvement in accuracy is due to the
decrease of the false positive.
Figure 2: Confusion matrix for Shufflenet, trained on the
original dataset.
We trained Resnet18 on different datasets selected
with different networks for feature extraction and
clustering methods. We chose those selected datasets
that have enough images in the pneumonia class. The
results (accuracy and AUC) are in Table 9. Almost in
all situations the results are better than those obtained
by training Resnet18 on the original, unselected
dataset. For 2-means with Manhattan distance and
feature extracted with Resnet50 we obtain the best
overall result, 97.44%.
Figure 3: Confusion matrix for Densenet201, trained on the
dataset selected with Resnet18 features and Ward
clustering.
Figure 4: Confusion matrix for Densenet201, trained on the
dataset selected with Resnet50 features and Ward
clustering.
Figure 5: Confusion matrix for VGG16, trained on the
dataset selected with Resnet18 features and Ward
clustering.
VISAPP 2023 - 18th International Conference on Computer Vision Theory and Applications
480
Table 9: Resnet18 accuracy results obtained using training
sets generated with different networks and clustering
methods.
E M C A W
Resnet18
95.99%
0.962
96.79%
0.9658
- - 86.38%
0.8868
Resnet50 91.83%
0.9286
97.44%
0.9709
- - 91.19%
0.9252
VGG16 96.15%
0.9538
96.15%
0.9530
96.15%
0.9521
95.03%
0.9372
96.31%
0.9551
IncResnet 96.63%
0.9594
96.31%
0.956
- - 96.96%
0.9654
Densenet 95.67%
0.9457
87.66%
0.8987
96.15%
0.9607
- 95.99%
0.956
In Figure 6 is the confusion matrix for the best results
(Resnet18 trained on a training set selected with 2-
means with Manhattan distance, with features
produced by Resnet50). The false positives remain
rather high, and this good result is due to the decrease
of false negatives. We compared the results obtained
with the same network, Resnet 18, but the training
process was performed on the entire dataset. The
confusion matrix is in Fig. 7. Note that the false
negative are the same, the improvement of 2.5% in
accuracy is due to the decrease of the false positive.
Figure 6: Confusion matrix for Resnet18, trained on the
dataset selected with Resnet50 features and 2-means with
Manhattan distance.
Figure 7: Confusion matrix for Resnet18, trained on the
original dataset.
We compare our result with those obtained in
other studies. Although there are articles that report
classification results on the same dataset, in most of
the cases the test set is not the same. The best results
obtained for the same dataset, with the same split
training-test as ours are in (Mabrouk et al., 2022) with
accuracy 93.91% on the test set, and in (Chouhan,
2020) the reported accuracy is 96.39% with 0.9934
AUC. We could improve our results, by improving
the results in Table 1. The results obtained in Table 1
can be improved by pre-processing the images in the
original dataset, use a better augmentation procedure,
and training the networks with different parameters
(increasing the number of epochs, for example).
5 CONCLUSIONS
In this article, we tested the influence of clustering
methods on the classification of chest X-ray image.
We used three clustering techniques (with different
underlying distances) to reduce the training set. In the
same time, these unsupervised algorithms increased
the training set’s coherence, by deleting the
inconsistent information. The feature extraction
process was carried out with well-known CNNs,
trained on the original dataset, with standard
parameters. Linear SVMs, Random Forest and CNN
methods provided the classification results. This
blend of unsupervised with supervised learning
computed better accuracy results on the Kermany
dataset.
We intend to test this method on other datasets
and with other clustering techniques. A
pre-processing step can be added to the images in the
dataset (histogram equalization, contrast
enhancement, noise reduction) to improve the
classification results. The method we presented tends
to ignore the outliers, the non-standard CXR images.
In order to address this problem, we plan to
investigate the reformulation of this problem as a 3 or
4-class problem, by also using the images that now
we eliminate from the training set, hoping to include
in this new classes the atypical cases.
REFERENCES
Lee, J. E., Kim, T. H., Cho, K. H., Han, K. T., & Park, E.
C. (2017). The association between number of doctors
per bed and readmission of elderly patients with
pneumonia in South Korea. BMC health services
research, 17(1), 1-11.
Combined Unsupervised and Supervised Learning for Improving Chest X-Ray Classification
481

Caseneuve, G., Valova, I., LeBlanc, N., & Thibodeau, M.
(2021). Chest X-Ray Image Preprocessing for Disease
Classification. Procedia Computer Science, 192, 658-
665.
Khan, W., Zaki, N., & Ali, L. (2021). Intelligent pneumonia
identification from chest x-rays: A systematic literature
review. IEEE Access, 9, 51747-51771.
Çallı, E., Sogancioglu, E., van Ginneken, B., van Leeuwen,
K. G., & Murphy, K. (2021). Deep learning for chest X-
ray analysis: A survey. Medical Image Analysis, 72,
102125.
Li, Y., Zhang, Z., Dai, C., Dong, Q., & Badrigilan, S.
(2020). Accuracy of deep learning for automated
detection of pneumonia using chest X-ray images: a
systematic review and meta-analysis. Computers in
Biology and Medicine, 123, 103898.
Ayan, E., & Ünver, H. M. (2019, April). Diagnosis of
pneumonia from chest X-ray images using deep
learning. In 2019 Scientific Meeting on Electrical-
Electronics & Biomedical Engineering and Computer
Science (EBBT) (pp. 1-5). Ieee.
Sharma, H., Jain, J. S., Bansal, P., & Gupta, S. (2020,
January). Feature extraction and classification of chest
x-ray images using cnn to detect pneumonia. In 2020
10th International Conference on Cloud Computing,
Data Science & Engineering (Confluence) (pp. 227-
231). IEEE.
Kermany, D., Zhang, K. G. M., & Goldbaum, M. Large
dataset of labeled optical coherence tomography (OCT)
and chest x-ray images, Mendeley data, v3 (2018).
Hammoudi, K., Benhabiles, H., Melkemi, M., Dornaika, F.,
Arganda-Carreras, I., Collard, D., & Scherpereel, A.
(2021). Deep learning on chest X-ray images to detect
and evaluate pneumonia cases at the era of COVID-19.
Journal of medical systems, 45(7), 1-10.
Mabrouk, A., Díaz Redondo, R. P., Dahou, A., Abd Elaziz,
M., & Kayed, M. (2022). Pneumonia Detection on
Chest X-ray Images Using Ensemble of Deep
Convolutional Neural Networks. Applied Sciences,
12(13), 6448.
Kundu, R., Das, R., Geem, Z. W., Han, G. T., & Sarkar, R.
(2021). Pneumonia detection in chest X-ray images
using an ensemble of deep learning models. Plos one,
16(9), e0256630.
Chouhan, V., Singh, S. K., Khamparia, A., Gupta, D.,
Tiwari, P., Moreira, C., ... & De Albuquerque, V. H. C.
(2020). A novel transfer learning based approach for
pneumonia detection in chest X-ray images. Applied
Sciences, 10(2), 559.
Zhang, Dejun, Fuquan Ren, Yushuang Li, Lei Na, and Yue
Ma. "Pneumonia detection from chest X-ray images
based on convolutional neural network." Electronics
10, no. 13 (2021): 1512.
Tan, P. N., Steinbach, M., & Kumar, V. (2019).
Introduction to data mining. Pearson Education India,
2
nd
ed.
Landau, S., Leese, M., Stahl, D., & Everitt, B. S. (2011).
Cluster analysis. John Wiley & Sons, 5
th
ed.
Wierzchoń, S. T., & Kłopotek, M. A. (2018). Modern
algorithms of cluster analysis (Vol. 34). Springer
International Publishing.
He, K., Zhang, X., Ren, S., & Sun, J. (2016). Deep residual
learning for image recognition. In Proceedings of the
IEEE conference on computer vision and pattern
recognition (pp. 770-778).
Simonyan, K., & Zisserman, A. (2014). Very deep
convolutional networks for large-scale image
recognition. arXiv preprint arXiv:1409.1556.
Szegedy, C., Vanhoucke, V., Ioffe, S., Shlens, J., & Wojna,
Z. (2016). Rethinking the inception architecture for
computer vision. In Proceedings of the IEEE
conference on computer vision and pattern recognition
(pp. 2818-2826).
Chollet, F. (2017). Xception: Deep learning with depthwise
separable convolutions. In Proceedings of the IEEE
conference on computer vision and pattern recognition
(pp. 1251-1258).
Huang, G., Liu, Z., Van Der Maaten, L., & Weinberger, K.
Q. (2017). Densely connected convolutional networks.
In Proceedings of the IEEE conference on computer
vision and pattern recognition (pp. 4700-4708).
Sandler, M., Howard, A., Zhu, M., Zhmoginov, A., & Chen,
L. C. (2018). Mobilenetv2: Inverted residuals and linear
bottlenecks. In Proceedings of the IEEE conference on
computer vision and pattern recognition (pp. 4510-
4520).
Zhang, X., Zhou, X., Lin, M., & Sun, J. (2018). Shufflenet:
An extremely efficient convolutional neural network
for mobile devices. In Proceedings of the IEEE
conference on computer vision and pattern recognition
(pp. 6848-6856).
VISAPP 2023 - 18th International Conference on Computer Vision Theory and Applications
482
