
A Convolutional Neural Network Based Patch Classifier Using
Mammograms
Yumnah Hasan
1 a
, Aidan Murphy
2 b
, Meghana Kshirsagar
1 c
and Conor Ryan
1 d
1
Biocomputing and Developmental Systems Lab, University of Limerick, Ireland
2
Department of Computer Science, University College Dublin, Ireland
Keywords:
Convolutional Neural Networks, Breast Cancer, Patch Extraction, Image Pre-Processing, Deep Learning.
Abstract:
Breast Cancer is the most prevalent cancer among females worldwide. Early detection is key to good prog-
nosis and mammography is the most widely-used technique, particularly in screening programs. However,
mammography is a highly-skilled and often time-consuming task. Deep learning methods can facilitate the
detection process and assist clinicians in disease diagnosis. There has been much research showing Deep Neu-
ral Networks’ successful use in medical imaging to predict early and accurate diagnosis. This paper proposes a
patch-based Convolutional Neural Network (CNN) classification approach to classify patches (small sections)
obtained from mammogram images into either benign or malignant cases. A novel patch extraction approach
method, which we call Overlapping Patch Extraction, is developed and compared with the two different tech-
niques, Non-Overlapping Patch Extraction, and a Region-Based-Extraction. Experimentation is conducted
using images from the Curated Breast Imaging Subset of Digital Database for Screening Mammography. Five
deep learning models, three configurations of EfficientNet-V2 (B0, B2, and L), ResNet-101, and MobileNet-
V3L, are trained on the patches extracted using the discussed methods. Preliminary results indicate that the
proposed patch extraction approach, Overlapping, produces a more robust patch dataset. Promising results are
obtained using the Overlapping patch extraction technique trained on the EfficientNet-V2L model achieving
an AUC of 0.90.
1 INTRODUCTION
Machine learning (ML) plays a significant role in
computer-aided diagnosis (CAD) systems to provide
early and accurate results in different areas of med-
ical imaging. Continuous advancements in ML are
making remarkable contributions to clinical decision
support systems, diagnostic reasoning, automatic de-
tection of disease, and classification of cases.
Deep Learning is a sub-field of ML influenced
by artificial neural networks (ANN), which, in turn,
were inspired by human brain functions and forma-
tion. Convolutional Neural Networks (CNN) provide
models to learn from the data just like human brain
structures. In the area of cancer research, CNNs have
been successfully used for the automated classifica-
tion of breast cancer from mammographic images, a
very challenging task owing to the fine-grained vari-
a
https://orcid.org/0000-0001-9310-8886
b
https://orcid.org/0000-0002-6209-4642
c
https://orcid.org/0000-0002-8182-2465
d
https://orcid.org/0000-0002-7002-5815
ability in the appearance of breast lesions (Mahmood
et al., 2022).
Image resolution plays an important role in the
performance of CNN because high dimensional im-
age results in more trainable features. However,
high-resolution images are computationally expen-
sive to process in CNNs due to the memory limita-
tions of Graphical Processing Units (GPUs). There-
fore, downsizing is required, which results in the loss
of discriminative features. One feasible approach
to overcome this challenge is to develop a classi-
fier trained on high-resolution image patches, i.e.,
relatively small sections of the whole image, which
can then preserve the maximum information encoded
within the patch.
This research aims to develop a patch extrac-
tion method that resolves the need for full images
to train a CNN. The proposed patch extraction tech-
nique, which we call Overlapping Patch Extraction,
is compared against two different patch extraction ap-
proaches, a Non-overlapping Patch Extraction and
a Region-Based-Extraction (RBE) approach. RBE
Hasan, Y., Murphy, A., Kshirsagar, M. and Ryan, C.
A Convolutional Neural Network Based Patch Classifier Using Mammograms.
DOI: 10.5220/0011790800003393
In Proceedings of the 15th International Conference on Agents and Artificial Intelligence (ICAART 2023) - Volume 3, pages 869-876
ISBN: 978-989-758-623-1; ISSN: 2184-433X
Copyright
c
2023 by SCITEPRESS – Science and Technology Publications, Lda. Under CC license (CC BY-NC-ND 4.0)
869

is currently the state-of-the-art method used in re-
search. Five deep-learning models are trained to ana-
lyze the efficiency of the proposed method. All mod-
els are trained on the Curated Breast Imaging Sub-
set of the Digital Database for Screening Mammog-
raphy (CBIS-DDSM) dataset. The EfficientNet-V2L
trained on our patch extraction method results in an
Area Under the Curve (AUC) of 0.90 outperforming
the other two approaches in this paper.
This paper is organized as follows: the back-
ground is described in Section 2, and the details of the
suggested methodology are covered in Section 3. The
experimental details are covered in Section 4. The
conclusion and future implications are presented in
Section 5.
2 LITERATURE SURVEY
There has been substantial research on image classi-
fication using DL techniques, among these are excep-
tional results attained from CNN models on breast
cancer classification. This section provides insight
into significant work done using full images followed
by patches for training a robust classifier.
2.1 Classification Using Whole Image
The use of full mammography images has been shown
to yield impressive results. A notable example (Al-
Antari et al., 2020) proposed a novel CAD system
that detects and classifies breast cancer using an entire
mammogram. Three modified DL models are imple-
mented namely regular feedforward CNN, ResNet-
50, and InceptionResNet-V2. The best results are
attained using InceptionResNet-V2 classifier with an
overall accuracy of 97.50% on the DDSM dataset.
They (Zahoor et al., 2022) used fine-tuned
MobileNet-V2 and Nasnet Mobile to extract deep fea-
tures from the full mammograms. The Modified En-
tropy Whale Optimization Algorithm (MEWOA) was
used to optimize extracted features. Finally, images
are classified into benign and malignant using ma-
chine learning classifiers. The maximum accuracy
achieved for INBreast, MIAS and CBIS-DDSM are
99.7%, 99.8% and 93.8% respectively.
A Deep one-stage U-Net model was proposed
by (Soulami et al., 2021) for semantic segmentation
and classification of mammograms achieving an AUC
of 0.998 for both INbreast and DDSM. They trained
the model from scratch using full images and did not
use any pre-trained weights.
Despite these excellent results, these approaches
have many drawbacks, such as the need for a large
amount of annotated training data required which
is presently limited. Moreover, as the amount of
data increased the computational cost and time also
increased. Using lower-resolution images is one
method to shrink the size of the dataset used. How-
ever, low-contrast input images used for training the
classifier are more likely to result in low accuracy.
Therefore, methods are explored which reduce the
need for a huge amount of data as well as compu-
tationally efficient.
2.2 Classification Using Patches
Patch-based classifiers offer an attractive alternative
to the use of full-sized images. The patch is a sub-
section of the whole image. In patch-wise training,
small patches are constructed and processed individ-
ually. The advantages include high-resolution im-
ages that can be processed more quickly when they
are divided into small patches. Moreover, computa-
tional cost can be significantly decreased when small
patches are processed, compared to the whole image.
Much research has been conducted in this area.
In (El Houby and Yassin, 2021), two DNN-based
models were created. The first was a patch classi-
fier for the Region Of Interest (ROIs), while the sec-
ond was a whole image classifier. The patches were
extracted from the INBreast dataset, which was an-
notated and diagonal extreme points of breast lesions
were present. According to the given points (Xmin,
Ymin) and (Xmax, Ymax), the bounding box around
the ROI was created and cropped for patch extraction.
A sliding window approach (Agarwal et al., 2019)
was used to scan the whole image and extract the
patches using a stride (56 × 56) which determines
the minimum overlap between the two consecutive
patches. Data labelling was performed based on the
central pixel value of patches. Using the annotated la-
bels of ROI if the central pixel of the patch lies inside
the mass it has been taken as a positive label if not
it is assigned as a negative label. They used benign
and malignant masses from the CBIS-DDSM dataset,
from where first positive patches were extracted, and
then randomly an equal number of negative patches
were extracted. Their proposed results for patch clas-
sifiers using the Inception-V3 model produced a test
accuracy of 84.16%.
In (Yu et al., 2020), a deep fusion model was
developed to perform image classification using
the Mammographic Image Analysis Society (MIAS)
dataset that contains a small set of mammographic
images. Training a deep model using a small sam-
ple set is challenging. Hence, they used a patch-based
approach to solve this problem. ROIs were extracted
ICAART 2023 - 15th International Conference on Agents and Artificial Intelligence
870
from the images using preprocessing techniques. Af-
terwards, random patches were extracted around each
ROI of size 72 × 72. They used two classes, benign
and malignant for classification and the best results
obtained from their proposed model-1 VGG-16 Fu-
sion 1 reveal an accuracy of 89.06%.
(Shen et al., 2019) presents a patch classifier
based end-to-end training approach. Original images
were downsized to meet the limited GPU memory
space. They created two subsets of patch datasets re-
ferred to as S1 and S10. The S1 patches were ex-
tracted from the centre of ROI, while the S10 patches
were extracted randomly around the ROI with a mini-
mum overlapping ratio between ROI and background
area set to 0.9. All the patches of size 224 × 224
are extracted. For the patch classifier, they used the
CBIS-DDSM dataset and achieved the best results
from the pre-trained ResNet-50 model having an ac-
curacy of 0.89. They used five classes for the classifi-
cation task: benign mass, malignant mass, benign cal-
cification, malignant calcification, and background.
(Petrini et al., 2022) created a patch classifier
that to develop a single and two-view whole image
classifier. Their patch extraction approach is inspired
by (Shen et al., 2019). They applied two differ-
ent test configurations of the dataset that include 5-
fold cross-validation (CV) and original division (OD).
They used five classes, the same as (Shen et al.,
2019). The highest accuracy of the patch classifier for
the OD dataset obtained is 75.54% using EfficientNet-
B0.
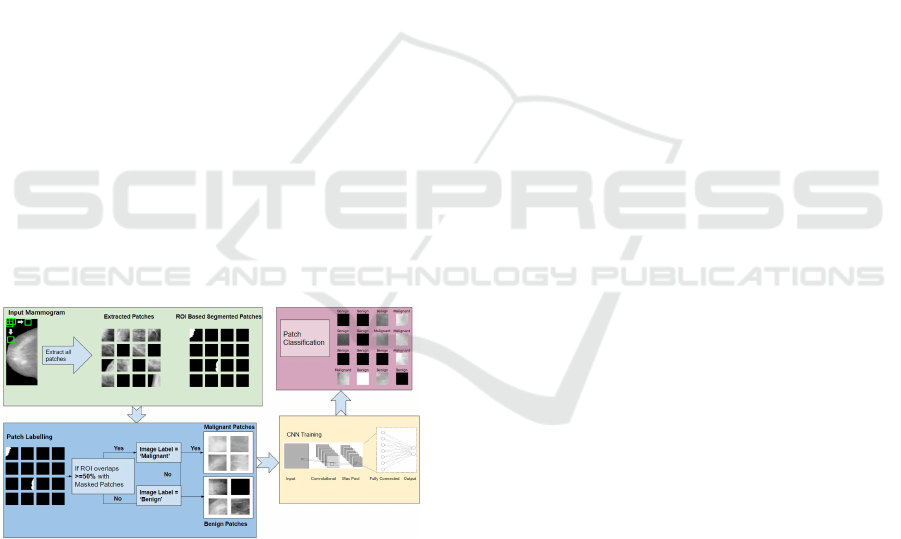
Figure 1: Pipeline of the entire process from patch extrac-
tion to tumor classification.
3 METHODOLOGY
The proposed framework in Figure 1 is divided into
the following stages. In the first step, data is pre-
processed as discussed in Section 3.1 to remove the
additional noise and artefacts; otherwise, these un-
desirable objects negatively affect a model’s accu-
racy. Secondly, patches are extracted from the pre-
processed dataset and labelled according to the an-
notations provided in the dataset. Finally, five CNN
models are trained and evaluated on the test dataset to
compare the performance. We compare our proposed
method, Overlapping Patch Extraction, described in
Section 3.4, to two other methods, Non-overlapping
Patch Extraction and RBE, described in Sections 3.3
and 3.2, respectively.
3.1 Pre-Processing
Image pre-processing is the most important part of
designing an efficient CAD system. In this step, un-
wanted objects such as annotations and noise are re-
moved from the images. In this research, the follow-
ing pre-processing steps are applied to enhance the
quality of images:
• Images are converted from the DICOM format
(generally used for medical images as they can
contain rich meta-data) and converted to the
Portable Network Graphic (PNG) format.
• Otsu thresholding (Otsu, 1979), is applied to sep-
arate the foreground pixels from the background.
• Artefacts are removed by using contour detection.
To do this, the binarised version of the image is
evaluated to find the largest contour. Next, the
maximum area of the connected region is iden-
tified and all the other small and residual regions
are eliminated.
• Images are cropped by removing additional back-
ground areas to increase the recognition rate.
3.2 Region-Based-Extraction
The developed RBE technique (Shen et al., 2019) is
implemented in this study to extract patches in which
mammograms are first downsized to 1152×896 using
the interpolation technique. Images are pre-processed
as described previously to remove the noise and arte-
facts. The rectangular area around the contour is se-
lected and defined as the ROI for patch extraction.
Ten patches of size 224 × 244 are extracted randomly
around the ROI. The overlapping ratio is between 0.5
to 0.9. If there is no ROI present in the case of a be-
nign image, then ten patches are extracted from any-
where within the image. Labels of benign and malig-
nant patches are assigned according to the annotation
provided in the dataset. Patches containing more than
50% black pixels are ignored and not included in the
training set. The benign patches are higher in quan-
tity than the malignant patches, so sampling is used
to resolve the imbalance of data problem. The total
A Convolutional Neural Network Based Patch Classifier Using Mammograms
871

training patches of benign and malignant used in this
work are 11828.
3.3 Non-Overlapping Patch Extraction
In this method, images are resized and sliced into
equal size patches. The patch size of 256 × 256 is
selected and a total of 16 patches per image are ex-
tracted. No overlapping is taken into consideration
during the extraction. The labelling of patches is per-
formed on the threshold if more than 70% of ROI is
overlapped with the patch then it is labelled as ma-
lignant; otherwise patch is labelled as benign. From
this approach, the number of benign patches for train-
ing is 12099 while, for malignant patches, there are
only 926, giving quite an unbalanced set. To reduce
the number of benign patches, those containing more
than 90% black pixels were removed.
3.4 Proposed Method: Overlapping
Patch Extraction
The CBIS-DDSM dataset contains lesions for each
category of images i.e benign or malignant. The seg-
mented binary masks are also present and are used to
differentiate between the background and the cancer-
ous region. This research proposes a novel approach
to extracting patches from the whole image. The im-
ages are not downsized to retain the maximum infor-
mation from the original sample. Our method auto-
matically extracts patches from the images using im-
age height, “ImgH”, and width, “ImgW”, as key at-
tributes. Thus, for a sliding window of size 224×224,
WinH and WinW are the window height and window
width respectively. It is used to scan the full image
to extract the patches. It scans the image from the
top leftmost area of the image to the bottom right-
most area with a stride of size S= 56 × 56. StrH is
taken as the stride height and StrW is defined as the
stride width. After scanning the whole row it goes to
the next row with the same stride size and continues
until all the image is scanned. In this way, with the
scanning operation on the whole image, we are able
to extract the maximum patches per image. The equa-
tions below show the mathematical form of the entire
process.
TotalRows(R) =
x=n
∑
x=0
R =
(ImgH −WinH)
StrH
(1)
TotalColumns(C) =
x=n
∑
x=0
C =
(ImgW −WinW )
StrW
(2)
TotalPatches(P) =
x=n
∑
x=0
P = R ∗C (3)
where R and C are the numbers of rows and columns
from 0 to the nth pixel in the image are used to calcu-
late the number of patches per image. It is important
to mention that patch, 224 × 224, is selected due to
the fact that smaller patches do not contain enough
information to extract the unique features. On the
other hand, a large patch size will increase the com-
putational cost and time for training. Therefore, the
most appropriate size was found after performing ex-
perimentation on different patch sizes of 128 × 128,
64 × 64, and 512 × 512.
To label, the image annotations are used from the
given CSV file. The segmented ROI mask of the cor-
responding image is used to assigned the labels. If the
patch contains more than 50% of ROI it is labelled as
malignant otherwise, declared as benign. First malig-
nant patches are extracted and then the benign patches
are sampled out to minimize the difference between
the number of malignant and benign patches. To in-
crease the number of patches for training the DL mod-
els, data augmentation is used. The patches are ran-
domly selected and then one of the operations includ-
ing vertical flip, horizontal flip, crop, and rotated is
performed.
4 EXPERIMENTAL DETAILS
We chose five CNN models to test the performance
of the processed technique: EfficientNet-V2B0,
EfficientNet-V2B2, EfficientNet-V2L, ResNet-101,
and MobileNet-V3L. Pretrained weights of ImageNet
are used to fine-tune all five models. These mod-
els were chosen based on their performance in pre-
vious works that used the same dataset as ours. As
discussed in the literature, these architectures were
shown to have a high train/test accuracy. In addition,
they are faster to train and computationally efficient.
4.1 Dataset Preparation
The dataset used in this paper was developed by
(Lee et al., 2017). It is a publicly available updated
and standardized version of (DDSM). The images are
compressed to 5000 × 3000 pixels and converted into
Digital Imaging and Communications in Medicine
(DICOM) format. The verified pathological informa-
tion is present in CSV files for three different cate-
gories: normal, benign, and malignant. The database
contains full mammograms, ROI, masses, and calci-
fication for both benign and malignant. In this work,
only mass images are used for training and testing.
ICAART 2023 - 15th International Conference on Agents and Artificial Intelligence
872

There is a total of 1318 images of full mammograms
for training, while for testing 378 images are present.
For training, 681 benign and 637 malignant images
are used, while 231 and 147 images are processed for
testing. The details are present in Table 1.
Table 1: CBIS-DDSM Dataset details used for patch extrac-
tion.
Category Training Testing Total
Benign 681 231 912
Malignant 637 147 784
Table 2: Details of patches used for training and testing (B=
Benign, M= Malignant, Tr= training patches, Ts= testing
patches and Tr Ag= Augmented training patches).
B M Tr Ts Tr Ag
Overlapping
X 968 454 1936
X 1525 454 3050
Non-Overlapping
X 12099 454 -
X 926 454 -
Region-Based-Extraction
X 5914 1465 -
X 5914 1465 -
4.2 Training Setup
There are five CNN models selected for the eval-
uation of the proposed approach that includes
EfficientNet-V2L, EfficientNet-V2B0, EfficientNet-
V2B2, ResNet-101, and MobileNet-V3L. They are
initially trained on the ImageNet dataset with in-
put dimensions 224 × 224 × 3. The three dimen-
sions indicate red, blue, and green channels. How-
ever, patches extracted from the mammograms con-
tain only a single channel i.e grey level, so all the
patches of size 224 × 224 × 1 are then converted into
three-dimensional channels to construct compatible
input patches that can be given as input to the pre-
trained CNN models. For training, we divide the
dataset into training and validation, using the pre-
trained weights of ImageNet for training. The number
of iterations taken to process the dataset is defined as
the epochs and the validation set is used to determine
the level of performance after each epoch. The train-
ing hyperparameters are fixed for all five models. The
change in the model’s response after each epoch to-
wards the estimated error is determined by the learn-
ing rate (LR). The value of LR is 10e-4, which is the
same for all five models. Adam, inspired by the Adap-
tive moment estimation, is an efficient stochastic de-
scendent gradient optimizer used in the training as it
takes only first-order gradients with reduced memory
requirements. A batch size of 16 has been opted for
because a larger batch size can reduce the learner’s
ability to generalize (Keskar et al., 2016) leading to a
model becoming stuck in a local minimum. A lower
batch size helps the model to find global minima.
All the experiments are performed on Google Colab
Pro+.
The number of patches used for training the mod-
els by using methods Overlapping Patch Extraction,
Non-Overlapping Patch Extraction, and RBE are pro-
vided in Table 2. Here, for the first experiment, Non-
Overlapping training patches are used. For the sec-
ond experiment patches are extracted from the Over-
lapping Patch Extraction technique without augmen-
tation images are trained. The third experiment uses
Overlapping Patch Extraction with the augmented
dataset. In the final experiment, extracted patches
from the RBE technique are used to evaluate CNN
models. The details of experiments performed during
the training are listed below:
• Experiment No. 1 using Non-Overlapping
Patch Extraction: Equal-size patches of 256 ×
256 are extracted and used to generate a training
patches dataset. Downsized images are used with
equal stride sizes to take only non-overlapping
patches. No data augmentation is performed dur-
ing the training and original patches are used to
train the five CNN models. The training model
consists of a feature extractor as the backbone
that connects to the global average pooling layer.
Afterwards, it is followed by one hidden layer
and one softmax layer as the output. The model
is trained with categorical cross-entropy loss and
Adam optimizer. The dropout rate is taken at 0.2.
• Experiment No. 2 using Overlapping Patch Ex-
traction: Patches are extracted from the mammo-
graphic images of the 4921 × 2085 input shape.
The optimal patch size of 224 × 224 is used to
extract patches with a stride of 56x56. Overlap-
ping patches are used during the slicing of the im-
age. To reduce the computational cost and pre-
serve the maximum information by using the orig-
inal size of the input image these patches are con-
sidered. During the training data augmentation
pipeline is defined including flip, rotate, and crop
to augment the patches at each epoch. Therefore,
more patches can be obtained to train a successful
model. There are 681 benign and 968 malignant
patches used for training. The model configura-
tions used in this experiment are the same as those
described in experiment no 1.
• Experiment No. 3 using Overlapping Patches:
Image scanning using a sliding window approach
is used to extract patches of size 224 × 224 with
a stride of size 56 × 56. There are 50% over-
lapping patches are taken to increase the number
A Convolutional Neural Network Based Patch Classifier Using Mammograms
873

of patches. The original dimension of the im-
age is used and no downsizing is performed to
retrain the maximum information within the im-
age. Data augmentation is performed exclusively
before training the patches. Each one of the four
different operations is selected randomly to aug-
ment the patch. In this way, a total of 1936 benign
patches and 3050 malignant patches are used for
training the models. The training model consists
of a feature extractor as the network’s backbone,
with a size of 224 × 224 × 3. The backbone con-
nects to the flattened layer and it is followed by
four hidden layers and one output layer i.e soft-
max layer. It is trained with the categorical cross-
entropy loss and Adam optimizer, and the dropout
rate is 0.2.
• Experiment No. 4 using RBE: Images are first
downsized to 1152 × 896 and then patches are ex-
tracted using RBE technique (Shen et al., 2019)
approach as discussed previously. Patches of size
224×224 are used for training the five CNN mod-
els. Data is not augmented explicitly before the
training as mentioned in the original paper. The
patches are augmented randomly during the train-
ing only using one arbitrary function containing
horizontal flip, vertical flip, crop or rotate. A to-
tal of 11828 training and 2930 testing patches are
used in this experiment. The training settings of
all the models and hyper-parameter details are the
same as mentioned in experiment no. 1.
5 RESULTS AND DISCUSSION
The performance of the proposed framework is mea-
sured by using the evaluation metrics parameters
which are accuracy, F-score, precision, AUC, and sen-
sitivity. System performance is measured by calculat-
ing the AUC. This is calculated by taking true posi-
tives, true negatives, and false negatives into consid-
eration. Accuracy is defined by equation 4, below.
Here, T
Pos
shows the actual malignant cases, and T
Neg
are lesions correctly diagnosed as benign. F
Pos
incor-
rectly classified benign regions as malignant and T
Neg
represents malignant lesions defined as benign.
A
cc
= (T
Pos
+ T
Neg
)/ (T
Pos
+ F
Neg
) + (F
Pos
+ T
Neg
)
(4)
The AUC shows how well a model can discrim-
inate between benign and malignant cases. The re-
ceiver operating characteristic (ROC) curve values are
summoned to one. The graph is plotted between the
true-positive rate (TPR) and false-positive (FPR) rate.
The relation of TPR and FPR is known as sensitivity
(recall) and is provided in the below equation 5:
Sensitivity = (T
Pos
)/ (T
Pos
) + (F
Neg
) (5)
The precision is an integral property that describes
the ratio of positive predicted cases against all the ac-
tual positive cases. By reducing the FPR rate, high
accuracy can be achieved. It is defined by the follow-
ing equation 6:
Precision = (T
Pos
)/ (T
Pos
) + (F
Pos
) (6)
The collective mean of precision and recall defines
the successful score of the model performance on the
test dataset. The F-Score is calculated by the follow-
ing equation 7:
F-score = 2 ∗
T
Pos
T
Pos
+F
Pos
∗
T
Pos
T
Pos
+F
Neg
T
Pos
T
Pos
+F
Pos
+
T
Pos
T
Pos
+F
Neg
(7)
The ratio of the number of predicted negatives
with all the actual negatives is defined by the follow-
ing equation 8 known as specificity:
Speci f icity =
T
Neg
(T
Neg
+ F
Pos
)
(8)
The proposed patch extraction method discussed
in this paper is based on the sliding window approach
of patch size 224 × 224 and is shown to improvise ac-
curacy over existing patch extraction methods. Three
patch extraction approaches are compared to identify
the best-performing method for onward model train-
ing. Moreover, the modified architecture of the CNN
model is used and provides the highest AUC, 0.90, by
using the EfficientNet-V2L architecture. The results
reveal that our proposed model successfully classi-
fies the breast mass’s ROIs into malignant and benign
categories. Four experiments are performed to find
the best model using three different patch extraction
methods.
The overall best performing model from the Over-
lapping method using an augmented database, de-
scribed in experiment no. 3, was EfficientNet-V2L
having precision, F1, Sensitivity, and specificity of
0.90, 0.90, 0.91, and 0.88, respectively, as shown in
Table 3 model A. When using this approach but with-
out augmentation, experiment no. 2, on the training
database, EfficientNet-V2L achieves precision=0.89,
F1=0.89, sensitivity=0.91, and specificity=0.87 as
given in Table 3 model B. Non-Overlapping men-
tioned in the experiment no. 1 showed the lowest pre-
cision, F1, accuracy, sensitivity, and specificity val-
ues, with 0.81, 0.58, 0.55, 0.10, and 0.99 respec-
tively, see Table 3 model C. Since augmentation is not
making a significant difference in the accuracy of the
model, results from the Non-Overlapping method are
extremely poor. Therefore, no augmentation is per-
formed for this method.
ICAART 2023 - 15th International Conference on Agents and Artificial Intelligence
874
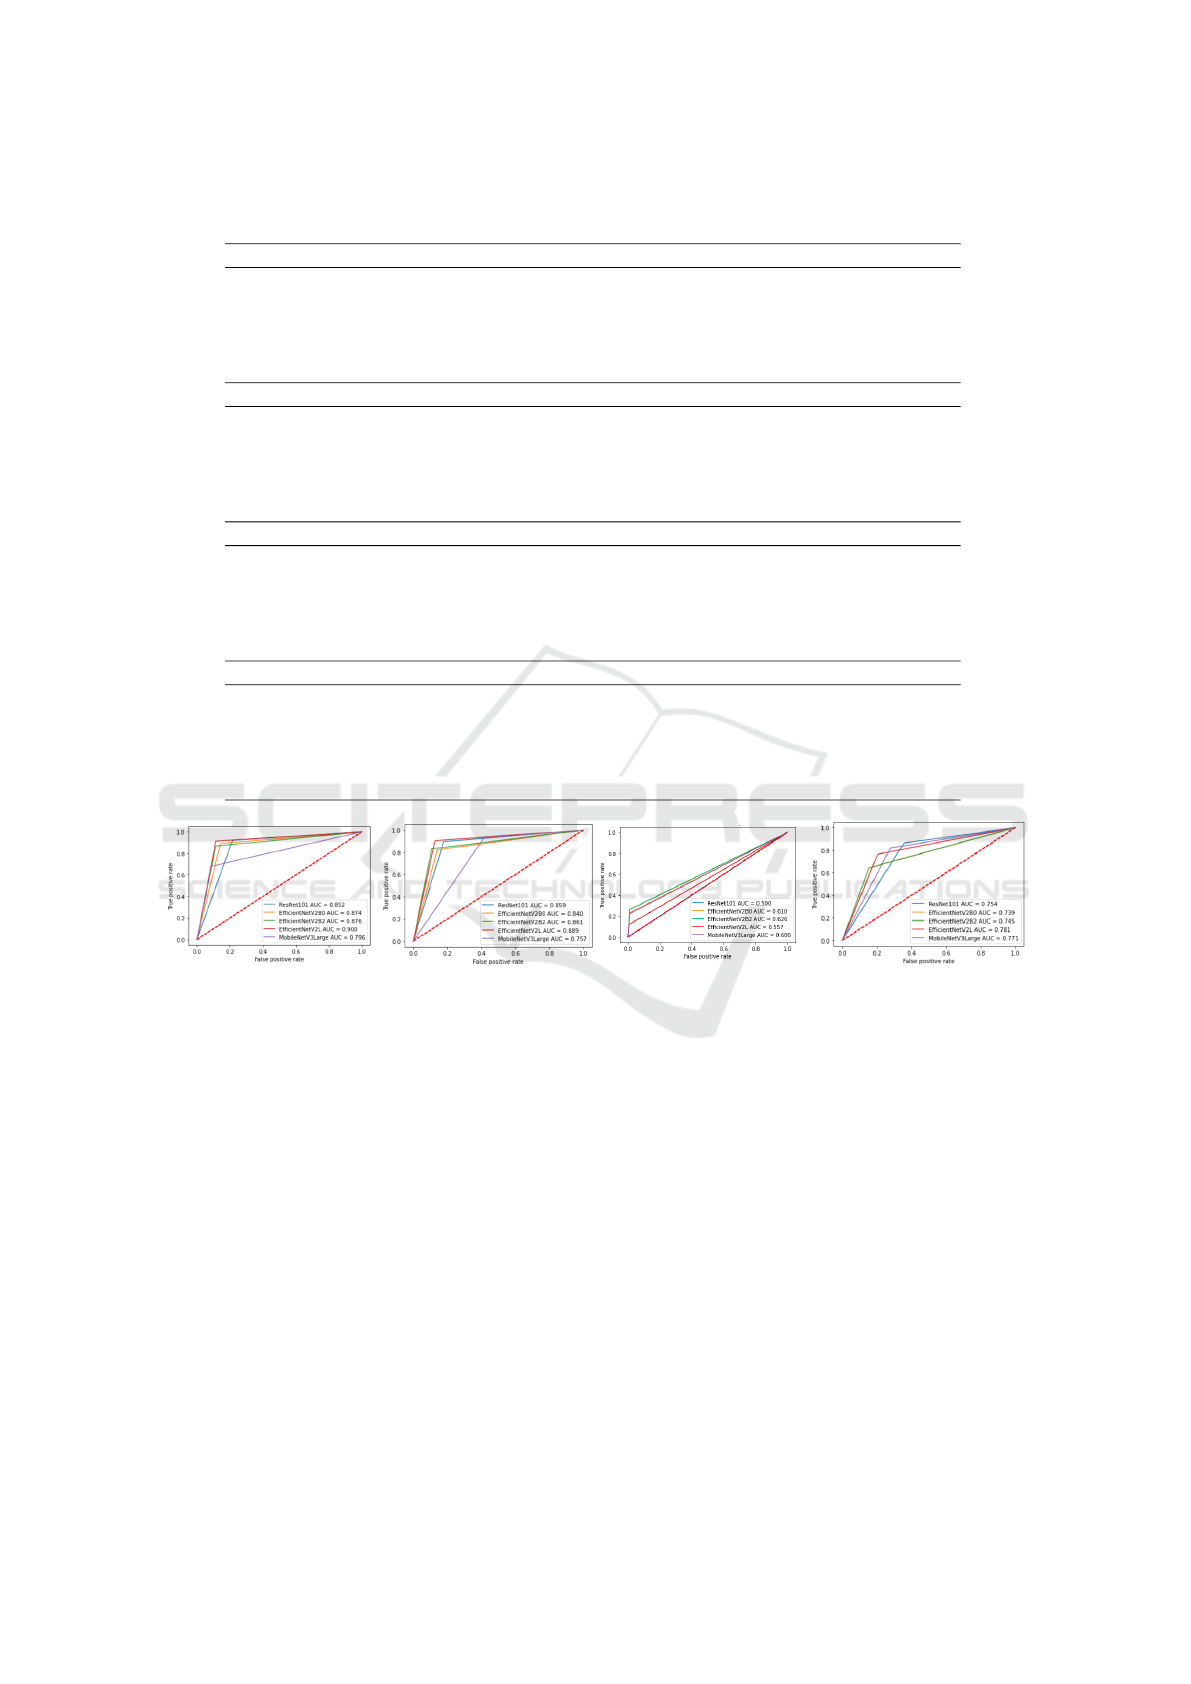
Table 3: Results of Models (A) Augmented Overlapping Patch Extraction (B) Non-Augmented Overlapping Patch Extraction
(C) Non-Overlapping Patch Extraction (D) Region-Based-Extraction.
Model A Precision F1 AUC Accuracy Sensitivity Specificity
EfficientNet-V2B2 0.88 0.88 0.87 0.87 0.86 0.88
ResNet-101 0.86 0.85 0.85 0.85 0.92 0.78
EfficientNet-V2B0 0.87 0.87 0.87 0.87 0.89 0.85
MobileNet-V3L 0.81 0.80 0.79 0.79 0.68 0.91
EfficientNet-V2L 0.90 0.90 0.90 0.90 0.91 0.88
Model B Precision F1 AUC Accuracy Sensitivity Specificity
EfficientNet-V2B2 0.84 0.84 0.84 0.84 0.82 0.85
ResNet-101 0.86 0.86 0.85 0.86 0.90 0.82
EfficientNet-V2B0 0.86 0.86 0.86 0.86 0.83 0.89
MobileNet-V3L 0.79 0.75 0.75 0.76 0.93 0.58
EfficientNet-V2L 0.89 0.89 0.88 0.88 0.91 0.87
Model C Precision F1 AUC Accuracy Sensitivity Specificity
EfficientNet-B2V2 0.77 0.67 0.62 0.62 0.26 0.99
ResnNet-101 0.47 0.49 0.50 0.50 0.00 1.00
EfficientNet-V2B0 0.77 0.65 0.61 0.61 0.22 0.99
MobileNet-V3L 0.74 0.64 0.60 0.60 0.22 0.98
EfficientNet-V2L 0.81 0.58 0.55 0.54 0.10 0.99
Model D Precision F1 AUC Accuracy Sensitivity Specificity
EfficientNet-V2B2 0.76 0.75 0.74 0.75 0.64 0.84
ResNet-101 0.77 0.75 0.75 0.75 0.86 0.64
EfficientNet-V2B0 0.75 0.74 0.73 0.74 0.65 0.82
MobileNet-V3L 0.77 0.77 0.77 0.77 0.81 0.72
EfficientNet-V2L 0.78 0.78 0.78 0.78 0.76 0.79
(a) (b) (c) (d)
Figure 2: ROC analysis (a) Augmented Overlapping Patch Extraction (b) Non Augmented Overlapping Patch Extraction (c)
Non-Overlapping Patch Extraction technique (d) RBE state-of-the-art method.
We also tested RBE using experiment no. 4 in this
paper, and the results in Table 3 model D reveal the
low performance of all five CNN models using this
technique. The maximum precision is 0.78, sensitiv-
ity reaches 0.76, F1 is 0.78, and specificity is 0.79.
Recall that AUC and accuracy are 0.78, noted on the
EfficientNet-V2L model. The test dataset is created
separately for this approach because the images are
downsized initially, as described in the existing pa-
per. In the other two approaches, patches are extracted
from the full-size images.
The proposed framework using the Overlapping
technique with an augmented database trained on
the EfficientNet-V2L architecture reveals the high-
est AUC of 0.90 when tested using the CBIS-DDSM
dataset as shown in Figure 2(a). A decrement in the
AUC is observed with the same Overlapping method
when used without an augmented dataset. The highest
AUC is 0.88 noted by using EfficientNet-V2L can be
seen in Figure 2(b). RBE technique reveals mediocre
results. Figure 2(d) shows the maximum AUC of 0.78
is achieved from the EfficientNetV2L model. The
worst results are obtained from the Non-Overlapping
technique, and the AUC barely reaches 0.55 for the
same deep model as provided in Figure 2(c).
The proposed framework of patch-based CNN
training shows promising results; however, a direct
comparison with other proposed approaches is diffi-
cult as there are some differences in the testing sce-
narios. Results from the proposed method are com-
petitive and hold the potential to outperform the ex-
isting techniques when the same testing parameters
A Convolutional Neural Network Based Patch Classifier Using Mammograms
875

are applied.
6 CONCLUSION AND FUTURE
WORK
This study proposes a patch-based CNN model train-
ing technique to classify breast mammograms into be-
nign or malignant categories and test on a publicly
available dataset of mammograms, CBIS-DDSM,
which was used to classify cancerous and non-
cancerous regions. Our proposed system extracts
overlapping patches using the Overlapping Patch Ex-
traction method, and we compare them with the Non-
Overlapping Patch Extraction approach and Region-
Based-Extraction approach, which is state-of-the-art.
The state-of-the-art approach downsizes the images,
which may result in the loss of discriminative fea-
tures. However, full-size images are used in this work
for patch extraction. The patches are labelled based
on the threshold of ROI using the segmented masks.
The latest CNN models are explored to test the per-
formance of the proposed technique. In our suggested
Overlapping method, whole images are scanned using
the sliding window approach, and a patch database
is created for the training. The best results are ob-
tained using an augmented version of our proposed
approach, the Overlapping Patch Extraction method
trained on the EfficentNet-V2L architecture revealing
an AUC of 0.90.
In the future, a density-based patch extraction
technique can extract more informative patches that
help improve the model’s performance. Moreover,
Generative Adversarial Networks (GANS) can be
used to generate more synthetic data that can directly
contribute towards the successful training of DL mod-
els.
ACKNOWLEDGEMENTS
This work was conducted with the financial support of
the Science Foundation Ireland Centre for Research
Training in Artificial Intelligence under Grant No.
18/CRT/6223. Moreover, we would like to thank
Naveed Shahid and Allan de Lima for their immense
support.
REFERENCES
Agarwal, R., Diaz, O., Llad
´
o, X., Yap, M. H., and Mart
´
ı, R.
(2019). Automatic mass detection in mammograms
using deep convolutional neural networks. Journal of
Medical Imaging, 6(3):031409.
Al-Antari, M. A., Han, S.-M., and Kim, T.-S. (2020). Eval-
uation of deep learning detection and classification to-
wards computer-aided diagnosis of breast lesions in
digital x-ray mammograms. Computer methods and
programs in biomedicine, 196:105584.
El Houby, E. M. and Yassin, N. I. (2021). Malig-
nant and nonmalignant classification of breast le-
sions in mammograms using convolutional neural net-
works. Biomedical Signal Processing and Control,
70:102954.
Keskar, N. S., Mudigere, D., Nocedal, J., Smelyanskiy, M.,
and Tang, P. T. P. (2016). On large-batch training for
deep learning: Generalization gap and sharp minima.
arXiv preprint arXiv:1609.04836.
Lee, R. S., Gimenez, F., Hoogi, A., Miyake, K. K., Gorovoy,
M., and Rubin, D. L. (2017). A curated mammogra-
phy data set for use in computer-aided detection and
diagnosis research. Scientific data, 4(1):1–9.
Mahmood, T., Li, J., Pei, Y., Akhtar, F., Rehman, M. U.,
and Wasti, S. H. (2022). Breast lesions classifica-
tions of mammographic images using a deep convo-
lutional neural network-based approach. Plos one,
17(1):e0263126.
Otsu, N. (1979). A threshold selection method from gray-
level histograms. IEEE transactions on systems, man,
and cybernetics, 9(1):62–66.
Petrini, D. G., Shimizu, C., Roela, R. A., Valente, G. V.,
Folgueira, M. A. A. K., and Kim, H. Y. (2022).
Breast cancer diagnosis in two-view mammography
using end-to-end trained efficientnet-based convolu-
tional network. Ieee Access, 10:77723–77731.
Shen, L., Margolies, L. R., Rothstein, J. H., Fluder, E.,
McBride, R., and Sieh, W. (2019). Deep learning to
improve breast cancer detection on screening mam-
mography. Scientific reports, 9(1):1–12.
Soulami, K. B., Kaabouch, N., Saidi, M. N., and Tamtaoui,
A. (2021). Breast cancer: One-stage automated detec-
tion, segmentation, and classification of digital mam-
mograms using unet model based-semantic segmen-
tation. Biomedical Signal Processing and Control,
66:102481.
Yu, X., Pang, W., Xu, Q., and Liang, M. (2020). Mammo-
graphic image classification with deep fusion learn-
ing. Scientific Reports, 10(1):1–11.
Zahoor, S., Shoaib, U., and Lali, I. U. (2022). Breast can-
cer mammograms classification using deep neural net-
work and entropy-controlled whale optimization algo-
rithm. Diagnostics, 12(2):557.
ICAART 2023 - 15th International Conference on Agents and Artificial Intelligence
876
