
Application of Deep Learning to the Detection of Foreign Object Debris
at Aerodromes’ Movement Area
Jo
˜
ao Almeida, Gonc¸alo Cruz
a
, Diogo Silva
b
and Tiago Oliveira
c
Portuguese Air Force Academy Research Center, Sintra, Portugal
Keywords:
Foreign Object Debris, Computer Vision, Dataset, Image Classification, Object Detection.
Abstract:
This work describes a low-cost and passive system installed on ground vehicles that detects Foreign Object
Debris (FOD) at aerodromes’ movement area, using neural networks. In this work, we created a dataset
of images collected at an airfield to test our proposed solution, using three different electro-optical sensors,
capturing images in different wavelengths: i) visible, ii) near-infrared plus visible and iii) long-wave infrared.
The first sensor captured 9,497 images, the second 5,858, and the third 10,388. Unlike other works in this field,
our dataset is publicly available, and was collected accordingly to our envisioned real world application. We
rely on image classification, object detection networks and image segmentation networks to find objects in the
image. For classifier and detector, we choose Xception and YOLOv3, respectively. For image segmentation,
we tested several approaches based on Unet with backbone networks. The classification task achieved an AP
of 77.92%, the detection achieved 37.49% mAP and the segmentation network achieved 26.9% mIoU.
1 INTRODUCTION
In aviation, safety plays a fundamental role and pre-
vention is the preferred method to assure it. Foreign
Object Debris (FOD) are one of the biggest threats to
aircraft’s ground operation (Kraus and Watson, 2001).
In addition, the costs associated with FOD reach over
$5 billion globally every year (McCreary, 2010).
Aerodromes perform regular visual inspections to
the movement area every day to assure the safe circu-
lation of aircraft. However, modern radar and electro
optical-based systems, started to be implemented at
some major airports, These are capable of accurately
detecting FOD in a wide range of weather conditions,
yet, their cost implementation is a major downside to
aerodromes with less movements number.
In recent years, the advent of deep learning and
computer vision allowed the implementation of solu-
tions to tasks that before would require visual inspec-
tion by humans, bringing lower costs and near-human
accuracy. Works by (Cao et al., 2018) and (Han et al.,
2015a) reveal that the application of computer vision
to this problem is viable.
a
https://orcid.org/0000-0003-3496-3561
b
https://orcid.org/0000-0003-1557-3082
c
https://orcid.org/0000-0002-4922-8546
FOD Characterisation
The characterisation and definition of FOD are broad
since anything that should not be at the movement
area of an aerodrome is foreign to that place. In the
case of the Portuguese Air Force (PoAF), FOD are di-
vided into categories and types, classifying them ac-
cording to their source and material. However, dif-
ferent organisations describe FOD differently from
PoAF (PoAF, 2018).
The materials of the most commonly found ob-
jects are metal (60%) and rubber (19%) while 50% are
dark coloured. Tool pieces, ground equipment, pave-
ment debris and metal from unknown sources are the
objects with greater representation. In terms of size,
FOD can be catalogued in two major groups: clus-
ters of debris with individual size bellow 2 cm and
FOD individually larger than 2 cm (90%). Although
FOD are more prevalent on apron’s areas, most of
the strikes occur on runways and taxiways (McCreary,
2010), where the engine regimes and speed exponen-
tiate safety risks. The Australian Transport Safety Bu-
reau (ATSB, 2010), found that 11% of the FOD oc-
currences lead to wheel, engine and airframe damage.
Moreover, (McCreary, 2010), concluded that FOD
strikes occur 4.0 times per 10,000 movements, and
79% of those (3.2/10,000) inflicted damage to the air-
craft. In terms of repairing and replacing, FOD inflict
814
Almeida, J., Cruz, G., Silva, D. and Oliveira, T.
Application of Deep Learning to the Detection of Foreign Object Debris at Aerodromes’ Movement Area.
DOI: 10.5220/0011790600003417
In Proceedings of the 18th International Joint Conference on Computer Vision, Imaging and Computer Graphics Theory and Applications (VISIGRAPP 2023) - Volume 5: VISAPP, pages
814-821
ISBN: 978-989-758-634-7; ISSN: 2184-4321
Copyright
c
2023 by SCITEPRESS – Science and Technology Publications, Lda. Under CC license (CC BY-NC-ND 4.0)

an average cost of $10, 366 per strike. Regarding mil-
itary aviation, the risks associated with FOD are no
different from civil aviation. The aircraft which suffer
more from FOD damage are the ones with turbofan or
turbojet engines with air intakes placed lower(Warren
et al., 2005).
FOD Detection Systems
Although many airports still rely on the traditional
methods of detecting FOD, larger ones started to
implement radar and electro-optical solutions. Cur-
rently, a number of systems are available on the mar-
ket (FAA, 2018) and these can be divided in two:
fixed and mobile. Fixed systems provide continuous
surveillance and are installed either on the light fix-
tures of runways and taxiways or on towers near them.
Mobile systems, are installed on the back of vehicles
solely dedicated to that purpose, and must detect FOD
while moving, at least, at 30 km/h (FAA, 2009). The
accuracy of these systems is higher than 95% as reg-
ulated by the Federal Aviation Administration (FAA).
The two major downsides of these systems are their
acquisition and maintenance costs as well as the per-
missions required, making them difficult to install at
medium and small airports.
FOD Detection with Computer Vision
According to (Huang, 1996), computer vision aims
to develop computational models that imitate the hu-
man visual sensory system in order to develop au-
tonomous systems. These models have experienced
developments with larger databases of images, more
efficient computation hardware and especially the in-
troduction of more powerful machine learning algo-
rithms (Shapiro, 2020). The most relevant type of ma-
chine learning algorithms for computer vision in the
last decade are Neural Networks (NNs). NNs have en-
abled many new applications in computer vision and
FOD is no exception.
The first application of computer vision to FOD
detection was made with conventional methods such
as Local Binary Patterns (Han et al., 2015b) and His-
togram of Oriented Gradients (HOG), but these meth-
ods were not able to cope with background variation
(Cao et al., 2018). More recently, other authors em-
ployed object detection based on NN. In (Cao et al.,
2018) a framework for FOD detection is introduced
and is composed of two stages. The first is based on
a region proposal network and the second combines a
spatial transformer network with a classification net-
work. (Liu et al., 2018) also use a region proposal
network but now associated to Faster R-CNN and Fo-
cal Loss to improve the detection of small objects. (Li
and Li, 2020) on the other hand, follow a simpler ap-
proach, by using just a single stage detection network:
You Only Look Once v3 (YOLOv3). Despite the au-
thors claiming good results, their datasets and trained
models’ weights are not publicly available which lim-
its comparisons and even their applicability.
Paper Contributions and Organization
This paper contributes to the development of low-cost
FOD vision-based detection systems using ground ve-
hicles. In particular, a new image dataset (Almeida
et al., 2022) with FOD objects collected at an aero-
drome is made publicly available. The FOD object
selection for the dataset relied on FAA’s Advisory
Circular 150/5220-24 (FAA, 2009). The dataset is
composed by a set of 25,743 images collected by
three different cameras operating in different wave-
lengths (infra-red and visible light spectrum). The
presented low-cost FOD detection system resembles
as much as possible the way a fully operational sys-
tem would work, by using cameras mounted on the
top of a ground vehicle which regularly drives around
the aerodrome. Additionally, a thorough description
of the obtained dataset, the implemented software
(including classification, detection and segmentation
networks) and the obtained performance metrics is
provided, thus consisting on a benchmark to be used
by the scientific community.
The remainder of the paper is organized as fol-
lows. Section 2 describes the system’s hardware ar-
chitecture used for the data acquisition and the imple-
mented software pipeline. Then, Section 3 focuses on
the process of building our own and also the resulting
characteristics. Section 4 contains the description of
the experiments that were conducted to evaluate the
proposed methodology. Finally, Section 5 presents
the main conclusions and future work.
2 SYSTEM ARCHITECTURE
Systems which are based on radar and electro-optical
sensors achieve good performance, yet they are ex-
pensive and require several permissions. On the other
hand, a system based on electro-optical sensors em-
bedded in vehicles which move around the aerodrome
is a low-cost, effective and passive solution that sat-
isfies most of the intended goals. Moreover, our vi-
sion, is to have the system installed in vehicles al-
ready moving in the aerodrome area, such as firefight-
ers, towing and service trucks. One objective of our
work is to create an FOD dataset to test the viability
Application of Deep Learning to the Detection of Foreign Object Debris at Aerodromes’ Movement Area
815
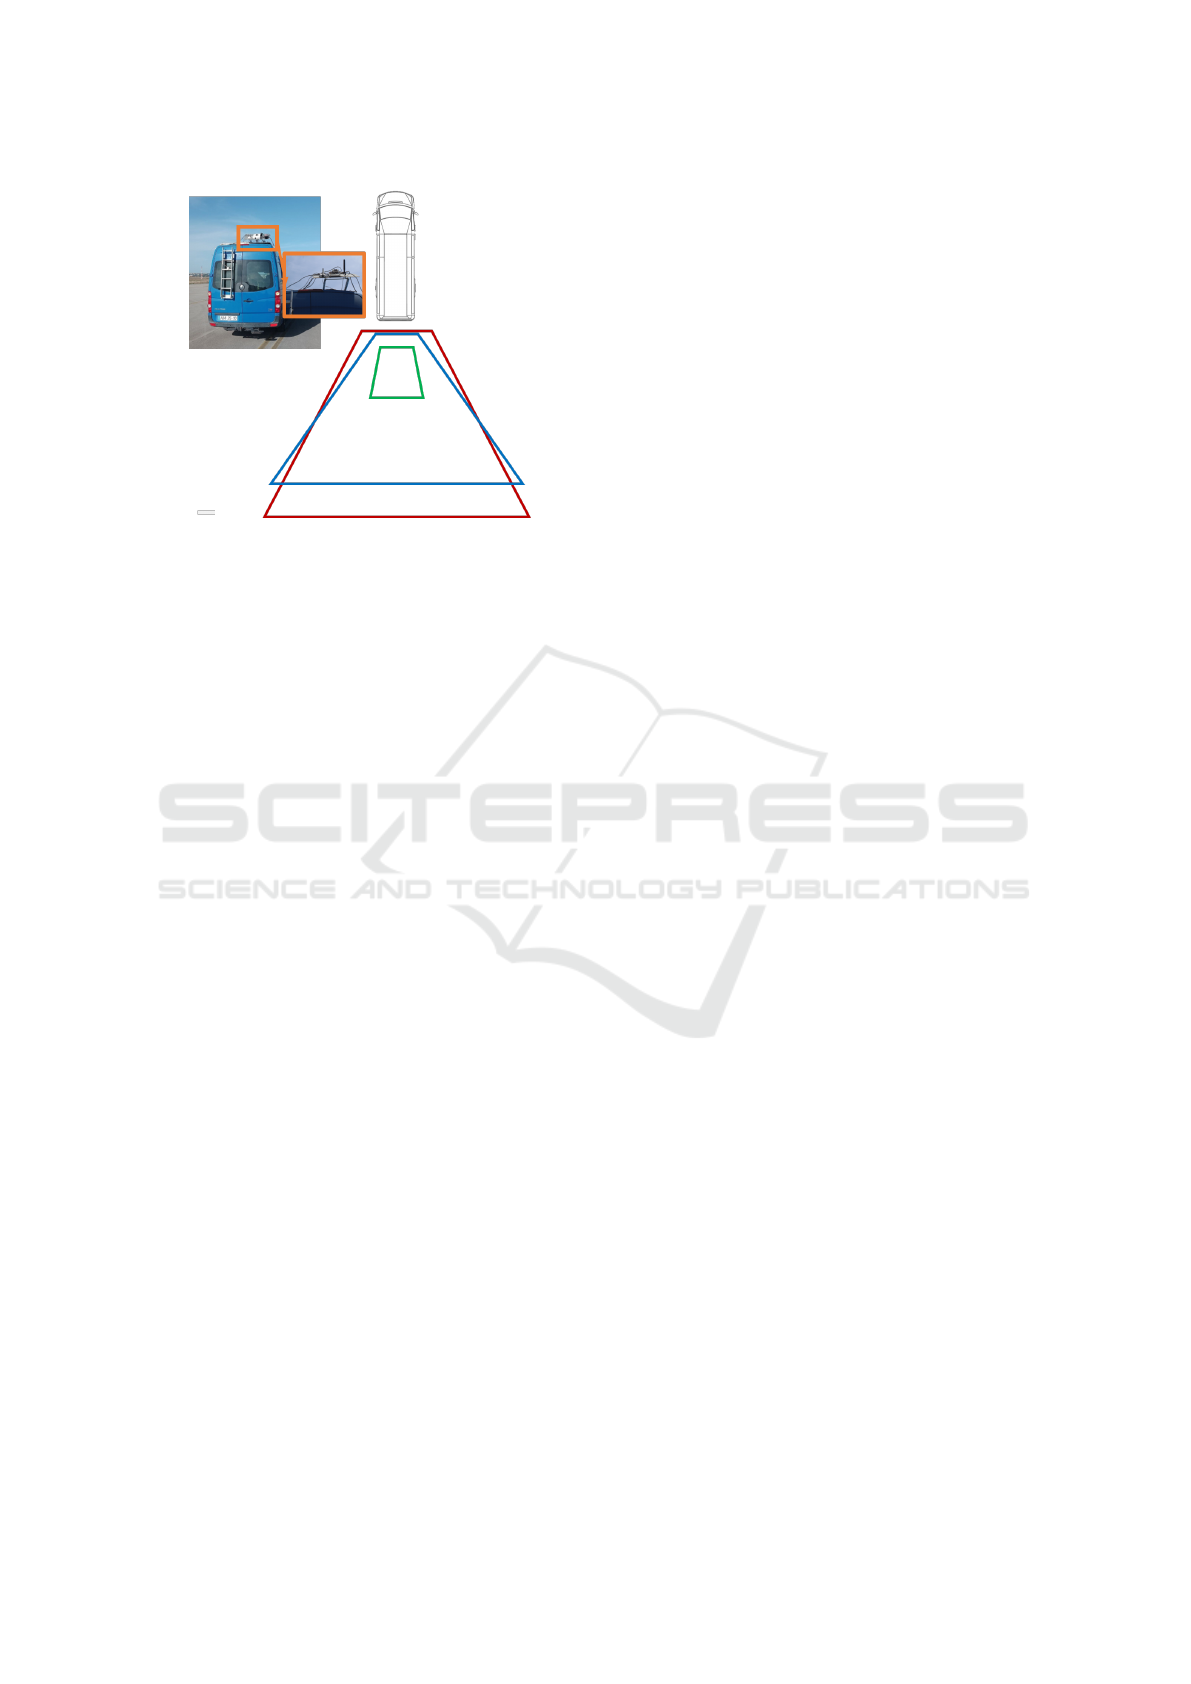
Figure 1: Image acquisition details, including the field-of-
view of each sensor. Sensor 01 FOV in blue, 02 in red and
03 in green.
of the implementation of the embedded system afore-
mentioned. This involves having a mobile platform
that simulates as close as possible the intended de-
ployment of the system, hardware and connections,
and creating a software pipeline.
2.1 Setup Description
The image acquisition platform comprises three el-
ements: vehicle, cameras and embedded computa-
tional boards (see Figure 1). For the vehicle, we opt
for a van whose height allows for a greater Field of
View (FoV) of the cameras and for an easy installa-
tion of the system on its roof. As for the electro opti-
cal sensors, we choose cameras that work on different
ranges of the electromagnetic spectrum.
The first camera (sensor 01) has a sensor which
works on the visual spectrum (VIS), the second (sen-
sor 02) on the visual and near-infrared spectra (VIS
+ NIR) and the third (sensor 03) on the long-wave in-
frared spectrum (LWIR). The first and the second sen-
sors are connected to a NVIDIA
R
Jetson TX2 and a
Raspberry Pi v3, respectively. The third sensor is a
Gobi-384. The FoV which the cameras provide when
installed on the top of the van at 2.55 m of height
and 38
o
of inclination in relation to the horizontal can
be observed in Figure 1. In the case of sensor 01,
the height of the trapezoid (in blue) is 7.42 m and the
width of the larger base 12.45 m. For sensor 02, the
height of the trapezoid (in red) is 9.21 m and the width
of the larger base 13.08 m. The sensor 03 (in green)
has the smallest FoV with a height of 2.50 m and a
width of the larger base of 2.59 m.
After the image acquisition campaigns, the posi-
tion of the objects in the image was annotated with an
open-source image labelling tool – Label-Studio. The
implementation of the machine learning techniques
was done using Keras, a high-level NN Application
Programming Interface (API) written in Python.
2.2 Neural Networks
Our proposed solutions to detect FOD are based on
a classification network, an object detection network
and an image segmentation network. The classifier
network is Xception (Chollet, 2017), the detector is
YOLOv3 (Redmon and Farhadi, 2018) and the seg-
mentation network is Unet (Ronneberger et al., 2015).
This decision has to do with several factors where
speed in real-time classification and detection is nec-
essary and computational board’s processing capabil-
ity is limited. Moreover, we aim to establish a bench-
mark for future developments using the dataset.
The main feature of Xception is in the application
of the depthwise separable convolution. This method
reducea the number of learnable parameters and the
computational cost, making the model lighter (Lak-
shmanan et al., 2021).
YOLOv3 is a single-stage fully convolutional ob-
ject detector which uses Darknet-53, trained on Im-
ageNet. Darknet-53 convolutional layers are ar-
ranged in consecutive 1x1 and 3x3 convolutional lay-
ers followed by batch normalization, Leaky ReLU
and residual blocks inspired in ResNet (He et al.,
2016). YOLOv3 does not have pooling layers; in-
stead, it applies convolutional layers of stride 2 for
down sampling. This characteristic further helps de-
tect smaller objects since it preserves low-level fea-
tures. The network generates bounding boxes con-
taining information about the position and size as well
as a confidence score.
To perform segmentation, we selected Unet which
is a fully convolutional network. This network is
comprised of two parts, an encoder and a decoder.
The encoder, consists of a stack of convolutional and
max pooling layers that contract the information in
the image. The decoder consists mostly of transposed
convolutions layers, which upsample the map resolu-
tion to achieve adequate localization capability. An-
other important aspect of Unet is that the upsampling
part creates a large number of feature channels, thus
passes more contextual information to improve local-
ization. (Ronneberger et al., 2015) For the backbone
network, we tested both ResNet-34, ResNet-50 and
ResNet-101 (He et al., 2016). The rational behind
this selection was the compromise between feature
extraction performance, number of trainable param-
eters (thus memory constraints) and number of oper-
ations.
VISAPP 2023 - 18th International Conference on Computer Vision Theory and Applications
816

3 FOD DATASET
3.1 Existing Datasets
Some authors had already addressed the FOD issue
through machine learning when this project started,
but most datasets are not publicly available. In the
meantime, (Munyer et al., 2021) released a large,
publicly available, dataset compared to private ones,
comprising 30,000 images and 31 object categories in
three different lighting and two weather conditions.
Although that dataset could be useful to our problem,
the way the images were captured do not match the
way we expect to deploy our system.
We want to implement the cameras at the back of
several vehicles, which limits the point of view of the
camera in relation to the objects (FOD) in terms of
angle and height. Combining the factors and the limi-
tations of the aforementioned datasets, we decided to
create our own dataset, detailed in the sequel.
3.2 Objects Selected for the Dataset
In order to guide our selection of FOD, we relied on
FAA’s Advisory Circular 150/5220-24 (FAA, 2009).
Consequently, we chose objects that would resemble
as much as possible the descriptions given on the Ad-
visory Circular (AC), and other objects we found rel-
evant based on other reports (ATSB, 2010), papers
(Herricks et al., 2015) (McCreary, 2010) and PoAF’s
prevention plans (PoAF, 2018).
AC 150/5220-24 further describes the perfor-
mance that the FOD detection systems must deliver.
If the system is installed on a mobile platform, it must
be able to detect the FOD at a minimum speed of
30 km/h. The FOD selected followed a thorough se-
lection process which was mainly based on the AC
150/5220-24’s list.
3.3 Data Acquisition and
Characteristics
During this work, we deployed our vehicle with the
cameras in two campaigns at Sintra Air Base, Portu-
gal.
Table 1 provides a general perspective on the num-
ber of frames, labels and objects captured by each
camera, during the first campaign. It also presents the
dimensions of the objects (in pixels). From the table,
we can observe that although Gobi-384 captured the
largest number of frames, it lacks two labels and two
objects due to the limited FoV. On the other hand, the
remaining two cameras captured less images but en-
close all the labels and objects. The average size, size
range and standard deviation of the width and height
of sequences 01 and 02 are similar.
Table 1: Capture sequence and objects characteristics of the
images that compose the train and validation set (first ac-
quisition campaign).
Sensor ID 01 02 03
Spectrum Vis.
NIR +
Vis.
LWIR
Resol. [px.]
1920×
1080
1920×
1080
384×
288
Frames 9,260 5,672 10,388
Type of objects 16 16 14
Number of objects 21 21 19
(Units in pixel)
Average width 40 37 22
Width range [4;258] [5;239] [3;103]
Width std. dev. 38 36 20
Average height 27 24 16
Height range [5;142] [5;137] [3;49]
Height std. dev. 23 22 11
In a real world application, the models should be
able to alert the presence of an unknown type of ob-
ject. Therefore, with the goal performing an evalu-
ation closer to real world application and of having
a robust test set, with previously unseen objects, we
captured an additional set of images. This collection
includes new samples on a road-like surface to mimic
the background of previous acquisitions. This time,
we only captured images with sensors 01 and 02 and
some relevant data about this capture is presented in
Table 2.
There is no standardised definition of what a small
object is in machine learning, leading some authors
to take their own approaches. However, (Chen et al.,
2017) considers the median relative area of the ob-
jects between 0.08% and 0.58%, extracted from MS
COCO and Scene UNderstanding (SUN) (Xiao et al.,
2010) datasets, as being small instances. As presented
on Tables 1 and 2, the objects in our dataset fit this
definition. This aspect, combined with their size vari-
ability makes detection challenging.
In an effort to promote reproducibility and foster
research in the area of FOD detection, we made our
dataset publicly available at Harvard Dataverse web-
site
1
. The dataset includes data from both campaigns
that were previously described.
1
https://dataverse.harvard.edu/dataset.xhtml?
persistentId=doi:10.7910/DVN/XSINZN
Application of Deep Learning to the Detection of Foreign Object Debris at Aerodromes’ Movement Area
817

Table 2: Capture sequence and objects characteristics of the
images that compose the test set (second acquisition cam-
paign). This set only contains images captured by sensor
01 and 02. The set contains some objects present on the
first train and validation set but also some completely new
classes of objects.
Sensor ID 01 02
Spectrum Vis.
NIR + Vis.
Resol. [px]
1920×
1080
1920×
1080
Frames 237 186
Type of objects 7 7
Number of objects 8 7
(Units in pixel)
Average width 43 70
Width Range [4;227] [13; 320]
Width std. dev. 35 74
Average height 31 51
Height range [9;278] [7;276]
Height std. dev. 49 53
4 SYSTEM TRAINING AND
TESTING
4.1 Image Preparation
The cameras’ resolution is 1920 × 1080 px. Images
this big result in huge computation requirements for
NN, which limits real-time application, but increased
detail also produces greater performance.
We solve address this problem by creating tiles of
different sizes. It artificially reduces image size and
required computational power while making sure we
keep the objects and their original features.
We did not use LWIR images for training and test-
ing. This decision was made based on the small num-
ber of images with FOD, the small FoV of the camera
and our difficulty in finding the objects in the images
and labelling them.
Since one of the goals of our work is to determine
which frameworks better suit our problem, we opted
for a fixed tile size for image classification and an-
other for object detection. The median relative area
of the objects in relation to the original image area is
quite small (< 0.18%). By cropping the image into
tiles of 256 × 256 px for classification, that ratio will
increase (< 0.763%). We followed the same princi-
ple for object detection, but with tiles of 416 × 416
px. The range of the median relative area changes
from 0.0189% to 0.180% to 0.180% to 0.289%. For
both classification and detection tiles, we applied a
horizontal and vertical overlap ratio of 0.5. For the
segmentation network, we used a grid search on sev-
eral crop sizes, including 416x416 tiles.
4.2 EXPERIMENTS AND RESULTS
During the experiments with FOD detection tech-
niques, the images from sensor 01 and 02, obtained
during the first acquisition were used for training and
validation. For the test set, we used the images from
the second data acquisition, with unseen objects. In
the current work, our main concern is not the compu-
tational performance, however, we measured the in-
ference time to indicate relative computational perfor-
mance advantages. This metric was determined on a
high performance desktop.
4.2.1 Experiment A: Classification
We trained the classifier on two types of subsets: bal-
anced and imbalanced, and tested the models only
on balanced test sets. We also created a subset with
half of the images from sensors 1 and 2 in order
to test if a balanced combination of images from
two sensors would generate better results. Since,
presumably more images provide better results, we
also tested training with all images from both sen-
sors; this resulted in a unbalanced dataset. The im-
ages were either labelled as ‘fod’ or ‘no fod’. The
train/validation split is in a proportion of 89/11%, re-
spectively. We applied transfer learning to the net-
work with its weights pretrained on Imagenet (Deng
et al., 2009).
We conduct training for an unlimited number of
epochs until convergence. We tested different config-
urations of the hyperparameters and data augmenta-
tion. The balanced dataset which contains the images
from both sensors delivers the best results in terms of
validation accuracy (98.76%). The processing time
for each tile is approximately 0.01s.
During the training process, we faced a challenge.
In many of the training runs, the training loss de-
creased monotonically while the validation loss did
not. In our perspective, the problem is caused by over-
fitting, the limited number of images with FOD and
few data augmentation. This allows the model to per-
form very well in the training examples – high train
accuracy –, but losing generalisation capability.
To obtain the test subset, We divided the images in
tiles with the same parameters as before. From here,
resulted 1,134 tiles for testing which contain FOD and
VISAPP 2023 - 18th International Conference on Computer Vision Theory and Applications
818

1,132 that do not, where 721 and 720, respectively,
correspond to sensor 01.
By testing the images containing the unseen ob-
jects on the trained model, we can see a drop in the
performance. This result was expected since most of
the objects presented to the NN are significantly dif-
ferent from the previous. However the obtained result,
an accuracy of 77.92%, is relatively high.
Objects that are similar to the ones used in the
first acquisition such as the bolt, the plastic tube and
the metals are correctly classified. It is clear that the
model tends to classify novelties as FOD. Cracks on
the tarmac and plants growing on these cracks, hap-
pen to be detected over FOD such as a large tree
branch. However, despite not being considered FOD,
plants and cracks may become an hazard.
4.2.2 Experiment B: Detection
The crop size employed for object detection was
416 × 416 px. This allows YOLOv3 to infer in real-
time while scoring good AP results. Just like we did
for Xception, we opted for transfer learning with pre-
trained weights on MS COCO (Lin et al., 2014). The
train/validation split is in a proportion of 89/11%, re-
spectively. We tested the model in different subsets
just like in the case of classification.
The subset with more images got the best results,
with a score of 93.16% AP, at training time. The pro-
cessing rate that was obtained was 11.5 fps. Given the
limitation established by the FAA of 30 km/h for mo-
bile platforms in conjunction with capturing the FOD
at least twice ( 2.25 fps), we can say that the system
can work in real-time.
For the test of the detector, we used a subset of
423 images, where 248 contain FOD and 175 do not,
and 237 belong to sensor 01 and 186 to sensor 02.
Similarly to the behaviour of the classifier, the de-
tector had a performance drop. However, the perfor-
mance decreased significantly more than that of the
classifier, from 93.16% to 37.49%.
As shown in Figure 2, the model tends to classify
novelties as FOD. One of the cases that causes plenty
false positives are plants. This result is not as bad it
would seem at first because plants constitute an or-
ganic FOD, especially in larger quantities.
4.2.3 Experiment C: Segmentation
We performed a grid search on the following param-
eters of the model: network backbone, size and va-
riety of train set, and tile size. All models were
trained up to 200 epochs. The backbones explored
were ResNet34, ResNet50 and ResNet101 - all pre-
trained on the Imagenet dataset. The base dataset was
either images from sensors 01, 02 or a combination
of both. Finally, tile sizes were 416 × 416, 512×512,
832×832 or the original resolution 1920×1080, with
the height cropped to 1056, to fit convolution win-
dows. Dataset size varies for different tile sizes, be-
cause of the number of crops. The proportions of
the training and validation sets were kept constant at
89/11%. For all combinations, Unet was chosen for
segmentation, as mentioned in Section 2.2.
The best model was trained with the combined
dataset of both sensors, ResNet50 backbone and
832 × 832 tile with an mIoU of 71.6% on the val-
idation set and 26.9% on the test set. The num-
ber of images used in each set was 359/45/346
(train/validation/test).A sample of the results can be
observed in Figure 3. Objects like twigs offer a dou-
ble challenge. Firstly, there were no samples simi-
lar to this object on the training set. Additionally,
they don’t have a detailed ground truth mask and pro-
duced the worst results. Additionally, many frames
had incorrect predicted pixels on vegetation, which
was never annotated as a FOD. Objects with a solid
ground truth mask had the best results, even when the
color was similar to background. Regarding inference
speed, the performance varied significantly depend-
ing on the backbone network that was used. The net-
works’ inference time allowed a processing rate from
6.7 to 58.8 fps.
5 CONCLUSIONS
In this work we address the problem of FOD detec-
tion with two contributions. Firstly, we build a dataset
of images with three different sensors which operate
in different wavelengths. This dataset resembles as
much as possible the way a fully deployable system
would work. This system must be low-cost and non-
intrusive to the normal operation of an aerodrome.
Secondly, we test classification, detection and seg-
mentation techniques to evaluate the pros and cons of
each.
One important outcome of the first part was the
creation of our own dataset. It contains 9,497 images
from the visible sensor, 5,858 images from the visible
plus near infrared sensor and 10,388 images from the
long-wave infrared sensor.
To determine the presence of FOD, we trained
classification, detection and segmentation networks.
We trained these methods on a set of images and eval-
uated its performance on another set resulting from a
different acquisition campaign. The best classifica-
tion model achieved an accuracy of 77,92% at 90.9
fps, however there are some indications of overfitting.
Application of Deep Learning to the Detection of Foreign Object Debris at Aerodromes’ Movement Area
819
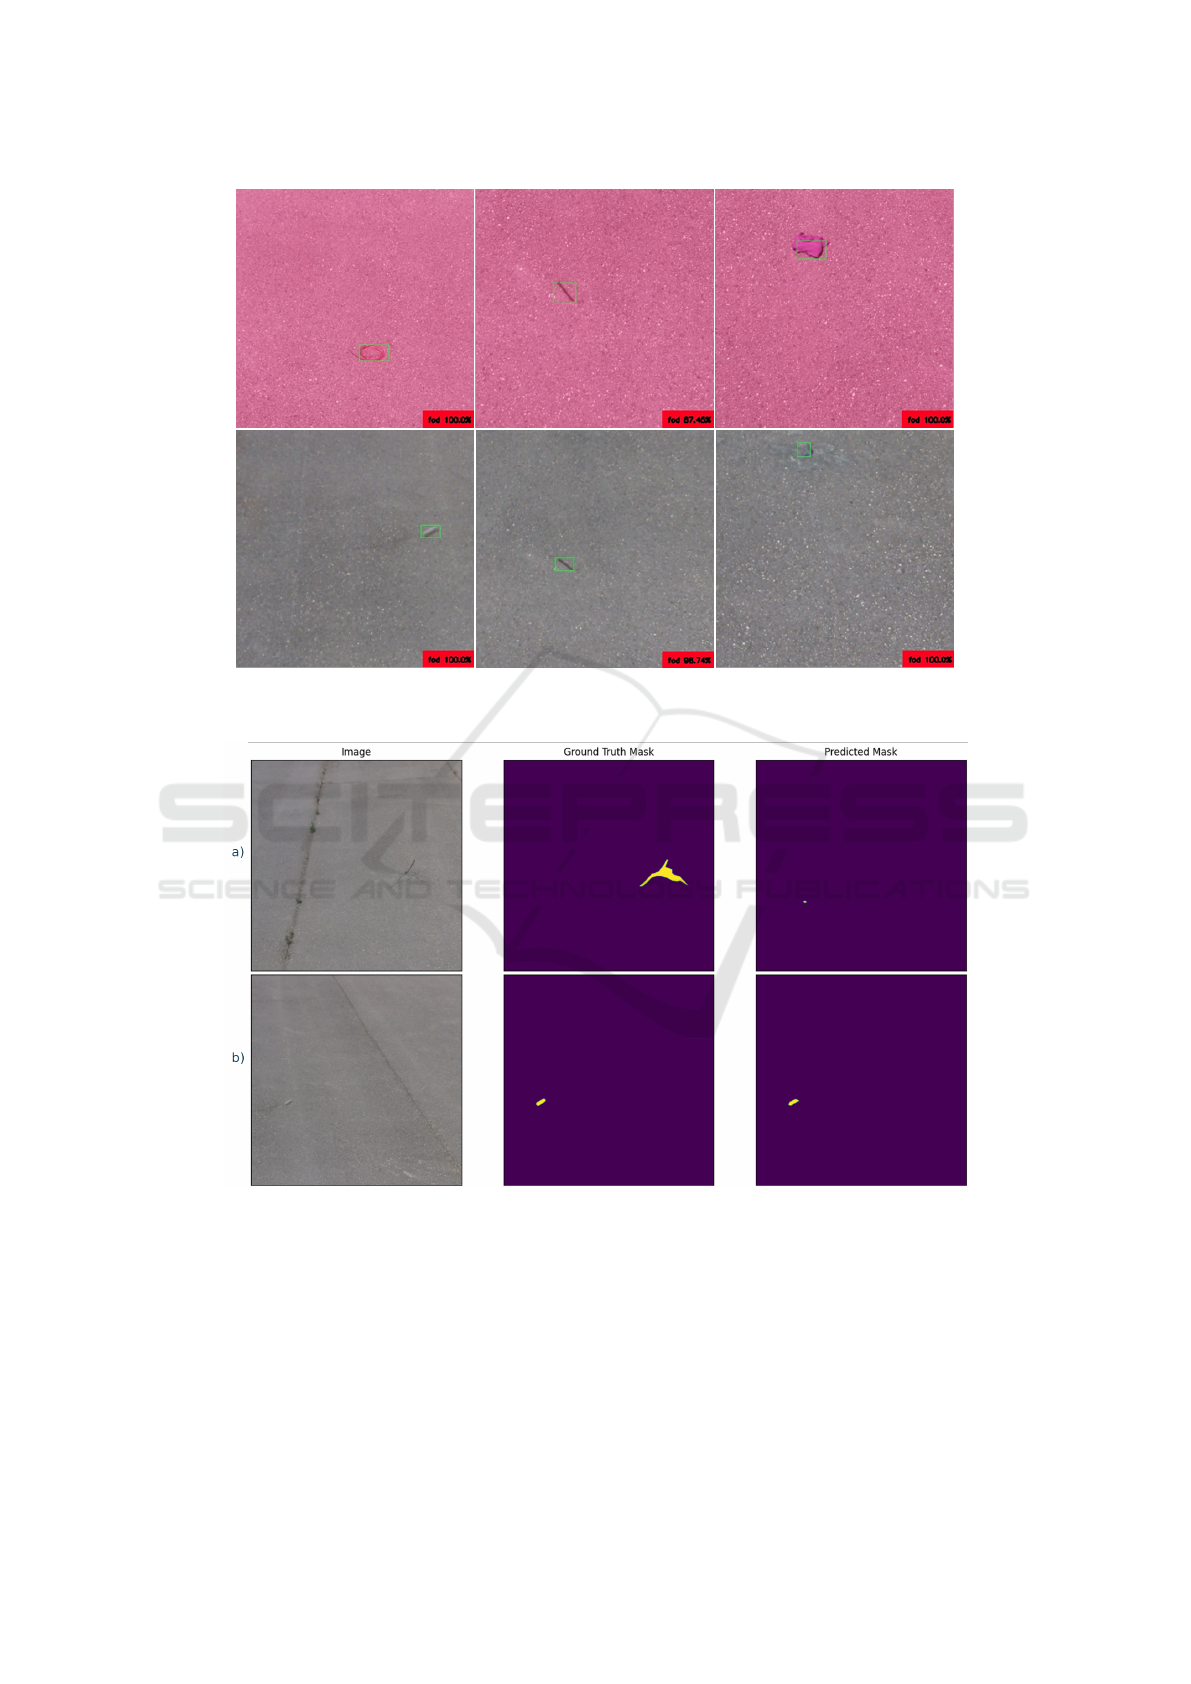
Figure 2: Examples of correctly detected FOD. These results were obtained with previously unseen objects. Images in the top
row were captured by sensor 02 and images in the bottom row were captured by sensor 01.
Figure 3: Sample results from the best segmentation model: 832x832 tile, Unet with a ResNet50 backbone trained on images
from both sensors 01 and 02. The first object is a tree twig, while the second is a small object similar in appearance to asphalt.
Secondly, we trained the detection network. The per-
formance in the test set was 37.49% AP at 11.5 fps.
Given the difference in AP between training and test-
ing, we suspect that the detector was overfitting. The
third experiment used the dataset for segmentation,
where we conducted a grid search on several param-
eters, obtaining the best model on images cropped to
832×832 tiles, used to train the Unet algorithm with a
ResNet-50 encoder pre-trained on Imagenet. The best
model obtained an mIoU score of 71.6% on the vali-
dation set, contrasting significantly with the 26.9% on
the test set.
While the results are encouraging, there is also fu-
ture work identified. Firstly, we would like to carry
out more image acquisition campaigns in different
conditions. Additionally, the computational perfor-
VISAPP 2023 - 18th International Conference on Computer Vision Theory and Applications
820

mance needs to be studied in more detail. In partic-
ular, what compromises are needed to run the NN in
embedded platforms with limited memory. In conclu-
sion, the preliminary results obtained in the present
article provide a solid foundation to many paths of
further improvements and system development.
REFERENCES
Almeida, J., Cruz, G., and Oliveira, T. (2022). Foreign Ob-
ject Debris at Aerodromes.
ATSB (2010). Ground operations occurrences at australian
airports 1998 to 2008 (safety report no. 42). Technical
Report 42, Australian Transport Safety Bureau.
Cao, X., Wang, P., Meng, C., Bai, X., Gong, G., Liu, M.,
and Qi, J. (2018). Region based cnn for foreign ob-
ject debris detection on airfield pavement. Sensors,
18(3):737.
Chen, L.-C., Papandreou, G., Schroff, F., and Adam,
H. (2017). Rethinking atrous convolution for
semantic image segmentation. arXiv preprint
arXiv:1706.05587.
Chollet, F. (2017). Xception: Deep learning with depthwise
separable convolutions. In Proceedings of the IEEE
conference on computer vision and pattern recogni-
tion, pages 1251–1258.
Deng, J., Dong, W., Socher, R., Li, L.-J., Li, K., and Fei-
Fei, L. (2009). Imagenet: A large-scale hierarchical
image database. In 2009 IEEE conference on com-
puter vision and pattern recognition, pages 248–255.
Ieee.
FAA (2009). AC 150/5220-24 - Foreign Object Debris De-
tection Equipment – Document Information.
FAA (2018). Faa reauthorization bill 2018 foreign object
debris (fod) detection technology.
Han, Z., Fang, Y., and Xu, H. (2015a). Fusion of low-level
feature for fod classification. In 2015 10th Interna-
tional Conference on Communications and Network-
ing in China (ChinaCom), pages 465–469. IEEE.
Han, Z., Fang, Y., Xu, H., and Zheng, Y. (2015b). A
novel fod classification system based on visual fea-
tures. In International Conference on Image and
Graphics, pages 288–296. Springer.
He, K., Zhang, X., Ren, S., and Sun, J. (2016). Deep resid-
ual learning for image recognition. In Proceedings of
the IEEE conference on computer vision and pattern
recognition, pages 770–778.
Herricks, E. E., Mayer, D., and Majumdar, S. (2015). For-
eign object debris characterization at a large interna-
tional airport. Technical report.
Huang, T. S. (1996). Computer vision: Evolution and
promise. In 19th CERN School of Computing
(CSC’19), pages 25–21. CERN.
Kraus, D. and Watson, J. (2001). Guidelines for the
Prevention an Elimination of Foreign Object Dam-
age/Debris (FOD) in the Aviation Maintenance En-
vironment through Improved Human Performance.
Technical report, Federal Aviation Administration -
Flight Standards Service - Aircraft Maintenance Di-
vision.
Lakshmanan, V., G
¨
orner, M., and Gillard, R. (2021). Prac-
tical Machine Learning for Computer Vision. ”
O’Reilly Media, Inc.”.
Li, P. and Li, H. (2020). Research on fod detection for air-
port runway based on yolov3. In 2020 39th Chinese
Control Conference (CCC), pages 7096–7099. IEEE.
Lin, T.-Y., Maire, M., Belongie, S., Hays, J., Perona, P.,
Ramanan, D., Doll
´
ar, P., and Zitnick, C. L. (2014).
Microsoft coco: Common objects in context. In Euro-
pean conference on computer vision, pages 740–755.
Springer.
Liu, Y., Li, Y., Liu, J., Peng, X., Zhou, Y., and Murphey,
Y. L. (2018). Fod detection using densenet with fo-
cal loss of object samples for airport runway. In
2018 IEEE Symposium Series on Computational In-
telligence (SSCI), pages 547–554. IEEE.
McCreary, I. (2010). Runway safety: Fod, birds and the
case for automated scanning. Insight SRI, pages 146–
157.
Munyer, T., Huang, P.-C., Huang, C., and Zhong, X. (2021).
Fod-a: A dataset for foreign object debris in airports.
arXiv preprint arXiv:2110.03072.
PoAF (2018). Programa de prevenc¸
˜
ao de danos por objetos
estranhos. Technical Report MBA5 330-3 (A), Por-
tuguese Air Force.
Redmon, J. and Farhadi, A. (2018). Yolov3: An incremental
improvement. arXiv preprint arXiv:1804.02767.
Ronneberger, O., Fischer, P., and Brox, T. (2015). U-net:
Convolutional networks for biomedical image seg-
mentation. In International Conference on Medical
image computing and computer-assisted intervention,
pages 234–241. Springer.
Shapiro, L. G. (2020). Computer vision: the last 50 years.
International Journal of Parallel, Emergent and Dis-
tributed Systems, 35(2):112–117.
Warren, J., Gorton, C., Hoff, S., and Alby, F. (2005). Best
practices for the mitigation and control of foreign ob-
ject damage-induced high cycle fatigue in gas tur-
bine engine compression system airfoils. Annex B Ef-
fects of Sand and Dust on Small Gas Turbine Engines,
NATO RTO Applied Vehicle Technology Panel (AVT)
Task Group-094.
Xiao, J., Hays, J., Ehinger, K. A., Oliva, A., and Torralba,
A. (2010). Sun database: Large-scale scene recogni-
tion from abbey to zoo. In 2010 IEEE computer soci-
ety conference on computer vision and pattern recog-
nition, pages 3485–3492. IEEE.
Application of Deep Learning to the Detection of Foreign Object Debris at Aerodromes’ Movement Area
821
