
Real-Time Monitoring of Crowd Panic Based on Biometric and
Spatiotemporal Data
Ilias Lazarou, Anastasios L. Kesidis and Andreas Tsatsaris
Department of Surveying and Geoinformatics Engineering, University of West Attica, Athens, 12243, Greece
Keywords: Crowd Panic Detection, Biometrics, Wearable Devices, Machine Learning, Real-Time Analysis,
Emergency Response Systems, Geospatial Data.
Abstract: Panic is one of the most important indicators when it comes to Emergency Response Systems (ERS). Until
now, panic events of any cause tend to be treated in a local manner based on traditional methods such as visual
surveillance technologies and community engagement systems. This paper aims to present an approach for
crowd panic event detection that takes advantage of wearable devices tracking real-time biometric data that
are combined with location information. The real-time biometric and spatiotemporal nature of the data in the
proposed approach is spatially unrestricted and information is flawlessly transmitted right from the source of
the event, the human body. First, a machine learning classifier is demonstrated that successfully detects
whether a subject has developed panic or not, based on its biometric and spatiotemporal data. Second, a real-
time analysis model is proposed that uses the geospatial information of the labeled subjects to expose hidden
patterns that possibly reveal crowd panic. The experimental results demonstrate the applicability of the
proposed method in detecting and visualizing in real-time areas where an event of abnormal crowd behavior
occurs.
1 INTRODUCTION
Emergency response systems (ERS) are integrated
solutions that handle urgent and severe events (Bui
and Sankaran, 2006). They have benefited from the
evolution of information technology, which has
resulted in increased responsiveness and
effectiveness (Li et al., 2014). The wide range of
online available sensors allows scientific decisions to
be made regarding emergencies based on real-time
data. When it comes to the use of such systems, one
of the most common indicators is panic. It serves as a
major cause of unpleasant events mostly when it
develops simultaneously among a group of people, as
it prevents those who are affected from verbally
disseminating urgent information. This indicates that
the proper detection of panic at a crowd level is an
application field that undoubtedly would benefit from
ERSs. Attempts to model and analyze panic behavior
to detect, for example, crowd escape patterns, date
back to 2000 when, for instance, (Helbing et al.,
2000) used a model of pedestrian behavior to
investigate the mechanisms of (and preconditions for)
panic and jamming by uncoordinated motion in
crowds.
Until now, panic events of any cause tend to be
treated in a local manner. Various attempts to detect
such events have been proposed based on traditional
methods such as visual surveillance technologies and
community engagement systems. However, panic
events detected by visual surveillance technologies
are spatially limited by the range of the visual
equipment while during an emergency it is highly
unlikely that people will give priority to reporting the
event to an engagement system, instead of running
away.
While the use of ERS is increasingly adopted
across many aspects of everyday life, the combination
of them with real-time biometric data and time-
enabled location information appears to provide a
different perspective. In this paper a new data model
is proposed that takes advantage of wearable devices
tracking real-time biometric data and combines them
with location information. This blend of information
is used to predict the current panic state of a subject
in real-time. For this purpose, a machine learning
classifier is involved that has been previously trained
on a dataset of similar biometric and spatiotemporal
information gathered by monitoring several subjects
in various activities. The classifier characterizes each
Lazarou, I., Kesidis, A. and Tsatsaris, A.
Real-Time Monitoring of Crowd Panic Based on Biometric and Spatiotemporal Data.
DOI: 10.5220/0011789900003417
In Proceedings of the 18th International Joint Conference on Computer Vision, Imaging and Computer Graphics Theory and Applications (VISIGRAPP 2023) - Volume 5: VISAPP, pages
1021-1027
ISBN: 978-989-758-634-7; ISSN: 2184-4321
Copyright
c
2023 by SCITEPRESS – Science and Technology Publications, Lda. Under CC license (CC BY-NC-ND 4.0)
1021

subject as being either in calm or in panic state. Thus,
a classifier well-trained on a careful selection of
appropriate data can be the basis for a real-time panic
prediction system. The proposed data model
transforms the gathered measurements (biometric and
spatiotemporal data) into valuable information to
expose hidden patterns that possibly reveal panic
behavior. For this purpose, the several entities of the
proposed data model are described in detail in order
to highlight their contribution in the ability of the
system to scale the panic phenomenon examination to
a crowd level. The experimental results demonstrate
the applicability of the proposed method in detecting
and visualizing in real-time areas where an event of
abnormal crowd behavior occurs. The real-time
biometric and spatiotemporal nature of the data in the
proposed approach is spatially unrestricted and
information is flawlessly transmitted right from the
source of the event, the human body. This is moving
towards the creation of a smart geo-referenced ERS
that could be used to inform the authorities regarding
a potentially unpleasant event by detecting possible
crowd panic patterns and helping to act accordingly.
2 RELATED WORK
Panic is a phenomenon generally studied in
psychology and human sciences and often identified
by its consequences. It is triggered whenever a
situation of tension worsens, slips or escapes from
human control. Panic is defined as an intense fear
triggered by the occurrence of a real or imaginary
danger felt simultaneously by all individuals in a
group, a crowd, or population, characterized by the
regression of mentalities to an archaic and gregarious
level, leading to primitive reactions of hopeless
jumps, indiscriminate agitation of violence or
collective suicide (Lin et al., 2016). Mass Panic is
type of anomaly in a human crowd, which appears
when a group of people start to move faster than the
usual speed. Such situations can arise due to a
fearsome activity near a crowd such as stampede, fire,
fight, robbery, riot, etc. (Kumar, 2012).
In the recent literature, there are numerous studies
as well as systems in production that deal with panic
detection based on CCTV (Closed Circuit Television)
technologies. They involve surveillance techniques
that collect visual data in terms of still images and/or
video sequences in order to analyze human behavior
either of individuals or groups of people. For
instance, (Hao et al., 2016) propose an approach to
detect crowd panic behavior based on optical flow
features. In another view, (Ammar et al., 2021)
describe an online and continuous surveillance
system of a particular public place using a fixed
camera on the one hand, and a methodology for real-
time analysis of the captured images on the other
hand.
Another category of such systems is based on the
user’s intervention (community engagement) in the
reporting of an emergency event, as a disaster
preparedness enhancement (Sufri, 2020). It has been
observed that, all over the globe, nations are
encouraged to plan accordingly in order to be
prepared to disrupt entire communities in the
occurrence of an unpleasant event that will inevitably
happen (Andrulis, 2011).
Conventional approaches for data acquisition and
distribution are clearly not able to provide the experts
with sufficient on-site and real-time data, which may
cause potential safety hazards especially when crises
are highly time-sensitive (Li et al., 2014). Internet of
Things (IoT) provides a vital solution to acquire real-
time data about any objects and transmit the data to
experts promptly for decision-making. Various
studies use wearable devices and IoT to collect
biometric data and analyze them for stress detection.
Regarding the wearables and IoT sector, it
exponentially gains considerable interest due to the
technological evolution and progress of the related
technologies that involve sensors and chips. It exists
for many years already but nowadays has matured
and belongs among the most invaluable sources of
real-time data. As a result, such information can be
further paired with 5G smartphone capabilities
providing real-time sensor data.
Recent studies conclude that research on systems,
quantitative analysis, and visualization studies on
crowd evacuation is still a developing field (Li,
2020), (Lin et al., 2012), (Xu, 2013), (Xu, 2020), and
(Xu et al, 2016). In (Tsai, 2022) wearable data are
used for panic attack disorder prediction based on
time-series. This way they provide a panic attack
prediction model that relates a panic attack to various
features, such as physiological factor, and air quality.
Next, (Kutsarova and Matskin, 2021) combine
mobile crowdsensing and wearables to produce
alarms based on CrowdS, an existing crowdsensing
system. In this approach, smartwatch sensors detect
abnormal events. Then they integrate the smartwatch
with the CrowdS platform either through a direct
internet connection, or a connection through a
smartphone by pairing it via Bluetooth with the
smartwatch. Lastly, (Alsalat, 2018) uses machine
learning to detect human panic based on wearables
and classify them between stressed and calm.
VISAPP 2023 - 18th International Conference on Computer Vision Theory and Applications
1022
3 PROPOSED METHODOLOGY
3.1 System Workflow
The scope of the proposed crowd panic detection
system is to transform the gathered measurements
(biometric and spatiotemporal data) into valuable
information to expose hidden patterns that possibly
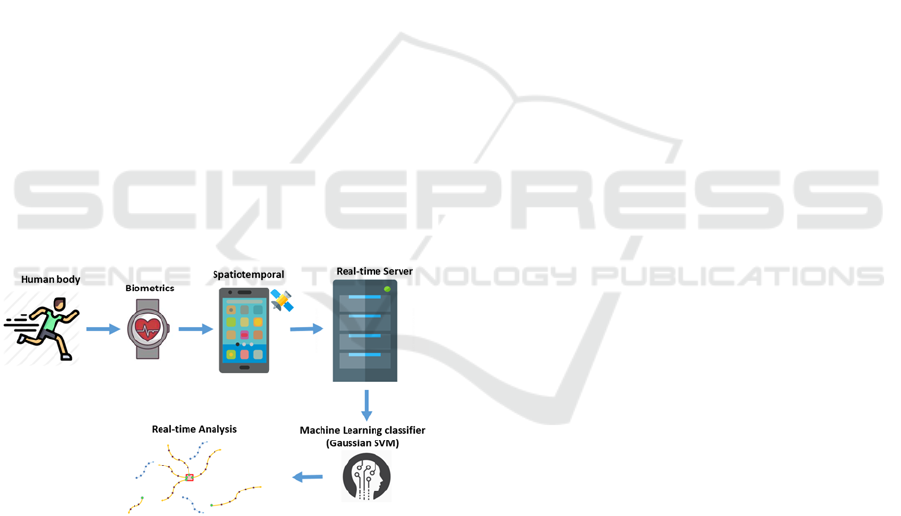
reveal panic behavior in crowd level. Figure 1
illustrates the main modules of the proposed scheme.
Starting from the user’s endpoint, the workflow
begins from the wrist where an application running
on the wearable device monitors the real-time
biometric footprint regarding data such as heart rate
and heart rate variability. At the same time, a paired
application running on an Android smartphone
collects GPS location coordinates (longitude,
latitude), time data, user activity, speed, and steps.
Following a time interval of one second, all this
information is bundled together into a single UDP
packet and is sent encrypted to a server through the
GSM network. On the server side, a Java code
receives the UDP packets, decrypts the information,
and constructs points having all the above-referenced
characteristics as attributes. This procedure enables
the collection of real-world biometric and
spatiotemporal data. The real-time server is designed
to receive a large amount of data that is analyzed for
possible patterns of crowd panicking.
Figure 1: System workflow.
3.2 Panic State Classification
An important part of the proposed methodology is the
characterization of a subject as being in a clam or in
a panic state. For this purpose, a classifier is involved
whose input are various biometric and geospatial data
gather by the wearable devices while its output is the
panic state of the subject. The efficiency of various
machine learning classifiers was tested in order to
choose the most appropriate one. The training of the
classifiers is performed in advance and is based on a
dataset that consists of 27 different subjects that are
monitored during a short time frame (Lazarou et al.,
2022). Two of the 27 subjects are actual humans that
used the wearable and the smartphone and captured
real-world data using the accompanying applications.
The data regarding the rest of the subjects were
artificially produced. Their biometric and geospatial
data are gathered per second for a period of 10
minutes resulting in a set of 600 measurements per
subject. In most cases, a panic event is simulated that
affects these measurements. However, in three out of
the 27 subjects, there is no panic event. This is in
purpose examined in order to capture the variability
of the observed data in both calm and stressed states.
For the collection of the raw biometric and
positional data, a Samsung Galaxy Watch wearable,
as well as a Samsung Galaxy A70 smartphone were
used. The biometric and spatiotemporal features of
the dataset are divided into four categories, namely i)
biometric data (from wearable) including heart rate
and heart rate variability; ii) spatiotemporal data
(from the smartphone) that provide location
coordinates, type of activity, the subject’s speed and
the number of steps performed iii) descriptive data
(from wearable) regarding the gender, age and weight
of the subject; and iv) the secure ID (from the
smartphone) which provides a unique identification
code for each subject.
The values of the several features are determined
by studies that provide such relevant information. For
instance, normal heart rate for ages 10 and above
reaches 60 to 100 beats per minute (bpm) while
athletes belong to a separate category with a range of
40 to 60 bpm (Forbes Health). On the other hand, the
target heart rate during activities of moderate
intensity is about 50–70% of the maximum heart rate,
while during vigorous physical activity it is about 70–
85% of the maximum (Centers for Disease Control).
In addition to the above raw data, a feature named
heart rate moving average deviation (HRMAD) is
also derived. It encloses a temporal effect on the
dataset that is based on a time window regarding heart
rate values of the past. It acts as an indicator that a
subject has suddenly developed high measurements
of the heart rate which could imply sudden panic
conditions.
Real-Time Monitoring of Crowd Panic Based on Biometric and Spatiotemporal Data
1023
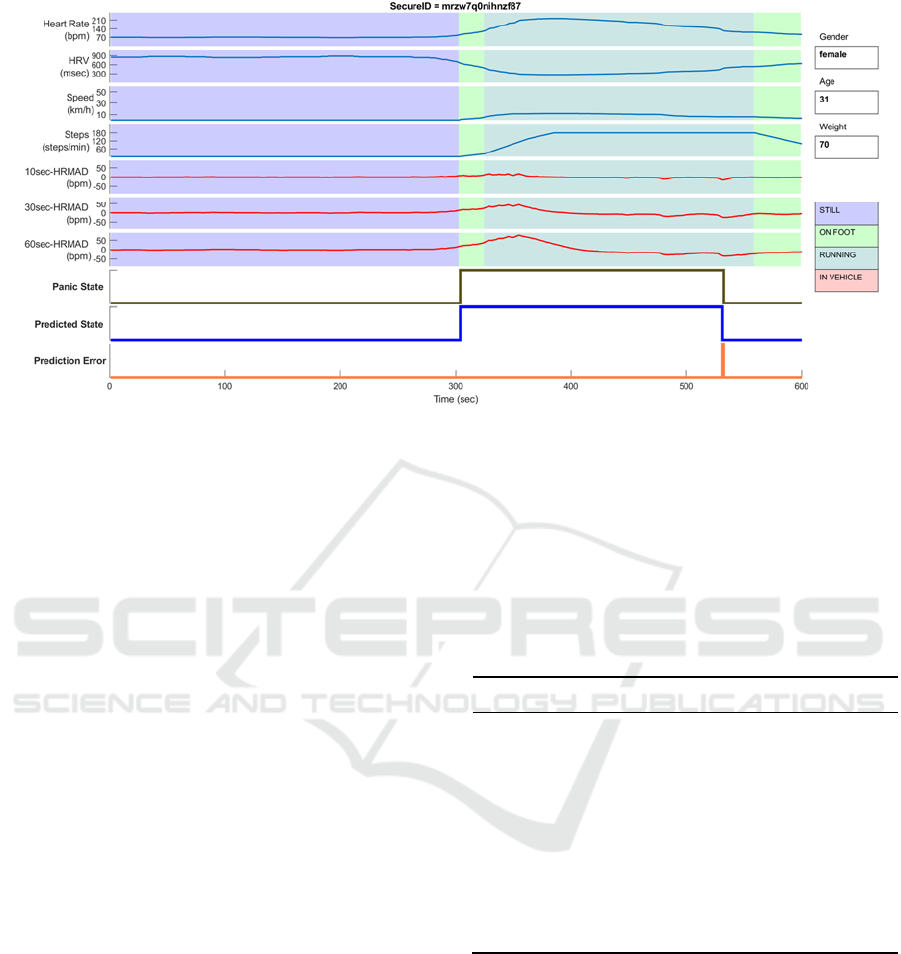
Figure 2: Panic prediction example.
Typically, the mean value of the last minute’s heart
rate should be around 5–10 bpm based on the
assumption that it slightly varies from the resting
heart rate levels. In contrary, a sudden event that
causes panic would exaggerate the heart rate possibly
beyond 150 bpm denoting a remarkable difference
from the previous measurements. Three different time
windows of 10, 30, and 60 seconds are provided in
the dataset namely HRMAD10, HRMAD30, and
HRMAD60, respectively. They indicate how much
the current heart rate measurement deviates from a
moving average of a specific time window in the past.
The time window acts as a smoothing technique
where potential residuals and deviations are absorbed
by the averaging process.
Figure 2, depicts an example of a subject (female,
aged 31, 70 kg weight) which iterates through several
states starting from a still position, then walking,
running, and walking again. Her biometric and
positional data vary significantly during these state
transitions. For instance, her heart rate ranges from 70
to 186, her HRV ranges from 323 to 909, speed is up
to 9.6 and her steps are approaching 120 steps per
minute. Finally, the calculated HRMAD60 values are
in the range of 55 to −33. It can be seen that, even
though the feature values vary significantly, the
classifier accurately detects the panic state showing
only a negligible error at the end of the stress period.
The aforementioned dataset is used to train
machine learning models in order to correctly
distinguish panic states from normal behavior. A
variety of models are examined, namely, decision
trees (
Loh, 2014
), logistic regression (
Hosmer et al.,
2013)
, Gaussian and kernel naïve Bayes (Ren et al.,
2009), Gaussian SVM and SVM kernel (
Keerthi and
Lin, 2003)
, and boosted trees (Elith et al., 2008). The
cross-entropy is used as the cost function for the
classification tasks. The Gaussian SVM classifier in
accordance with the HRMAD60 feature achieved the
highest accuracy, as shown in Table 1.
Table 1: Classification results using a combination of raw
features and the HRMAD60 feature.
Classifier Accuracy
Decision Tree 92.8%
Logistic Regression 89.5%
Gaussian Naïve Bayes 81.3%
Kernel Naïve Bayes 85.3%
Gaussian SVM 94.5%
SVM Kernel 94.1%
Boosted Trees 93.9%
3.3 Real-Time Analysis Model
To support the real-time analysis, a data model whose
graphical representation is shown in Figure 3, has
been created. Initially, the streaming of the points that
encapsulate all the spatiotemporal and biometric
information collected from the wearable and the
smartphone, is consumed by the Gaussian SVM
machine learning classifier that distinguishes normal
behavior from panic conditions, assigning values of 0
and 1, accordingly.
VISAPP 2023 - 18th International Conference on Computer Vision Theory and Applications
1024
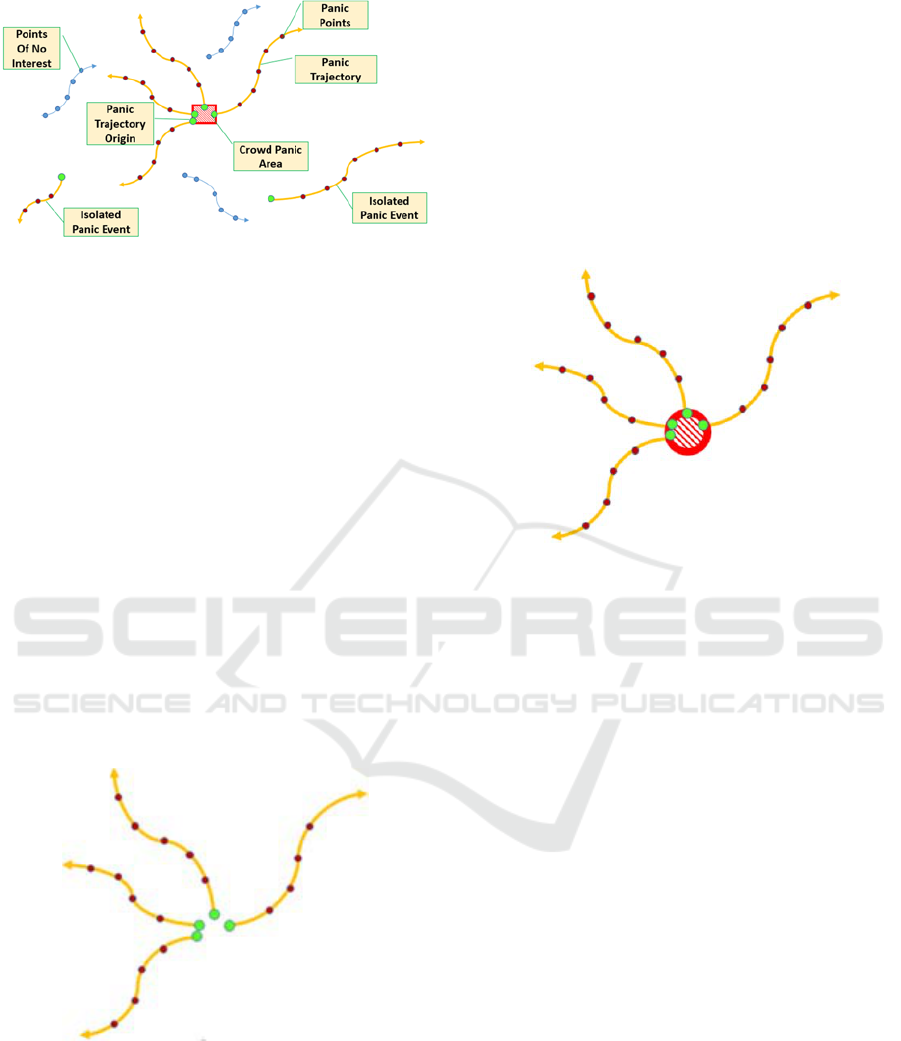
Figure 3: Graphic representation of the data model entities.
This kind of labeling is introduced in this paper as
the Stress Profile Index (SPI) and categorizes the data
into Points of No Interest and Panic Points. The main
entities of the data model are:
Point of No Interest: These are the points that have
been assigned an SPI of 0. These points indicate that
the subject behaves normally, so there is no need to
be further monitored. Their only use is to signal the
end of a sequence of Panic Points.
Panic Point: These are points that contain
biometric information indicating a highly stressed
profile, having an SPI of 1. If this is an isolated
incident after which a Point of No Interest is received
then this is a no-action event, but if there are
consequent PPs this leads to the formation of a Panic
Trajectory.
Panic Trajectory: It is a line whose vertices consist
of consequent Panic Points for a given subject. Such
a line is terminated only when a Point of No Interest
breaks the sequence of Panic Points.
Figure 4: Image showing multiple Panic Trajectory Origins
(green) along with their Panic Trajectories.
Panic Trajectory Origin: It is the very first point
of a Panic Trajectory. Figure 4 depicts an example of
Panic Trajectories that correspond to four subjects.
The brown dots represent Panic Points as
spatiotemporal data (locations in time). The Panic
Trajectory Origins (green dots) of the various subjects
are examined by the algorithm to decide whether
there is a spatiotemporal correlation between them. If
this is true, then this triggers the creation of a Crowd
Panic Area.
Crowd Panic Area: The Crowd Panic Area
denotes the origin of Panic Trajectories whose
starting points are spatially correlated, that is, they are
located within a short distance from each other. It
represents the spatial extent of a potentially stressful
event that is happening, and it is depicted as an area
on the map, as shown in red in Figure 5.
Figure 5: Image showing multiple Panic Trajectories that
are spatially correlated. The red circle shows the Crowd
Panic Area.
4 EXPERIMENTAL RESULTS
For the proof of concept, an experiment involving real
people took place. This group followed a specific
scenario to simulate the gradual development of panic
conditions at a crowd level. Following the
development of the current state of the data model,
their data were used as input in order to create the
Panic Trajectories, the Panic Trajectory Origins, and
the Crowd Panic Areas. In our experiments, six
people were monitored wearing the Samsung Galaxy
Watch and also having the smartphone app on their
mobile device. The participants were acting on the
street starting from relatively the same location of a
common neighborhood as it is presented in the
following paragraphs. The goal was to collect and
analyze their biometric and spatiotemporal data in
real-time to produce the Crowd Panic Area.
The real-time server collected their data
successfully over a UDP connection and transformed
them into points carrying all the appropriate
spatiotemporal and biometric information as
attributes. Consequently, the point data were
analyzed and produced the data model objects,
leading to the creation of the Crowd Panic Area
Real-Time Monitoring of Crowd Panic Based on Biometric and Spatiotemporal Data
1025
around the location where all the actions were
initiated.
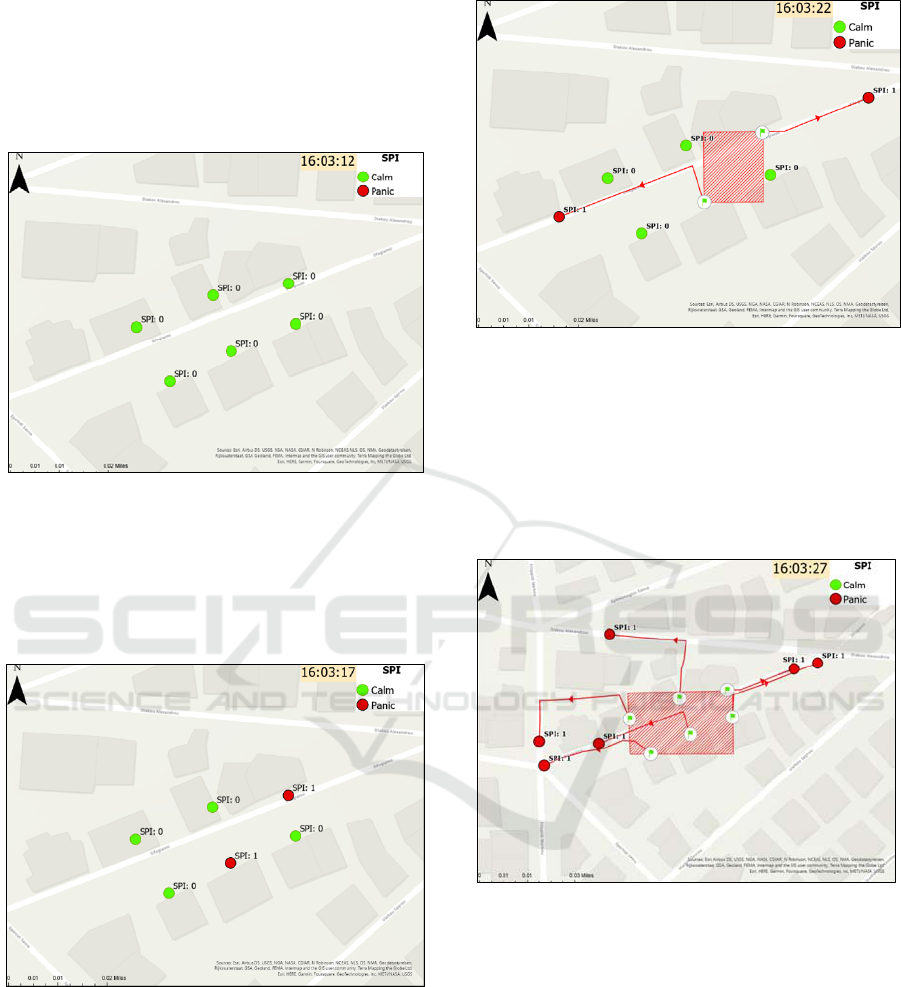
Figure 6 depicts the crowd in their origin
locations, being in a calm state (green dots, SPI = 0).
At this stage all subjects are considered as Points of
No Interest.
Figure 6: Sample crowd in a calm state.
Next, Figure 7 shows that two of the subjects have
been suddenly stressed and this is depicted in their
SPI that has changed to 1. At the same time, their
symbol on the map changes to a red circle and these
two points are now considered as Panic Points.
Figure 7: Two of the subjects switch to a stressed state.
Moving on, Figure 8 reveals that a few seconds
later the two subjects keep showing stressed
conditions and attempt to escape. Once this happens
the system detects that they are moving, still in a
stressed state, which consequently, creates their Panic
Trajectories (red arrowed lines) and Panic Trajectory
Origins (green flags). Also, the initial Crowd Panic
Area comes up as a Minimum Bounding Polygon (red
dashed rectangle).
Figure 8: Stressed subjects attempt to escape. Origins
(green flags) are created and trigger the creation of an initial
Crowd Panic Area.
In Figure 9 the rest of the crowd are also in a panic
state (all SPIs are 1), and their Panic Trajectories and
the Origins are created as well. As a result, the initial
Crowd Panic Area updates its boundaries to reflect
the new conditions.
Figure 9: The Crowd Panic Area is updated in order to
include all the Panic Trajectory Origins.
The above scenario demonstrates how the system
reacts and operates in real-time detecting abnormal
crowd behavior regarding the Stress Profile Index of
the participants, and how it processes the multimodal
data it receives to produce a well-formed result.
5 CONCLUSIONS
In this paper a real-time monitoring system is
proposed that allows crowd panic detection taking
advantage of wearable devices that track real time
VISAPP 2023 - 18th International Conference on Computer Vision Theory and Applications
1026

biometric data in accordance with location
information. The proposed approach creates real-
time trajectories of moving objects that are in panic
state and analyzes them to come up with the detection
of potential crowd panic event areas. Future work
includes the examination of alternative classification
strategies that would increase the panic state
determination accuracy as well as the extension of the
real-time analysis model in order to efficiently
process simultaneously appearing panic events in
spatially distributed groups of subjects.
REFERENCES
Alsalat, G. Y., El-Ramly, M., Fahmy, A. A., & Karim, S.
(2018). Detection of Mass Panic using Internet of
Things and Machine Learning. International Journal of
Advanced Computer Science and Applications, 9(5).
Ammar, H.; Cherif, A. DeepROD: A deep learning
approach for real-time and online detection of a panic
behavior in human crowds. Mach. Vis. Appl. 2021, 32,
57. https://doi.org/10.1007/s00138-021-01182-w.
Andrulis, D. P., Siddiqui, N. J., & Purtle, J. P. (2011).
Integrating racially and ethnically diverse communities
into planning for disasters: the California
experience. Disaster Medicine and Public Health
Preparedness, 5(3), 227-234.
Bui, T.; Sankaran, S. Foundations for Designing Global
Emergency Response Systems (ERS). In Proceedings
of the 3rd International ISCRAM Conference, Newark,
NJ, USA, 13–17 May 2006; pp. 72–81.
Centers for Disease Control Website. Target Heart Rate and
Estimated Maximum Heart Rate. Available online:
https://www.cdc.gov/physicalactivity/basics/measurin
g/heartrate.htm (accessed on 10 August 2022).
Elith, J., Leathwick, J. R., & Hastie, T. (2008). A working
guide to boosted regression trees. Journal of Animal
Ecology, 77(4), 802–813. https://doi.org/10.1111/
j.1365-2656.2008.01390.x
Forbes Health, https://www.forbes.com/health/healthy-
aging/normal-heart-rate-by-age/ (accessed on 10
August 2022).
Hao, Y.; Xu, Z.; Wang, J.; Liu, Y.; Fan, J. An Approach to
Detect Crowd Panic Behavior using Flow-based
Feature. In Proceedings of the 22nd International
Conference on Automation and Computing, Colchester,
UK, 7–8 September 2016; ISBN 9781862181328.
https://doi.org/10.1109/iconac.2016.7604963.
Helbing, D.; Farkas, I.; Vicsek, T. Simulating dynamical
features of escape panic. Nature 2000, 407, 487–490.
https://doi.org/10.1038/35035023.
Hosmer, D. W., Lemeshow, S., & Sturdivant, R. X. (2013).
Applied Logistic Regression. Wiley Series in
Probability and Statistics. https://doi.org/10.1002/
9781118548387
Keerthi, S. S., & Lin, C.-J. (2003). Asymptotic Behaviors
of Support Vector Machines with Gaussian Kernel.
Neural Computation, 15(7), 1667–1689. https://
doi.org/10.1162/089976603321891855
Kumar, A. (2012). Panic detection in human crowds using
sparse coding (Master's thesis, University of Waterloo).
Kutsarova, V., & Matskin, M. (2021, July). Combining
Mobile Crowdsensing and Wearable Devices for
Managing Alarming Situations. In 2021 IEEE 45th
Annual Computers, Software, and Applications
Conference (COMPSAC) (pp. 538-543). IEEE.
Lazarou, I., Kesidis, A. L., Hloupis, G., & Tsatsaris, A.
(2022). Panic Detection Using Machine Learning and
Real-Time Biometric and Spatiotemporal Data. ISPRS
International Journal of Geo-Information, 11(11), 552.
Li, L. Education supply chain in the era of Industry 4.0.
Syst. Res. Behav. Sci. 2020, 37, 579–592.
https://doi.org/10.1002/sres.2702.
Li, N.; Sun, M.; Bi, Z.; Su, Z.; Wang, C. A new
methodology to support group decision-making for
IoT-based emergency response systems. Inf. Syst.
Front. 2014, 16, 953–977. https://doi.org/10.1007/s10
796-013-9407-z.
Lin, Y.; Duan, X.; Zhao, C.; Xu, L. Systems Science
Methodological Approaches; CRC Press: Boca Raton,
FL, USA; Taylor & Francis: Abingdon, UK, 2012;
ISBN 978-1-4398-9551-1.
Lin, P., Ma, J., & Lo, S. (2016). Discrete element crowd
model for pedestrian evacuation through an exit.
Chinese Physics B, 25(3), 034501.
Loh, W.-Y. (2014). Fifty Years of Classification and
Regression Trees. International Statistical Review,
82(3), 329–348. https://doi.org/10.1111/insr.12016
Ren, J., Lee, S. D., Chen, X., Kao, B., Cheng, R., & Cheung,
D. (2009). Naive Bayes Classification of Uncertain
Data. 2009 Ninth IEEE International Conference on
Data Mining. https://doi.org/10.1109/icdm.2009.90
Sufri, S., Dwirahmadi, F., Phung, D., & Rutherford, S.
(2020). A systematic review of community engagement
(CE) in disaster early warning systems (EWSs).
Progress in Disaster Science, 5, 100058.
Tsai, C. H., Chen, P. C., Liu, D. S., Kuo, Y. Y., Hsieh, T.
T., Chiang, D. L., ... & Wu, C. T. (2022). Panic Attack
Prediction Using Wearable Devices and Machine
Learning: Development and Cohort Study. JMIR
Medical Informatics, 10(2), e33063.
Xu, L. Introduction: Systems science in industrial sectors.
Syst. Res. Behav. Sci. 2013, 30, 211–213.
Xu, L.; Cai, L.; Zhao, S.; Ge, B. Editorial: Inaugural Issue.
J. Ind. Integr. Manag. 2016, 1, 1601001.
https://doi.org/10.1142/s2424862216010016.
Xu, L.D. The contribution of systems science to Industry
4.0. Syst. Res. Behav. Sci. 2020, 37, 618–631.
Real-Time Monitoring of Crowd Panic Based on Biometric and Spatiotemporal Data
1027
