
Interactive Exploration of Complex Heterogeneous Data:
A Use Case on Understanding City Economics
Rainer Splechtna
1
, Thomas Hulka
1
, Disha Sardana
2
,
Nikitha Donekal Chandrashekar
2
, Denis Gra
ˇ
canin
2 a
and Kre
ˇ
simir Matkovi
´
c
1 b
1
VRVis Research Center, Vienna, Austria
2
Virginia Tech, Blacksburg, Virginia, U.S.A.
Keywords:
Visualization, Visual Analytics, Complex-data Exploration, and Analysis.
Abstract:
The analysis of complex, heterogeneous data containing spatial and temporal components is a non-trivial task.
Besides data heterogeneity and data quantity, the exploratory nature of data analysis tasks, which are only
roughly specified when analysis starts and are refined during the analysis, poses main challenges. In this paper,
we describe a holistic approach to interactive visual analysis of such data. We use the IEEE VAST Challenge
2022 data set for this purpose. To support the exploratory tasks dealing with the economic health of a city,
we apply different data processing, introduce new views, and employ complex interactions. All these steps
are necessary for an efficient workflow. We rely on the well-known paradigm of coordinated multiple views.
In addition to the standard views, we introduce the interactive map view, which supports the visualization of
different statistical values on the map itself. All views are interactive and support multiple composite brushing.
Our results illustrate the effectiveness of our approach and show its applicability to similar data and tasks.
1 INTRODUCTION
The interactive visual analysis represents an impor-
tant counterpart to purely automatic data analysis, es-
pecially for exploratory tasks problems that are not
clearly specified. In such cases, a data analyst is in-
terested in understanding data, getting an overview
and insight about trends and patterns, and, eventu-
ally, getting an insight into data and underlying phe-
nomena or systems. Advancements in sensor, com-
puting, and storage technology result in ever-growing
data. A large variety of data collection methods leads,
at the same time, to data complexity. The resulting
data assembled from various sources is then often un-
structured, incomplete, or erroneous. An excellent
example of such data is the IEEE VAST Challenge
2022 data set (Crouser and Cook, 2022). It is a large
data set consisting of many files with a total size of
16.7 GBytes.
There are many possibilities for how to approach
such large and complex data. He et al. recently de-
scribed how hard it is for students to approach the
analysis of complex data such as VAST Challenge
data (He et al., 2022). Due to the exploratory nature of
a
https://orcid.org/0000-0001-6831-2818
b
https://orcid.org/0000-0001-9406-8943
the analysis tasks, an interactive solution coupled with
automatic analysis often represents the first choice for
data analysis.
The IEEE VAST Challenge 2022 deals with the
fictitious city of Engagement in Ohio. The analaysis
is divided into three challenges, each covering a dif-
ferent aspect. A large number of challenge entries and
the variety of the proposed solutions proves the rele-
vance of the problem and the need for novel solutions,
which advance the current state-of-the-art.
In this paper, we describe how we approach the
2022 IEEE VAST Challenge Three, Economic, which
deals with the financial health of the city. Since the
tasks are of exploratory nature, we rely on an interac-
tive solution. We present our comprehensive solution
to the the problem of analysis of complex data sets,
including spatial and temporal components, among
other attributes, that describe citizens and businesses
in a city. We describe the whole workflow, including
data processing, which results in structured data sets,
visualization, and interaction design that goes beyond
standard views. We also provide a brief evaluation
and a description of our findings.
Although we do provide a novel map view, in
this paper, we are not primarily concerned with in-
troducing novel visualization techniques. Our focus
214
Splechtna, R., Hulka, T., Sardana, D., Chandrashekar, N., Gra
ˇ
canin, D. and Matkovi
´
c, K.
Interactive Exploration of Complex Heterogeneous Data: A Use Case on Understanding City Economics.
DOI: 10.5220/0011787500003417
In Proceedings of the 18th International Joint Conference on Computer Vision, Imaging and Computer Graphics Theory and Applications (VISIGRAPP 2023) - Volume 3: IVAPP, pages
214-221
ISBN: 978-989-758-634-7; ISSN: 2184-4321
Copyright
c
2023 by SCITEPRESS – Science and Technology Publications, Lda. Under CC license (CC BY-NC-ND 4.0)

is on leveraging the capabilities of coordinated multi-
ple views in a complex analysis setting. Our contri-
butions can be summarized as follows: (1) An inte-
grated visual analytics framework that supports inter-
active analysis of complex, unstructured data; and (2)
A novel map view that integrates descriptive statistics
visualization with the conventional map. Interaction
and on-the-fly data aggregation are supported in order
to cope with data size and complexity.
2 RELATED WORK
“Visual analytics is the science of analytical
reasoning facilitated by interactive visual inter-
faces.” (Thomas and Cook, 2005). One of the main
challenges of visual analytics is dealing with a huge
amount of heterogeneous data since the analysts of-
ten fail to fully grasp the presented data due to the
cognitive overload (Thomas and Cook, 2005). There-
fore, it is critical that analysts can interactively filter,
visualize, and navigate data to reduce the cognitive
overload (Card et al., 1999).
Interactive exploration of data can be facilitated
by providing customized views and by simultane-
ously providing multiple perspective of the data set.
Coordinated Multiple Views (CMVs) provide such
multiple simultaneous perspectives of the data and al-
low integration of customized views (Roberts, 2007),
thus providing a deeper understanding of data. The
user can interactively select some of the data items in
one view (brushing), and all items that belong to the
same records will be highlighted in all other views
(linking) (Buja et al., 1991; Roberts, 2007). Brush-
ing and linking are two essential aspects of interacting
with high-dimensional data.
Visual analysis of spatio-temporal data, including
movement and mobility data (Andrienko et al., 2013;
Pelekis and Theodoridis, 2014), provides many op-
portunities for data-driven analysis, especially related
to the urban computing issues and the related big data
(e.g., human mobility and traffic) challenges (Zheng
et al., 2014). Such data includes a large number of
time-series data that have geo-located attributes. Cus-
tomized views that are a part of a CMV system sup-
port simultaneous interactive visualization and analy-
sis of such time series ensembles.
Visual analytics is very important for urban com-
puting (Fortini and Davis, 2018) and urban informat-
ics, a discipline that integrates urban science, geo-
matics, and informatics (Shi et al., 2021). Urban vi-
sual analytics can be combined with automatic analyt-
ical approaches to support data exploration and visual
learning (Zheng et al., 2016). Clarinval and Dumas
provide a review of urban data visualization (Clarin-
val and Dumas, 2022).
3 DATA AND TASKS
The VAST Challenge simulates a long-term exper-
iment in the fictitious city of Engagement, Ohio.
The idea is that the city conducts a participatory ur-
ban planning experiment. About a thousand citizens
agreed to provide data using a city’s planning app.
The app records the places they visit, their spending,
their purchases, and many other things. The city will
use the data to assist its city revitalization plans. Vi-
sual analytics is identified as a promising way of mak-
ing insights into collected data.
The data itself is divided into several files having
different structures. The following files are available:
• Journals. The journals include financial, travel,
social, and check-in data that consists of individ-
ual events, such as banking account activity (fi-
nancial) or visits to various places (check-in).
• Attributes. There are eight attributes files.
They describe, among others, schools (loca-
tion, capacity, . . . ), apartments (location, bed-
room count,. . . ), or citizens themselves (educa-
tion level, interest group, apartment ID, . . . ).
• Activity Logs. The activity logs record the status
of each participant with a time step of five min-
utes. For each time step and participating citizen,
we have position, bank balance, sleep or hunger
status, etc.
Along with the data, the analysis tasks are also de-
fined. The main task is to consider the financial health
of the city (Crouser and Cook, 2022). Analysis of this
data shall answer questions like which businesses are
growing or shrinking over time, how people change
jobs, or whether standards of living improve or de-
cline over time. Three specific tasks are defined:
1. Over the period covered by the data set, which
businesses appear to be more prosperous? Which
appears to be struggling?
2. How does the financial health of the residents
change over the period covered by the data set?
How do wages compare to the overall cost of liv-
ing in Engagement? Are there groups that appear
to exhibit similar patterns?
3. Describe the health of the various employers
within the city limits. What employment patterns
do you observe? Do you notice any areas of par-
ticularly high or low turnover?
Interactive Exploration of Complex Heterogeneous Data: A Use Case on Understanding City Economics
215
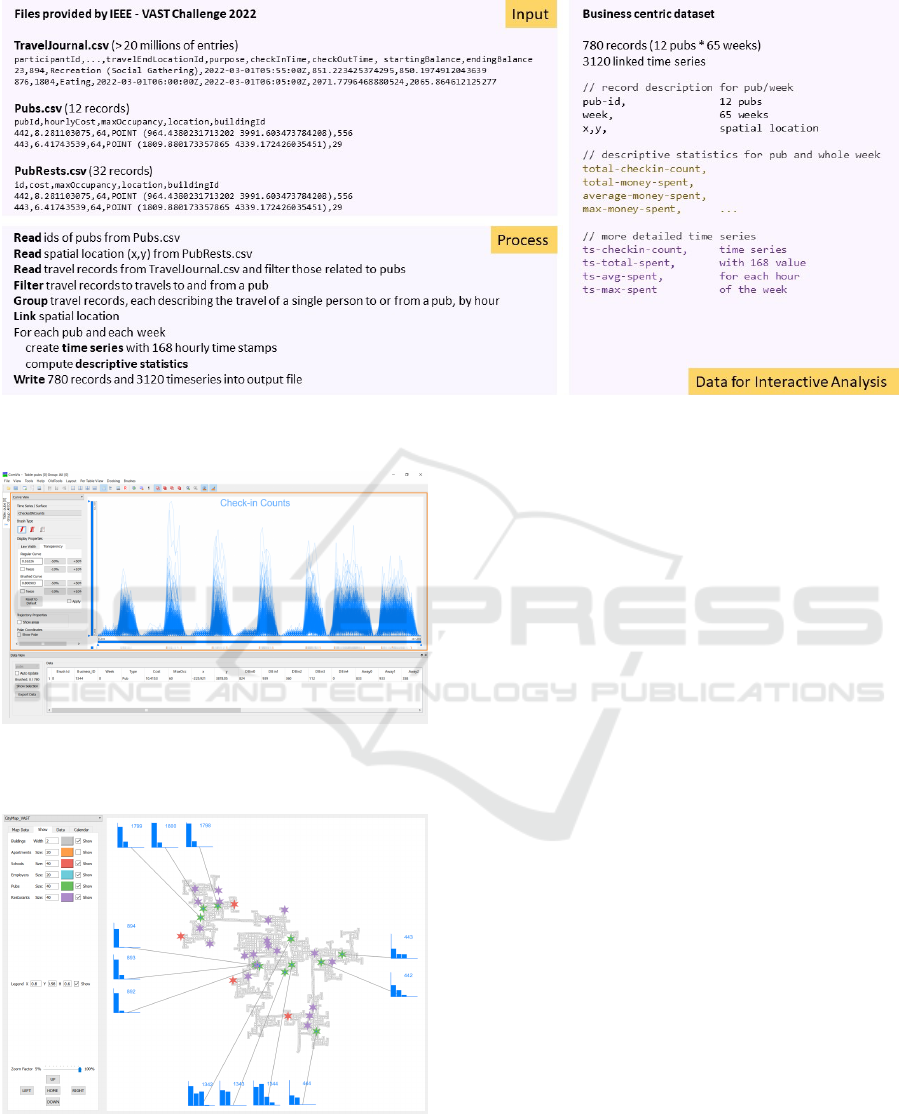
Figure 1: Data pre-processing for one of the business-centric data sets, the weekly pub visit seasonality. Similar steps are
needed to create other data sets as well.
Figure 2: The curve view showing the check-in counts for
each pub and for each week as a time series. Patterns are
different for weekdays and weekends.
Figure 3: The newly developed map view shows various
businesses as colored stars, and, for the selected businesses
(pubs here), distribution of additional statistics.
Notably, no metrics are defined that strictly define
what it means that businesses are doing well. In or-
der to answer such questions, an interactive approach
with human in the loop is needed. It is in the course of
analysis that we refine our understanding of the task
and how we can tackle it in view of the available data.
Depending on the task and, in particular, on the
subject of interest, we create a different data set that
allows us to interactively refine our focus. We use
different data sets to analyze citizens and businesses.
Data processing was carried out by several F# and
Python scripts that read and write flat files.
Most of the analysis methods require tabular data
where each row represents a record and each col-
umn an attribute. In addition to common table data,
where attributes are numeric or categorical values, we
also allow curves, i.e., a sequence of (x, y) pairs, to
be a record’s attribute, as described by Konyha et
al. (Konyha et al., 2006). In our example, we create a
citizen-centric data set, where each record represents
a citizen, a business-centric data set, where each row
corresponds to a business in the city; and several sub-
sets of the business data set, where we focus only on
a particular business type, e.g. pubs or restaurants.
The citizen-centric data set contains attributes
such as apartment location, household size, educa-
tion level, and interest group. In addition to these
scalar attributes, which are easily extracted from the
provided data files, we compute time series attributes,
such as spending for education, recreation, or account
balance. This special attribute has a sequence of pairs
of time and amount spent on education.
For the business-centric tasks, we create a data set
where each record corresponds to a business and pro-
vides scalar attributes (e.g., the number of guests), de-
scriptive statistics such as total, maximum, and aver-
IVAPP 2023 - 14th International Conference on Information Visualization Theory and Applications
216
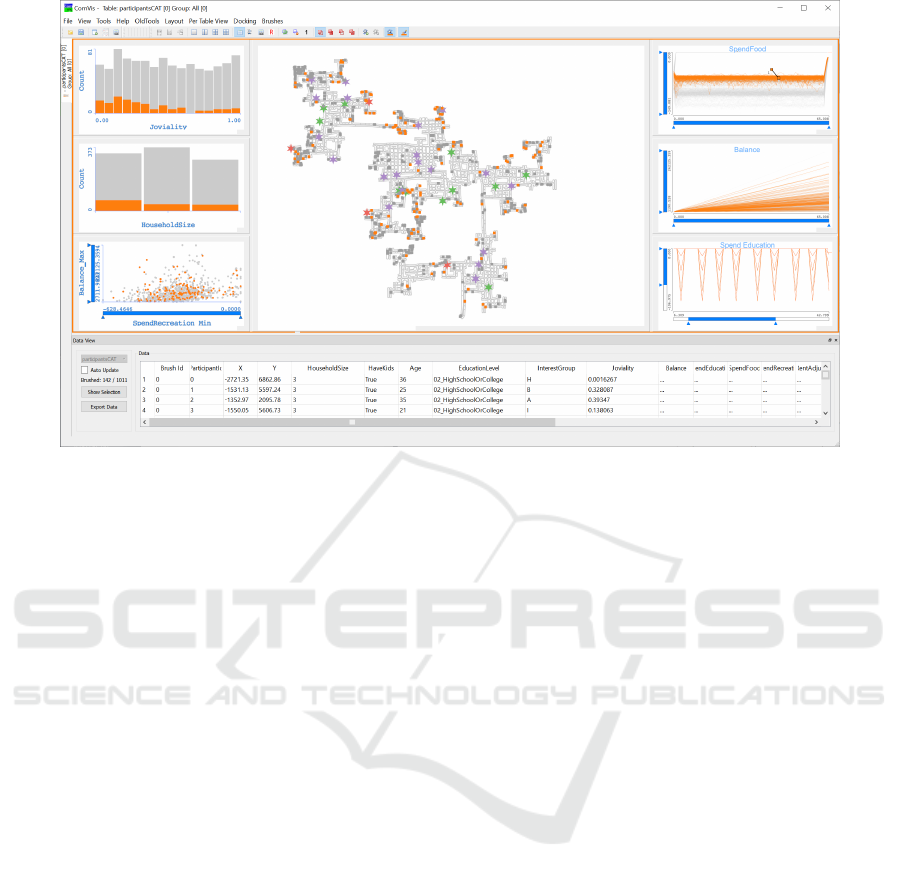
Figure 4: A snapshot from an analysis session. The citizen-centric data is used, and scalar attributes are shown on the left, the
map view is in the center, and the time series attributes are shown on the right. Details for the brushed data are shown in the
data table at the bottom. The views can be freely configured. One possible configuration is shown here.
age spending of customers, and time series attributes
that describe how income, number of visits, or other
values change over time. Figure 1 shows the structure
of the business-centric table.
Figure 2 shows the number of visitors that entered
pubs on a weekly basis. For each pub and for each
week during the time interval captured in the data, the
number of visitors in each hour is shown as a curve.
We can clearly see different patterns for weekends and
for weekdays. Interestingly, when we aggregated the
data to show aggregated numbers per weekday, we re-
alized that Monday had some irregularity. The guests
that came to a pub after midnight on Sunday nights
are technically Monday guests. For the analysis of
the weekly seasonality pattern, however, they should
be counted as Sunday guests. We, shifted seven bins
for each day of the week such that they align with the
citizen’s sleep and awake cycles so that a day refers
to the time from 3 AM until 3 AM of the next day.
From our experience, no matter how well-planned
the data processing is, the analysts often need some
additional data aggregates during the analysis. If sys-
tems and tools do not support on-the-fly data aggre-
gation and derivation (Konyha et al., 2012), the anal-
ysis has to be stopped, data has to be processed again,
and the analysis continues. On-the-fly data derivation
makes the workflow much more fluent. We support
data derivation and aggregation so that the users can,
e.g., compute scalar curve aggregates or curve aggre-
gates (e.g., the first derivative).
4 VISUAL MAPPING AND
INTERACTION DESIGN
Due to the exploratory nature of the analysis tasks,
we decided to rely on the well-known coordinated
multiple-views paradigm. The standard views, e.g.
histograms, parallel coordinates, or scatter plots, are
not sufficient to analyze our data. The spatial and tem-
poral components require additional views.
As the data is provided in a context of a city, a
map view becomes our central view. We have de-
signed a new, freely configurable map view to sup-
port analysis tasks. The newly developed map view
loads coordinates of buildings, apartments, and busi-
nesses from several files and depicts the spatial con-
text. Each business type can be represented with its
own color and symbol. The user can configure vari-
ous parameters, such as what is shown, which colors
and glyph sizes are used, etc. In addition to the loaded
data, various aggregated statistic values for businesses
can be shown. We provide histograms associated with
the individual businesses as an overlay. Each his-
togram is additionally connected to its related busi-
ness in order to reduce mental load when associating
histograms with buildings. Figure 3 shows the map
view and its control. The histograms in Figure 3 show
selected statistics for each pub. The histograms show
the distribution of distances which customers travel
on their way towards a pub. Most of the customers
Interactive Exploration of Complex Heterogeneous Data: A Use Case on Understanding City Economics
217
do not travel far in order to reach the pub. There are
just a few pubs with customers from far away. Such
overview statistics help in identifying widely popular
pubs.
The map view is integrated into the coordinated
multiple views system alongside standard views. Fig-
ure 4 shows a snapshot from an analysis of a citizen-
centric data set. The map view is in the central posi-
tion and shows apartments where citizens live as gray
and orange dots, as well as schools, pubs, and restau-
rants as stars. The views on the left show the scalar at-
tribute available for each citizen, and the curve views
on the right show the time-dependent attributes. The
details for the brushed data are shown at the bottom.
All views are linked, and composite brushing is
supported. The user can interactively select a sub-
set of data in any view, and the corresponding items
in all views will be highlighted. Several brushes can
be combined using Boolean operations to form com-
posite brushes. Multiple composite brushes are sup-
ported to ease comparisons. Depending on the view
type, different brushing interactions are supported. In
a histogram, the user can select one or more bins. In
a scatter plot, a rectangular area can be selected. The
curve view supports the line brush, i.e., the user draws
a line, and all curves that cross the line are selected.
Finally, in the map view, the user can zoom and pan,
move the overlaid histograms, select what is shown,
define dots and glyph sizes, etc.
5 INTERACTIVE EXPLORATION
AND ANALYSIS
We have used the above-presented system to analyze
the Challenge data. As stated above, depending on the
tasks, we use either the citizen-centric or the business-
centric data set. In the following, we briefly describe
some of the interesting findings for both data sets.
5.1 Business-centric Analysis
For the business-centric tasks described in Section 3
we utilize the data specifically tailored for these tasks.
Business Prosperity Analysis. It should answer
these questions: Which businesses appear to be more
prosperous? Which appears to be struggling?
For the first step of the analysis, we look at an
overview of the provided data. In particular, we look
at the turnover (for pubs and restaurants) or wages
(for workplaces) and the number of customers (for
pubs and restaurants) or the number of employees (for
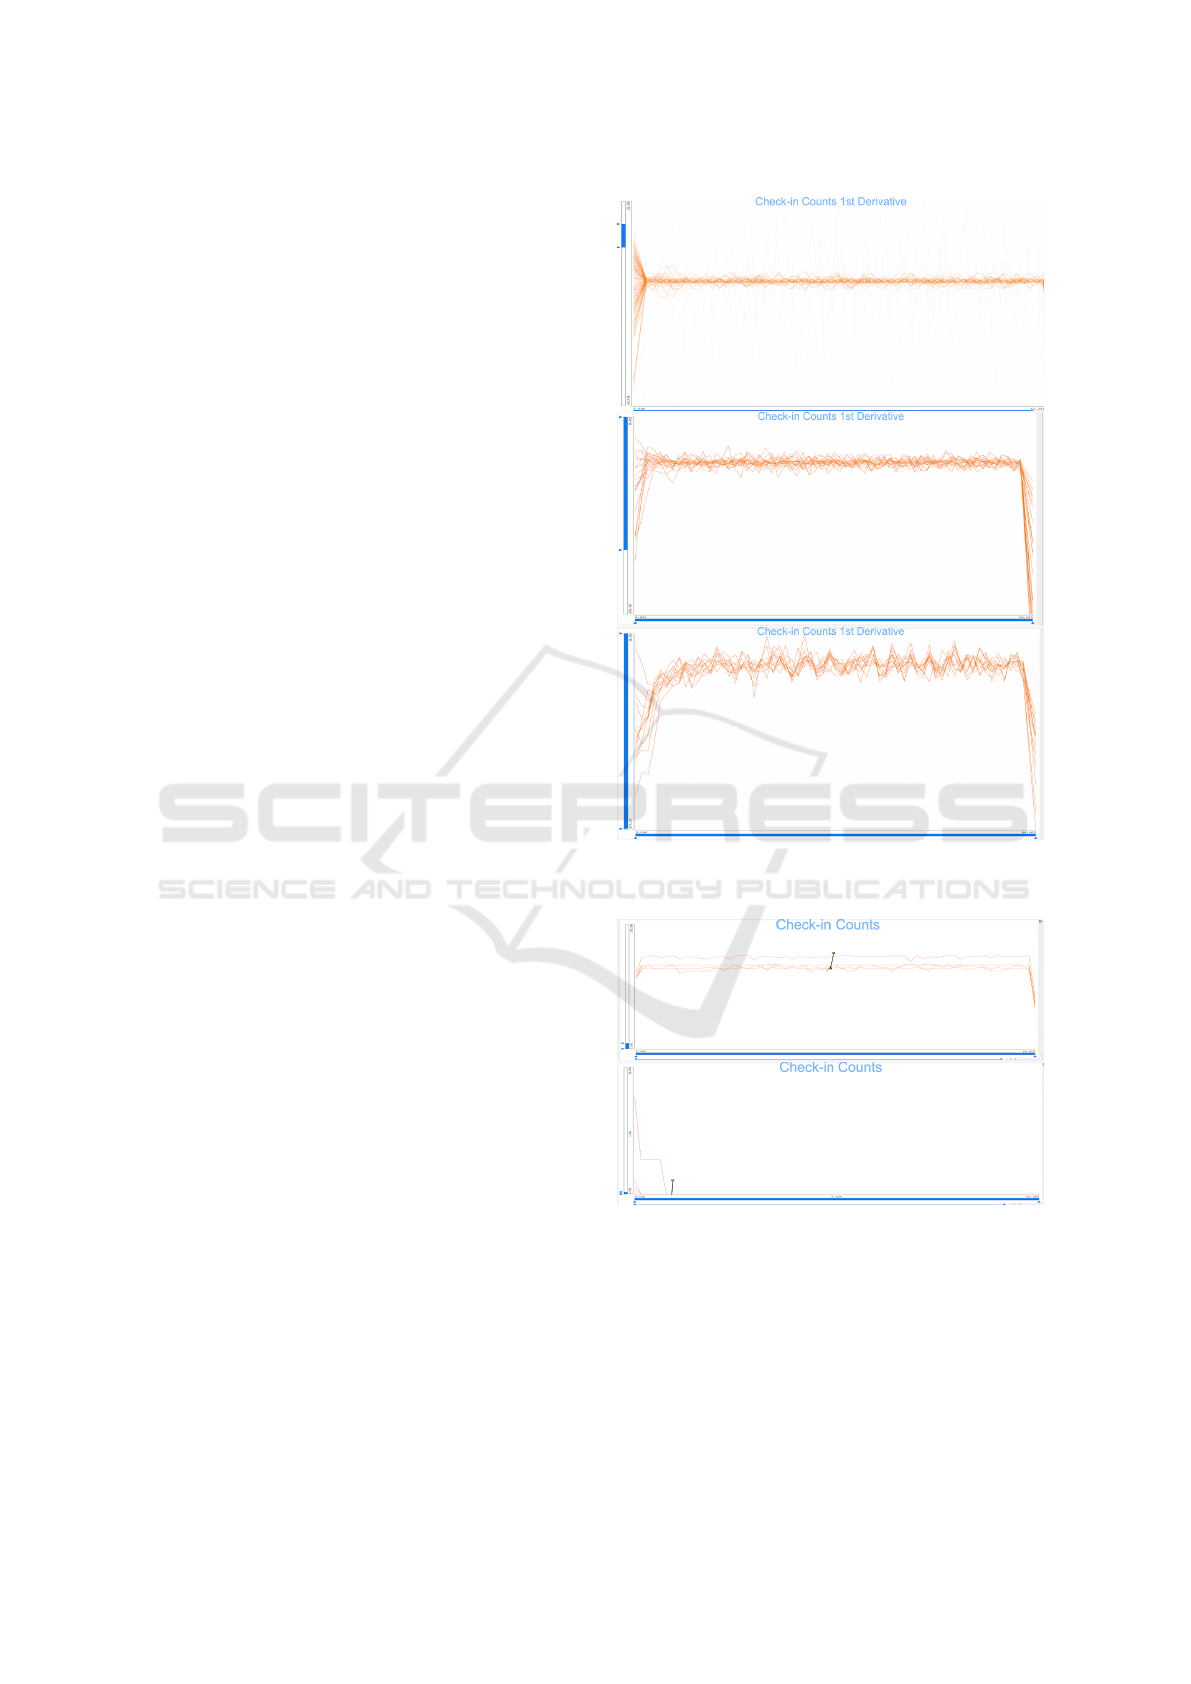
Figure 5: The first derivative of the number of check-ins at
workplaces (top), restaurants (middle), and pubs (bottom).
Figure 6: The number of check-ins for workplaces, the top-
most curves (top) and the bottom-most curve (bottom).
workplaces). For workplaces, we infer the number of
employees from the number of check-ins. The stabil-
ity of a business is inferred from the first derivatives
of the aforementioned numbers.
Figure 5-top shows the first derivative of the num-
ber of check-ins at workplaces per week. The situ-
ation is rather stable after the first couple of weeks,
IVAPP 2023 - 14th International Conference on Information Visualization Theory and Applications
218
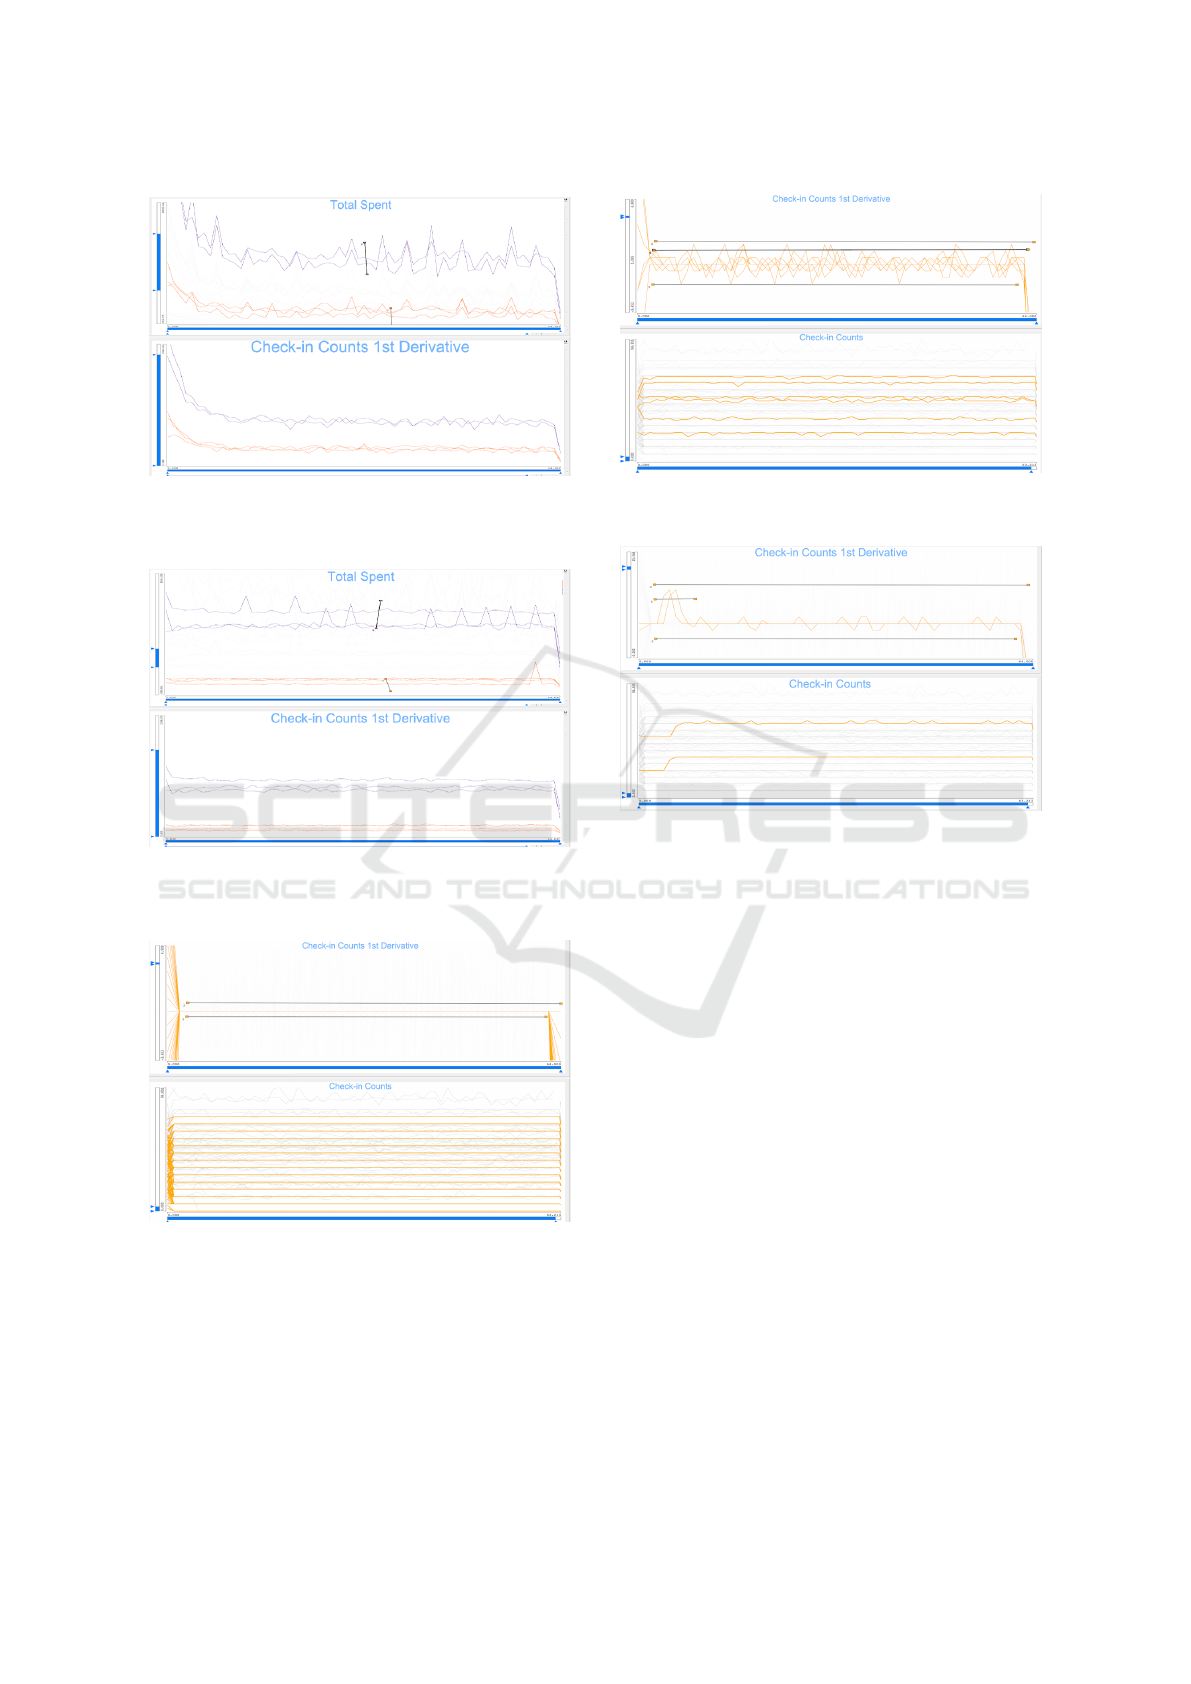
Figure 7: Top-most and bottom-most curves of turnover for
pubs (top). The check-in counts correlate with the selected
turnovers (bottom).
Figure 8: Top-most and bottom-most curves of turnover for
restaurants (top). The check-in counts correlate with the
selected turnovers (bottom).
Figure 9: Top: Using multiple brushes to limit the first
derivative of check-ins at workplaces to zero within the
“stable” weeks. Bottom: The number of “stable” check-
ins/employees ranges from small to large businesses.
i.e., the change in the number of employees is rather
low. The variation in wages per workplace over time
is also quite low and correlates with the stable number
of employees. Figure 5-middle shows the first deriva-
tive of the number of check-ins at restaurants. This
Figure 10: Using multiple brushes to limit the first deriva-
tive of check-ins at workplaces to plus/minus three.
Figure 11: Using multiple brushes to find workplaces that
have a large raise of the number of employees but no decline
using the first derivative of check-ins at workplaces.
also shows a rather stable behavior after the first cou-
ple of weeks. Figure 5-bottom shows the first deriva-
tive of the number of check-ins at pubs. This shows
the most fluctuation and can probably be attributed
to the nature of the business with special events like
bands playing at the pub or public viewing events.
All three derivatives show a common pattern of
disarray, mostly decline, in the first three weeks of
the time span covered by the data before reaching the
rather stable behavior mentioned above. The decline
at the end of the observed time period stems from the
fact that we aggregate the data per calendar week, but
the last four days of the last week are not provided.
The prosperity of a business is inferred from the
number of employees (workplaces) or the turnover
(pubs and restaurants). We brush the top-most curves
of the number of check-ins to select prosperous work-
places (Figure 6-top). The data table, shown in Fig-
ure 4 at the bottom, can then be used to retrieve the
details for the brushed data, the top five workplaces
in this case.
Likewise, we brush the bottom-most curves of the
number of check-ins to select struggling/small work-
Interactive Exploration of Complex Heterogeneous Data: A Use Case on Understanding City Economics
219
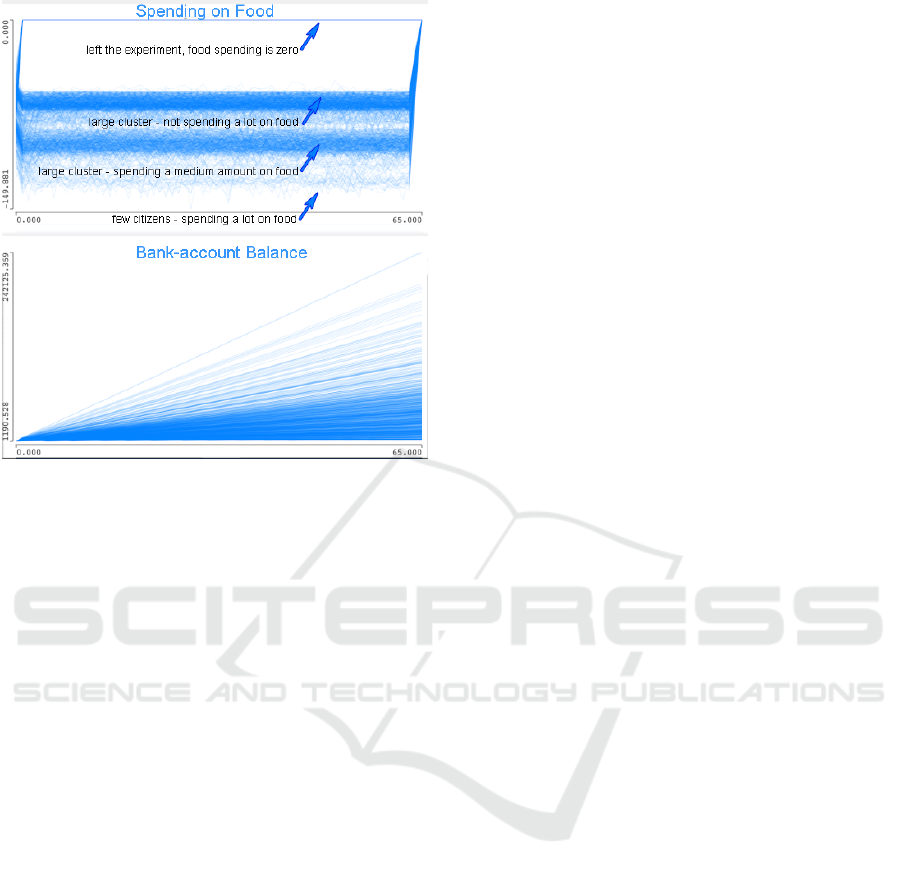
Figure 12: The spending on food and the money balance
curves for all citizens. There are four main groups of food
spending. The money balance of citizens increases at dif-
ferent slopes.
places (Figure 6-bottom). This gives us three work-
places that went out of business during the tumultuous
first weeks of the observed time period.
In a similar fashion, we brushed the top-most
turnovers for pubs (Figure 7) and restaurants (Fig-
ure 8) and bottom-most turnovers to determine pros-
perous (purple) and struggling (orange) businesses.
Business Health Analysis. It should answer this
question: What employment patterns do you observe?
To describe the health of a business, we opt for evalu-
ating the dynamics of the employment situation.
The first pattern we observe is one of stability,
shown in Figure 9. When omitting the first three
weeks and the last (due to data artifacts), we see that
at 162 of 251 ( 65%) workplaces, ranging from small
to large businesses, the number of employees does not
change at all.
We can reveal additional patterns for the number
of employees by changing the brush to include ever
higher values of the first derivative of check-ins in
workplaces, i.e., the change in the number of employ-
ees. For 34 of 251 ( 14%) workplaces, the change
in the number of employees is minimal (plus/minus
one); for 19 of 251 ( 8%) workplaces, the change
in the number of employees is just plus/minus two
employees, and for 9 of 251 ( 3.5%) workplaces the
change in the number of employees is plus/minus
three employees (Figure 10).
We also detect two workplaces that raise their
number of employees and stay at this new level (Fig-
ure 11) and one workplace that goes bankrupt and one
that loses half of its employees but stays in business.
5.2 Citizen-centric Analysis
Food, Money, and Joviality: Let us now take a
closer look at two curve views from Figure 4. Fig-
ure 12 shows the spending on food curves and the
money balance curves. We can discern four groups
of curves for food spending. There are participants
who left the experiments, so their spending on food is
zero. Then, there is a large cluster of citizens who do
not spend a lot, and there are many citizens who have
a medium spending on food. Finally, just a few of the
citizens spend a lot on food.
If we brush the citizens with high spending on
food (orange brush in Figure 13), we see that all of
them have a relatively low account balance and a rel-
atively high joviality value at the same time. If we
create another brush now and select citizens with high
account balance (purple brush in Figure 13), we see
that they do not spend much on food and have rela-
tively low joviality values. The map view shows us
where the two brushed groups live. We can see that
the two groups live next to each other in some parts
of the city and that they are separated in other parts.
6 CONCLUSION
A holistic analysis of complex data can be success-
fully performed with the help of visual analytics.
Especially for exploratory analysis tasks, interactive
methods are the first choice.
Due to the complexity and heterogeneity of data
and tasks, extensive data processing is often required,
resulting in multiple data sets. It is important to cor-
rectly identify the object of interest and decide what
constitutes an atomic data item. We have highlighted
two possibilities (out of many) in this paper, one with
the citizen as the primary focus and one with busi-
nesses as the main focus.
Custom views are also often needed when analyz-
ing such complex data. Our newly introduced map
view was often used as the central view in the analy-
sis. Its multiple customization options may seem too
complicated at first glance, but once the view is con-
figured and saved, the analysis is very efficient. The
ability to let the user choose what to display is much
appreciated by advanced users. Reasonable default
values are very important and reduce the steepness of
the learning curve. A single view is by no means suf-
IVAPP 2023 - 14th International Conference on Information Visualization Theory and Applications
220
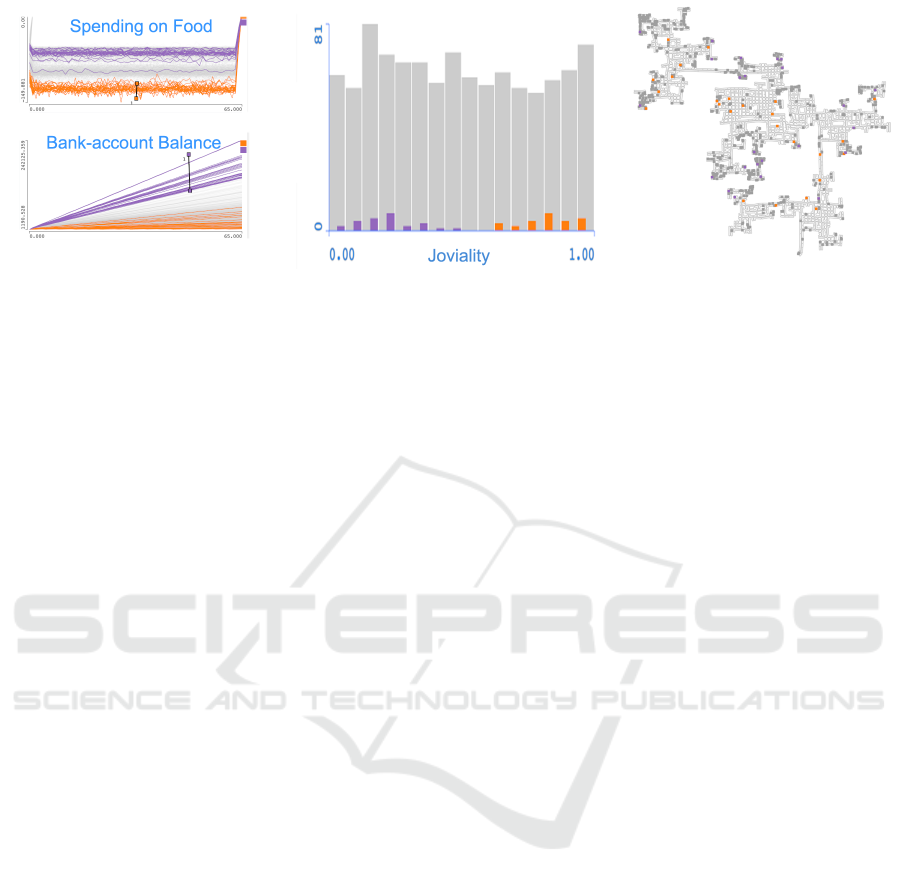
Figure 13: Only relevant views from Figure 4 are shown here. We select the citizens who spend a lot on food (orange brush)
and see that they have a low bank account balance and high joviality values. If we select the citizens who have a lot of money
(purple brush), we see that they do not spend a lot on food and are not happy! The map shows where they live.
ficient for a thorough analysis. CMVs with support
for complex brushing allow for efficient exploration
of different hypotheses and understanding of the data.
We plan to further improve the newly proposed
map view, introduce new views as needed, and com-
bine the interactive approach with automated analy-
sis methods in the future. Two additional challenges
that are defined for the same data as part of the 2022
VAST Challenge will be used for evaluation. In addi-
tion, we plan to apply the approach described here to
real-world data.
ACKNOWLEDGEMENTS
VRVis is funded by BMK, BMDW, Styria, SFG, Ty-
rol, and Vienna Business Agency in the scope of
COMET – Competence Centers for Excellent Tech-
nologies (879730), which is managed by FFG. Parts
of this work have been supported by Virginia Tech In-
stitute for Creativity, Arts, and Technology.
REFERENCES
Andrienko, G., Andrienko, N., Bak, P., Keim, D., and
Wrobel, S. (2013). Visual Analytics of Movement.
Springer, Berlin.
Buja, A., McDonald, J. A., Michalak, J., and Stuetzle, W.
(1991). Interactive data visualization using focusing
and linking. In Proceeding of the IEEE Conference
on Visualization ’91, pages 156–163.
Card, S. K., Mackinlay, J., and Shneiderman, B., editors
(1999). Readings in Information Visualization: Us-
ing Vision to Think. Interactive Technologies. Morgan
Kaufmann, San Francisco.
Clarinval, A. and Dumas, B. (2022). Intra-city traffic data
visualization: A systematic literature review. IEEE
Transactions on Intelligent Transportation Systems,
23(7):6298–6315.
Crouser, R. J. and Cook, K. (2022). VAST Chal-
lenge 2022. https://vast-challenge.github.io/2022/
description.html. [Online; accessed 15-November-
2022].
Fortini, P. M. and Davis, C. A. (2018). Analysis, integra-
tion and visualization of urban data from multiple het-
erogeneous sources. In Proceedings of the 1st ACM
SIGSPATIAL Workshop on Advances on Resilient and
Intelligent Cities, pages 17–26, New York. Associa-
tion for Computing Machinery.
He, E. W., Tolessa, D., Suh, A., and Chang, R. (2022).
Analysis without data: Teaching students to tackle the
vast challenge. arXiv.
Konyha, Z., Le
ˇ
z, A., Matkovi
´
c, K., Jelovi
´
c, M., and Hauser,
H. (2012). Interactive visual analysis of families
of curves using data aggregation and derivation. In
Proceedings of the 12th International Conference on
Knowledge Management and Knowledge Technolo-
gies, i-KNOW ’12, New York. Association for Com-
puting Machinery.
Konyha, Z., Matkovic, K., Gracanin, D., Jelovic, M., and
Hauser, H. (2006). Interactive visual analysis of fami-
lies of function graphs. IEEE Transactions on Visual-
ization and Computer Graphics, 12(6):1373–1385.
Pelekis, N. and Theodoridis, Y., editors (2014). Mobility
Data Management and Exploration. Springer, New
York.
Roberts, J. C. (2007). State of the art: Coordinated mul-
tiple views in exploratory visualization. In Proceed-
ings of the Fifth International Conference on Coordi-
nated and Multiple Views in Exploratory Visualization
(CMV ’07), pages 61–71. IEEE.
Shi, W., Goodchild, M. F., Batty, M., Kwan, M.-P., and
Zhang, A., editors (2021). Urban Informatics. The
Urban Book Series. Springer, Cham.
Thomas, J. J. and Cook, K. A., editors (2005). Illuminating
the path: The Research and Development Agenda for
Visual Analytics. IEEE Computer Society.
Zheng, Y., Capra, L., Wolfson, O., and Yang, H. (2014).
Urban computing: Concepts, methodologies, and ap-
plications. ACM Transactions on Intelligent Systems
and Technology, 5(3).
Zheng, Y., Wu, W., Chen, Y., Qu, H., and Ni, L. M. (2016).
Visual analytics in urban computing: An overview.
IEEE Transactions on Big Data, 2(3):276–296.
Interactive Exploration of Complex Heterogeneous Data: A Use Case on Understanding City Economics
221
