
Image Quality Assessment in the Context of the Brazilian Electoral
System
Marcondes Ricarte da Silva J
´
unior
1 a
, Jairton da Silva Falc
˜
ao Filho
1 b
, Zilde Souto Maior Neto
1 c
,
Julia Dias Tavares de Souza
1
Vin
´
ıcius Lima Ventura
1
and Jo
˜
ao Marcelo Teixeira
2 d
1
Informatics Center, Universidade Federal de Pernambuco, Recife, Brazil
2
Electronics and Systems Department, Universidade Federal de Pernambuco, Recife, Brazil
Keywords:
LCD Screen, OCR, Blur, No-reference, Image Quality.
Abstract:
The Brazilian electoral system uses an electronic voting machine to increase the voting reliability. This voting
machine goes through a series of security procedures, and the one that uses the most human resources is the
integrity test. The proposed solution to optimize these resources is using a robotic arm and computer vision
methods to replace the eight persons needed to carry out the test currently. However, there is a problem
with the LCD screen in the poll worker’s terminal.There is no backlight on the LCD screen, this may cause
visual pollution on images captured by the camera, depending on the ambient lighting and camera position.
In this way, this paper proposes two methods to make it easier to choose the best images to be used in the
extraction of information process: OCR and blur analysis. We analyzed 27 images with three ambient lighting
configurations then compared our results with three no-reference image quality evaluators and research on
human perception of image quality. The OCR analysis matched very closely the human perception and the
other evaluators.
1 INTRODUCTION
The Electoral Justice is the Brazilian governmental
agency responsible for the entire electoral process
for the whole country, including all states and cities
elections. The Supreme Electoral Court (TSE) is the
highest organ on a federal level, and the headquar-
ters are based in the Brazilian capital, Brasilia. As
for the states/provinces, the Regional Electoral Courts
(TREs) are the ones responsible for the elections.
These agencies together are the authority for all steps
in the electoral process, from the electoral register to
the diplomacy of the elected, passing through the vot-
ing stage (Court, 2020).
The Brazilian electoral process started to change
in 1995 when the TSE started the genuinely Brazil-
ian electronic voting machine project. This project
replaced the slow and susceptible fraud process of
manual counting in paper ballot elections that came
with errors and widespread suspicion. Then in 1996,
a
https://orcid.org/0000-0003-0359-6113
b
https://orcid.org/0000-0001-6383-7551
c
https://orcid.org/0000-0001-5993-2062
d
https://orcid.org/0000-0001-7180-512X
in municipal elections, 57 cities had the first contact
with the electronic voting machine, counting the vote
of more than 32 million Brazilians. Furthermore, in
the 2000 elections, Brazil started the first fully com-
puterized election (Court, 2022c).
The electronic voting machine is a microcomputer
explicitly used in elections and is composed of two
terminals: the poll worker’s terminal and the voter
terminal. The first consists of a numeric keyboard, a
Liquid Crystal Display (LCD), and, in some models,
a biometric reader. In this first one, the voters’ identi-
fication and authorization to vote are carried out. The
second has a numeric keyboard and a Light Emissor
Diode (LED) screen, where the vote is privately reg-
istered (Court, 2022b).
Security tests are performed on the electronic vot-
ing machine every election year. Its primary process
is known as the “Electronic Voting Machine Integrity
Test” (“Teste de Integridade das Urnas Eletr
ˆ
onicas” in
Portuguese) and aims to demonstrate the functioning
and security of the electronic voting machine. This
process begins the day before the election; a series of
local polling stations are randomly selected to have
their electronic voting machine tested. The number
selected from each state is proportional to the total
444
Silva Júnior, M., Falcão Filho, J., Neto, Z., Tavares de Souza, J., Ventura, V. and Teixeira, J.
Image Quality Assessment in the Context of the Brazilian Electoral System.
DOI: 10.5220/0011786500003417
In Proceedings of the 18th International Joint Conference on Computer Vision, Imaging and Computer Graphics Theory and Applications (VISIGRAPP 2023) - Volume 4: VISAPP, pages
444-451
ISBN: 978-989-758-634-7; ISSN: 2184-4321
Copyright
c
2023 by SCITEPRESS – Science and Technology Publications, Lda. Under CC license (CC BY-NC-ND 4.0)

number of polling stations used for that voting round.
Regarding the votes that will be cast at the in-
tegrity test, the TREs provide several ballots that cor-
respond between 75% and 82% of that polling station
voters. That is because to realize a proper test is nec-
essary to account for the absentees, therefore it is not
necessary to have 100% of voters. As for the can-
didates chosen, the parties are invited to fill the bal-
lots used in the audit before the election week. Also,
school kids that cannot vote yet are chosen to fill bal-
lots to complete the total number of votes necessary
in the electronic voting machine. Then, on election
day, simultaneously with the actual election, the audit
begins with the verification that there are no votes in-
side the equipment. Then, all votes obtained with the
filled ballots are entered one by one in the electronic
voting machine and into a computer at the same rate
as an auxiliary system for confirmation. At the end
of the voting process, the electronic voting machine
prints a Ballot Report (BU), and the auxiliary system
also issues a report. Finally, all the data are compared,
verifying if the electronic voting machine had its nor-
mal functioning as expected (Fachin, 2021).
Approximately eight people per electronic voting
machine are involved in this process, divided in two
rounds. The first person takes the paper ballot that
was filled out and checks its validity, the second en-
ters a valid title with the votes on the ballot in the
auxiliary system, the third qualifies the voter in the
poll worker’s terminal and the fourth enters each digit
of the vote in the voter’s terminal (Court, 2022a).
To minimize human interference increasing secu-
rity and confidence of the integrity test, we are de-
veloping an alternative that uses a robotic arm aided
by computer vision. In the test, the robot performs the
functions of typing the voter’s title in the poll worker’s
terminal and the votes in the voter’s terminal, remov-
ing human interference in these actions, only one per-
son is needed to change the ballot. The solution using
the robotic arm to automate the integrity test received
an innovation award.
A camera attached to the robotic arm is used to
extract, from each ballot, the title and the votes to
be typed by the robot and subsequently to view the
screen and validate what was typed at the terminals
and ensure that the information extracted from the
ballots is the same as typed on the screen, ensuring
the integrity test.
The technique used to extract the information will
be Optical Character Recognition (OCR). According
to Tekin(Tekin et al., 2011), LCD screens have some
characteristics that make them difficult to read by
OCR, such as low contrast and proximity of the edge
of the numbers to the edge of the screen. In addition,
depending on the camera’s position, there may be re-
flections or shadows on the screen that superimposes
the information.
The main objective of this work is to present
metrics to classify images on the screen of the poll
worker’s terminal regarding their quality for extract-
ing information and thus defining the best position of
camera for extraction of information on the screen
and thus ensure a more reliable automation system
because the electronic voting machines are distributed
throughout Brazil and with that there are several light-
ing scenarios. And doing so we intend to validate the
classification of the same images by people and three
no-reference image quality scores: BRISQUE (Mittal
et al., 2012a), PIQE (Chan and Goldsmith, 2000), and
NIQE (Mittal et al., 2012b).
The remainder of this paper is structured as fol-
lows. Section 2 list some works related to the pro-
posed solution. Section 3 describes the methodology
used to classify the images. Section 4 presents the re-
sults obtained with the analyses and metrics used. Fi-
nally, on section 5 we expose the conclusions of this
paper.
2 RELATED WORKS
In this section, we present works that discuss im-
age quality analyzer with reference and no-reference
methodology and OCR on screen.
2.1 Image Quality Analyzer
Image quality analysis is usually performed on
databases with prior human evaluation. Qin and El-
Yacoubi (Qin and El-Yacoubi, 2017) presents a Deep
Neural Network (DNN) trained to predict the qual-
ity of finger vein images is proposed. Some ap-
proaches applied to two public datasets were com-
pared, where the best results were for Patch-DNN.
Mittal, Soundararajan, and Bovik (Mittal et al.,
2012b) deal with a blind image quality analysis that
uses measurable deviations from statistical regular-
ities for natural images without training on human
opinions. The proposed index scored better than
the Popular Signal-to-Noise Ratio (PSNR) and Struc-
tural Similarity Index (SSIM) and is equivalent to
high-performance image quality analysis approaches.
Courtney (Courtney, 2021) analysis the image qual-
ity of non-referenced documents to select the best im-
age for the OCR application automatically. It used a
metric based on character feedback and checked the
parameters influencing OCR extraction, e.g., noise,
blur, contrast, and brightness, seen as the most signif-
Image Quality Assessment in the Context of the Brazilian Electoral System
445
icant influencers. The OCR solution used was Tesser-
act (Smith, 2007). The metric validation was done
with images created with influence on the parameters
mentioned compared with other indexes: BRISQUE,
NIQE, and PIQE. Furthermore, in comparison, the
suggested index could define the best image for OCR
extraction in all dataset images.
2.2 OCR
Optical character recognition is a computer vision
technique for extracting characters from images and
documents. Kastelan et al.(Kastelan et al., 2012) use
a system for OCR text extraction on the TV screen
to validate the operation of the TV by comparing
the extracted information with the expected text us-
ing Tesseract. Vellian et al. (Mariappan et al., 2011)
proposes a system for extracting characters from LED
and LCD screens in real-time, passing the informa-
tion through sound, is discussed to assist people with
visual impairments. They use adaptive binarization
and an approach to extract “blobs,” which serves to
identify the highest probability of identifying possi-
ble digits. In tests, average error rates of 1.19% and
maximum error rates of 1.52% were obtained. Tekin
et al.(Tekin et al., 2011) also use OCR for character
extraction of an LCD screen, but for multiple medical
instruments. The system works with three simultane-
ous screens, and the technology used is the LabView
Vision Assistant OCR (Kwon and Ready, 2014). The
OCR is trained with images from the LCD screen re-
peatedly until it can extract the characters accurately.
In the end, the system presented a 100% success rate
for the ten tests performed.
3 METHODOLOGY
In this section we describe all the steps used to ob-
tain the scores. We create the dataset of the terminal
screen images with the assistance of a robotic arm.
We analyzed the OCR character extraction and blur
for all images. To validate the result we compared
with three image quality evaluators no-reference and
verified the result with people’s perception with the
application of surveys.
3.1 Dataset
First, to perform the blind analysis, it was necessary
to create a dataset composed of different images that
brought to the experiment a diversity of positions and
contrasts to simulate a layman user operating the sys-
tem. Therefore, initially 9 fixed positions were se-
lected for the camera focusing on the terminal screen,
being three positions with height variation: above the
screen (P1), over its center (P2) and below it (P3), in
which each one had two auxiliary positions: to the
left (P-L) and to the right (P-R). These positions are
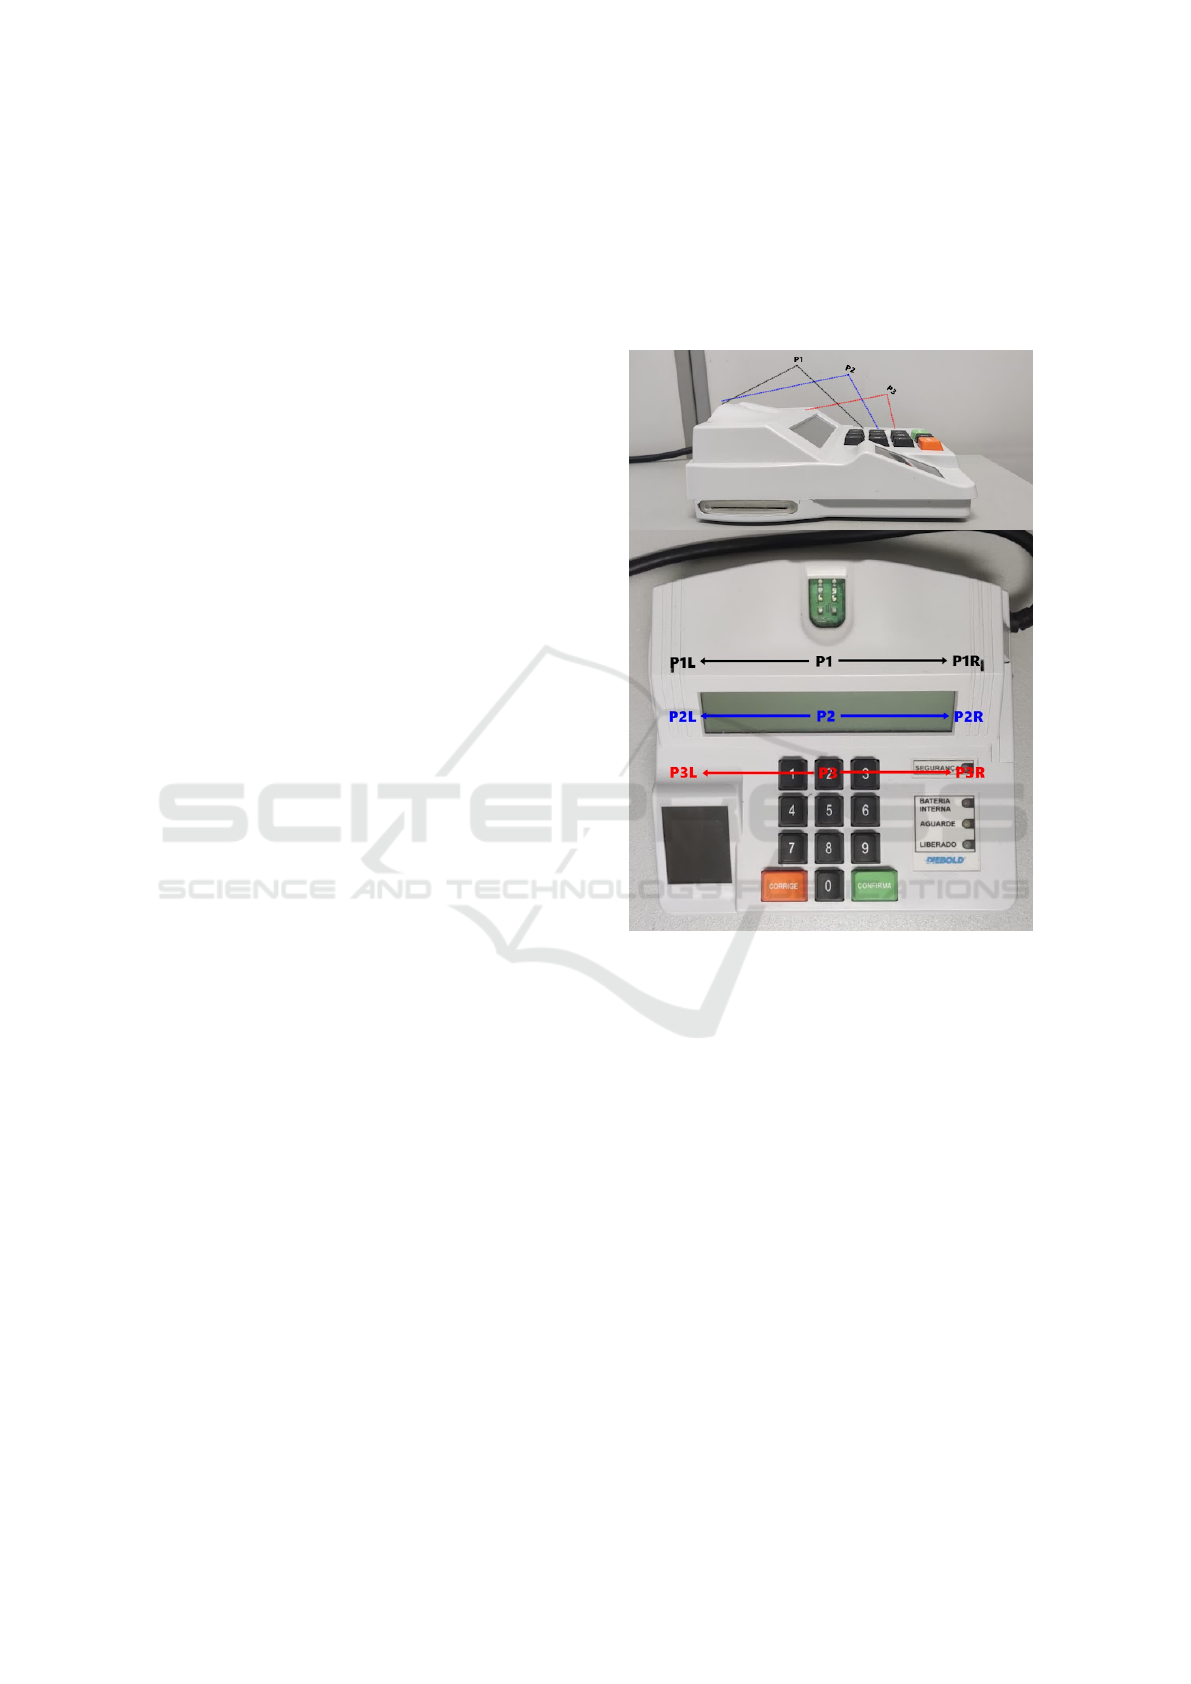
exemplified in Fig.1.
Figure 1: Illustration of positions for the camera for the ter-
minal screen. First the side view demonstrating the height
variation of the central positions, and then all positions in
the top view.
In addition to the position variation, a lighting
variation was also made in a room with little natu-
ral light irradiation. However, the place has 24 LED
tubes with 18 W of power, divided into 12 luminaries.
These are arranged in four rows with three luminaries
each. Three types of lighting were used: no lighting,
partially lit and fully on. The first configuration has
all lights off, the second with half of the lights on,
and the last with all lights on. To ensure that in each
lighting variation we would have the same relative po-
sition, we had the help of a COMAU eDO (COMAU,
2021) robotic arm. A Logitech C922 HD webcam
was attached to the robotic arm being taken to the 9
defined positions, in the three different illuminations
conditions following the same order. Thus, 27 images
were obtained to be analyzed. It is important to note
that the information on the screen does not vary. Sub-
sequently, a correction was made in the images with
VISAPP 2023 - 18th International Conference on Computer Vision Theory and Applications
446
focus only on the poll worker’s terminal screen, iso-
lating the screen. The four points used for perspective
distortion correction were selected manually and used
a function from the OpenCV (Bradski, 2000) library
for perspective change. With the dataset finalized, the
image analysis phase began. The dataset images can
be seen in Fig.2.
In the link there is a video showing the robotic
arm passing through the positions used to obtain the
images of the poll worker’s terminal screen.
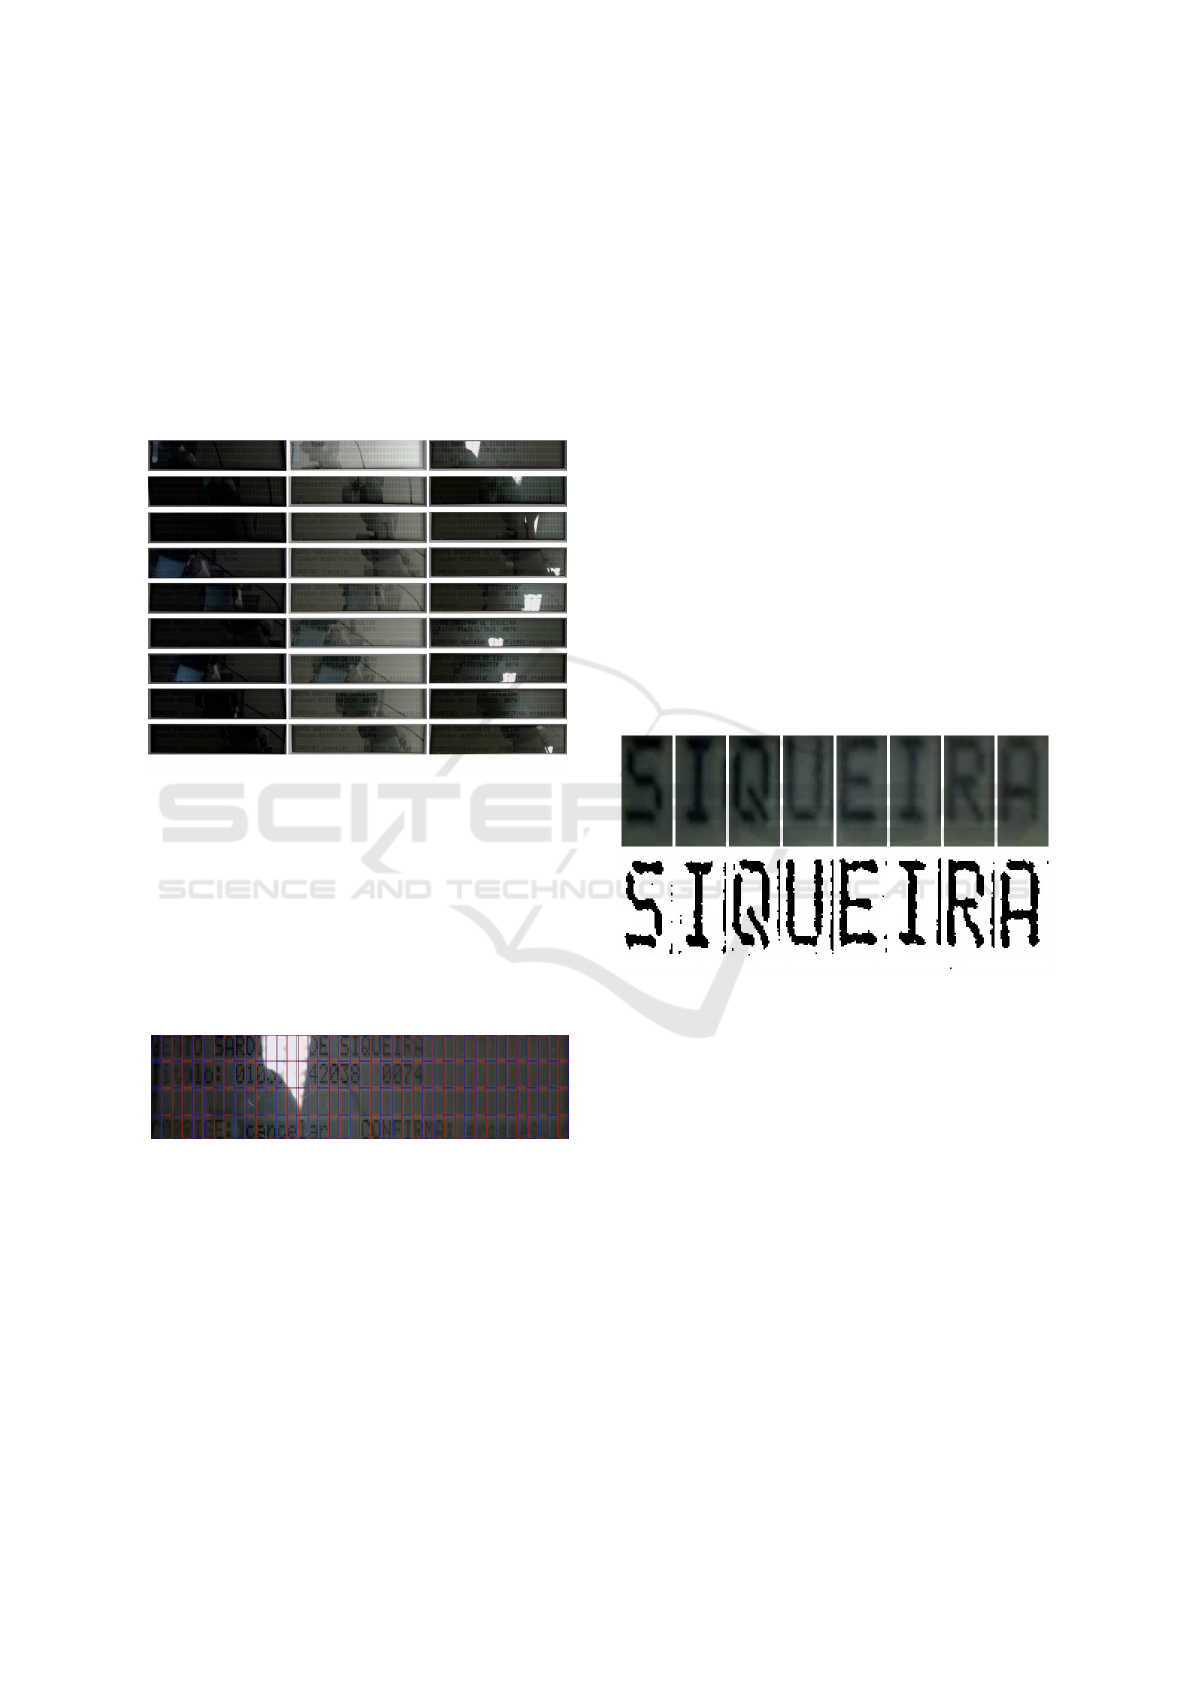
Figure 2: Dataset of images of the terminal screen.
3.2 OCR Analysis
The terminal screen has 4 lines with 40 cells per line.
For the criterion of OCR extraction each image was
cut into 160 rectangular cells, to separate the screen
image into every possible character space. Python
code was used to automate this process. Fig.3 shows
the demarcation of each cell obtained for an image of
the data.
Figure 3: Image of terminal screen with the cutout mark-
ings.
The clipping is done by ranging each line sepa-
rately. The default width for the number of cells per
line should be equal to 30 pixels due to the image
width being equal to 1200 pixels, but to try to min-
imize the errors caused by the distortion caused by
the perspective change, 2 pixels on each side were
added, totaling 34 pixels, which can be seen in the
lateral overlay of the rectangles with different colors,
in Fig. 3. There are two exceptions caused by the
side edges of the image, which makes the first cell of
each row 30 pixels wide and the last 32 pixels wide.
The default height for the number of cells per column
should be equal to 74 pixels, since the height of the
image is 296 pixels, however, for the same reason of
the width variation, it increased 3 pixels on each side,
totaling 80 pixels, this value was used for lines 2 and
3. For the first line the height used was 74 pixels and
for the last line 71 pixels.
The images are then pre-processed before apply-
ing the OCR. In this step, only color space transfor-
mation was used, from RGB to grayscale, and then an
adaptive thresholding from the OpenCV library was
applied, with blockSize equal to 11 and the value of
the constant that is subtracted from the average equal
to 3. This binarization technique segments the image
based on a threshold that dynamically changes over
pixel regions of the image. This sequence was used to
try to make the character clearer for the OCR and as
this is a blind analysis, the objective is not to analyze
if the OCR correctly returned the characters, but to
verify if it can identify that there are any characters.
Fig.4 shows some characters from the original image
and after pre-processing.
Figure 4: Example with 8 cells before and after pre-
processing.
With the binarized images, EasyOCR (Awal-
gaonkar et al., 2021) was used to recognize the char-
acters. This OCR was used because it needs less pre-
processing, extracting the text from the images more
directly.
After having the result of the set of cells per im-
age, an initial pattern is created as an initial reference
of the image information, being verified which char-
acter is most repeated, thus finding the mode between
a given cells in the 27 images. When there is one more
of eligible character as mode per cell, that cell in the
initial reference becomes empty. Next, a comparison
is made between the initial reference and the character
is extracted per image and thus a value is assigned to
each image, termed the initial score. This value is the
number of characters that belong to the image and the
initial reference, divided by the number of characters
contained in the initial reference, disregarding spaces.
Image Quality Assessment in the Context of the Brazilian Electoral System
447

Fig.5 exemplifies how the initial result was obtained.
Based on the final score the final reference is built.
The empty spaces that were left in the initial reference
for having more than one mode per position are filled
with the characters in which the image has the highest
initial score. Afterwards, another comparison is made
between the images and the final reference, following
the same methodology of the initial score, to define
the final score per image. In Fig.6 the logic that was
used is exemplified.
3.3 Blur
The blur level defines how difficult the objects in the
scene could be seen, eventually related to bad camera
focus. It is an important metric for evaluation because
it causes some problems for edge detection techniques
due to the absence of edges in blurred images. With
this in mind, our focus on this metric aims to define
the blur level of an image, quantifying how blurred is
an image.
Pech-Pacheco et al. (Pech-Pacheco et al., 2000)
and Bansal et al. (Bansal et al., 2016) show a proposal
for the use of the Laplacian Operator to obtain a met-
ric to evaluate blur in an image. As this operator is
often used for edge detection (Shrivakshan and Chan-
drasekar, 2012), the variance of the responses from
detected edges can provide a metric to classify an im-
age as blurred or not.
This variance defines the edge responses of the
image which the operator has applied. So, as high
it is means that there are a lot of edge responses in-
dicating that many edges are detected, and as low it
is represents detection of very little edges on the im-
age. The problem with the variance is that it is very
domain-dependent, so after analyzing how this vari-
ance performs on our dataset we decided to clamp the
values to the range [3, 30] where as low the value most
blurred is the image.
3.4 Metrics Comparison
In order to validate our approach we applied our
dataset to 4 metrics: survey, BRISQUE, PIQE, and
NIQE.
For the survey metric have been applied three sur-
veys where each have nine images of a single light
variation has been explained in Dataset subsection.
The first with images 1-9, regarding a poorly lit room,
got 10 answers. The second covered the pictures 10-
18, regarding a partially lit room, had 11 answers.
And the third survey was answered by 20 people with
the images 19-27 taken in the fully lit room.
This metric function is to determine what a regu-
lar person perceived as a good image in a quantified
way. For that reason all three surveys had the same
ten standardized questions where which answer could
provide the image with point. These points will be
add up and then divided by the number of people on
that survey, therefor making the image official score.
Initially everyone was asked to rank their top 3 im-
ages in that specific poll, the first position earn the im-
age 3 points, the second two and the third one point.
Then, so all images could be analyzed and we could
get a better take on what a person looks for a good
image we asked them to describe the images in one of
this six sentences:
• I am not able to read any character (no points);
• I am able to read some characters (2 points);
• I am able to read most of the characters and un-
derstand some words (3 points);
• I am able to read most of the characters and un-
derstand all of the words even though they are in-
complete (4 points);
• I am able to read all the characters and all words
(5 points);
Therefor all images could get up to eight points if
it got chosen as best picture and people were able to
read every character in the screen.
BRISQUE, PIQE, and NIQE were used because
they are no-reference image quality score. The first is
Blind/Referenceless Image Spatial Quality Evaluator.
Second is Perception based Image Quality Evaluator.
And the last is Naturalness Image Quality Evaluator.
To obtain the value of these metrics the algorithms of
(Aggarwal, 2020) were used. Your scores are in the
range 0 to 100. For all, evaluators a smaller score
indicates better quality.
4 RESULTS
Here we present the results for the presented metrics.
First, we ran each metric separately on the dataset,
obtaining the scores for each image. After, we discuss
about the presented results, explaining how well each
one has behaved and discussing about them, finishing
showing our performance by making the comparison
between it and the results from the survey and some
techniques in the literature.
4.1 OCR
The final score of each image was put into Table 1,
it can be seen that the image that scored the best is
VISAPP 2023 - 18th International Conference on Computer Vision Theory and Applications
448
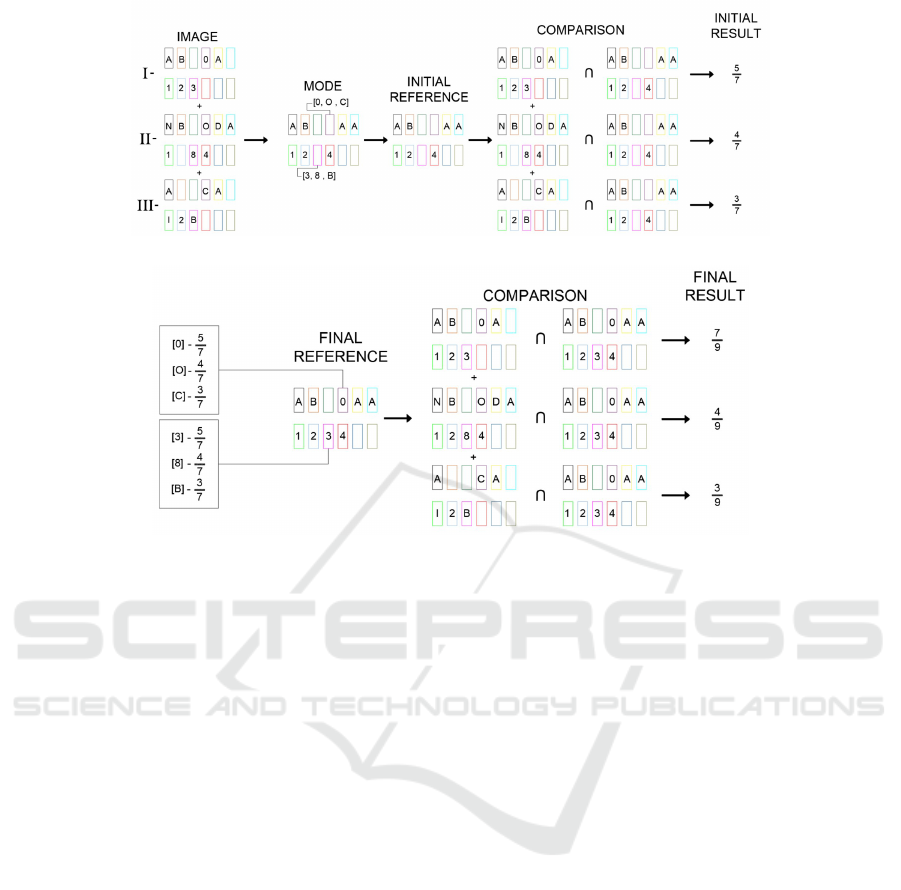
Figure 5: Illustration the creation of the initial result.
Figure 6: Illustration the creation of the final result.
image 24, which belongs to the subgroup of full illu-
mination and P2L position. Analyzing by subgroup,
no illumination had the worst result, with 7 images
scoring 0 and an average of 0.34 points. The best sub-
group was the one with total illumination, which has
the image with the best score and an average of 12.50
points, while partial illumination has an average of
5.90 points.
By position, P2L obtained the highest average,
with 15.10 points, and P1R had the worst average,
with 0.52 points. Among them and in descending or-
der of average, there are: P3L with 9.90 points, P3
with 8.85 points, P1L with 5.72 points, P2 with 4.69
points, P1 and P3R both with 4.17 points and P2R
with 3.13 points.
4.2 Blur
As discussed in the previous section, the Blur met-
ric provides us a variance value that depends on the
domain, where after some tests we have decided to
clamp the values in the range [3, 30]. Looking for-
ward, as our goal is to apply these values in the pro-
posed formula we have made a simple linear conver-
sion obtaining values in the range [0, 1]. Tab. 1 con-
tains the results for the blur metric for each image.
Note that the higher is the value, the sharper is the
image, so it has better quality.
As we can see, the generated results are quite rea-
sonable: for the images 1 to 9 that represents the im-
age with no luminosity we have really low values,
mainly due to the absence of edges because no fea-
tures can be really detected on the image. For the
images 10 to 18 as we have more edges recognized in
the image due to the luminosity the results increased
a lot, and for the images 19 to 27 as we have the total
luminosity the characters are most sharpness.
4.3 Comparative with Metrics and
Survey
The results obtained with the surveys are contained in
Tab. 1. Based on human perception, the image with
the best quality is 26 and the worst are 1, 2 and 3.
Table 1 contains the result for all images for OCR
analysis, blur analysis, the metrics no-reference, the
survey and voter’s title extraction, all in percent. For
OCR, blur and survey highest score indicates bet-
ter perceptual quality but for BRISQUE, PIQE and
NIQE, a smaller score is better. The best scores per
column and the number of the respective images are
in bold.
With Table 1 it can be seen that our OCR analysis
and the BRISQUE metric elected image 24 as the best
image. For our blur analysis two images are elected
the best, 19 and 23. For PIQE the best image is 2 and
for NIQE the best image is 8. According the survey
the best image is 26. For the worst images there was
Image Quality Assessment in the Context of the Brazilian Electoral System
449

Table 1: Results of OCR, BLUR, BRISQUE, PIQE, NIQE and survey.
Nº OCR BLUR BRISQUE PIQE NIQE SURVEY
1 1.56 6.92 55.66 71.53 16.09 0.00
2 0.00 1.77 64.5 14.29 12.98 0.00
3 0.00 1.82 60.68 41.4 14.36 0.00
4 0.00 1.9 64.27 80.69 14.78 17.50
5 0.00 2.66 62.06 20 16.85 37.50
6 0.00 5.18 56.85 69.03 14.5 41.25
7 0.00 5.94 57.15 68.06 14.27 36.25
8 0.00 4.28 58.79 43.78 11.91 13.75
9 1.56 2.26 61.96 32.91 12.57 10.00
10 3.12 48.61 55.79 60.15 17.89 45.50
11 1.56 16.49 63.83 69.14 15.58 19.25
12 0.00 20.59 60.6 69.52 15.33 14.75
13 4.69 33.94 59.67 49.13 13.16 71.63
14 4.69 54.78 60.17 56.02 12.69 47.75
15 12.50 40.46 58.31 52.82 13.28 71.63
16 10.94 22.53 59.46 49.08 13.19 54.50
17 14.06 9.8 59.98 44.9 13.47 77.25
18 1.56 15.34 59.59 52.93 14.12 60.25
19 12.50 100 52.59 42.33 14.36 10.63
20 10.94 29.05 61.01 54.5 14.39 2.50
21 1.56 62.81 64.97 53.08 14.07 14.38
22 4.69 59.52 58.23 48.98 15.18 65.00
23 9.38 100 55.1 45.84 13.69 43.13
24 32.81 86.43 46.26 41.71 13.59 49.38
25 18.75 46.81 60.74 56.56 14.16 52.50
26 12.50 40.3 63.92 69.13 13.29 79.38
27 9.38 47.68 62.84 62.86 14.03 70.63
Table 2: Values of Spearman correlation coefficient.
SURVEY BRISQUE PIQE NIQE
OCR 0.574 -0.246 -0.094 -0.266
BLUR 0.422 -0.365 0.063 -0.018
no similar result, our OCR analysis elected image 6,
our blur analysis elected image 2, for BRISQUE is
21, for PIQE is 4, for NIQE is 10 and for survey three
images obtain zero score: 1, 2 and 3.
The best image for OCR analysis was ranked only
9th in human perception. The best images for blur
analysis were ranked 22 and 12. Images 2 and 3 were
considered the worst in the survey and in the OCR
analysis, and image 2 was also considered the worst
for blur analysis.
To verify the correlation between the metrics,
Spearman’s correlation was used. The values of the
coefficients are contained in Table 2. It can be seen
that the OCR rating has a moderate correlation with
the survey while the Blur rating has a weak correla-
tion. PIQE has an almost zero correlation with both
approaches while BRISQUE and NIQE have a nega-
tive and weak correlation.
5 CONCLUSION
The work presented in this paper describes two meth-
ods used to analyze the quality of the clerk´s terminal
screen image by comparing the results with three no-
reference image quality score and a survey.
It was seen that for the best quality analysis for
LCD screen extraction the OCR analysis obtained the
best result compared to human perception and other
metrics in the literature, which is validated by having
the best correlation with human evaluation. Its use
is recommended to choose the best image to extract
information from the screen of the poll worker’s ter-
minal.
Proposition for future work would be the use of
the proposed evaluator as an OCR analysis to define
the best position for the robot used in the automation
of the electronic voting machine integrity test with
more evaluation positions and screen extraction au-
tomation.
VISAPP 2023 - 18th International Conference on Computer Vision Theory and Applications
450

ACKNOWLEDGEMENTS
This work has been supported by the research coop-
eration project between Softex (with funding from
the Ministry of Science, Technology and Innova-
tion—Law 8.248) and CIn-UFPE.
REFERENCES
Aggarwal, A. (2020). Buyizhiyou/nrvqa: No ref-
erence image/video quaity assessment (brisque/
niqe/piqe/diqa/deepbiq/vsfa. url= https://github.com/
buyizhiyou/NRVQA. Accessed: 2022-09-15.
Awalgaonkar, N., Bartakke, P., and Chaugule, R. (2021).
Automatic license plate recognition system using ssd.
In 2021 International Symposium of Asian Control As-
sociation on Intelligent Robotics and Industrial Au-
tomation (IRIA), pages 394–399. IEEE.
Bansal, R., Raj, G., and Choudhury, T. (2016). Blur im-
age detection using laplacian operator and open-cv.
In 2016 International Conference System Modeling &
Advancement in Research Trends (SMART), pages 63–
67. IEEE.
Bradski, G. (2000). The opencv library. In Dr. Dobb’s Jour-
nal: Software Tools for the Professional Programmer,
volume 25, pages 120–123. Miller Freeman Inc.
Chan, R. W. and Goldsmith, P. B. (2000). A psychovisually-
based image quality evaluator for jpeg images. In
Smc 2000 conference proceedings. 2000 ieee inter-
national conference on systems, man and cybernet-
ics.’cybernetics evolving to systems, humans, orga-
nizations, and their complex interactions’(cat. no. 0,
volume 2, pages 1541–1546. IEEE.
COMAU (2021). e.do robot. url: https://edo.cloud/
en/learning-center/. Accessed: 2022-07-20.
Court, R. E. C. (2022a). Como ocorre o teste de integri-
dade das urnas eletr
ˆ
onicas. url= https://www.tre-
ce.jus.br/eleicao/eleicoes-2022/auditoria-de-funciona
mento-das-urnas-eletronicas/como-ocorre-a-auditoria
-de-funcionamento-das-urnas-eletronicas. Accessed:
2022-11-16.
Court, S. E. (2020). Processo eleitoral no brasil.
url= http://www.tse.jus.br/eleicoes/processo-eleitoral-
brasileiro. Accessed: 2022-10-10.
Court, S. E. (2022b). Ballot box. url= https://interna
tional.tse.jus.br/en/electronic-ballot-box/presentation.
Accessed: 2022-07-22.
Court, S. E. (2022c). Urna eletr
ˆ
onica 25 anos: Lanc¸ado
em 1996, equipamento
´
E o protagonista da maior
eleic¸
˜
ao informatizada do mundo. url= https://www.
tse.jus.br/comunicacao/noticias/2021/Maio/urna-ele
tronica-25-anos-lancado-em-1996-equipamento-e-
o-protagonista-da-maior-eleicao-informatizada-do-
mundo. Accessed: 2022-08-12.
Courtney, J. (2021). Sediqa: Sound emitting document im-
age quality assessment in a reading aid for the visually
impaired. In Journal of Imaging, volume 7, page 168.
MDPI.
Fachin, E. (2021). Resoluc¸
˜
ao nº 23.673, de 14 de
dezembro de 2021. url= https://www.tse.jus.br/
legislacao/compilada/res/2021/resolucao-no-23-673-
14-de-dezembro-de-2021. Accessed: 2022-07-22.
Kastelan, I., Kukolj, S., Pekovic, V., Marinkovic, V., and
Marceta, Z. (2012). Extraction of text on tv screen us-
ing optical character recognition. In 2012 IEEE 10th
Jubilee International Symposium on Intelligent Sys-
tems and Informatics, pages 153–156. IEEE.
Kwon, K.-S. and Ready, S. (2014). Practical guide to ma-
chine vision software: an introduction with labview.
John Wiley & Sons.
Mariappan, M., Ramu, V., Ganesan, T., Khoo, B., and Vel-
lian, K. (2011). Virtual medical instrument for otorob
based on labview for acquiring multiple medical in-
strument lcd reading using optical character recogni-
tion. In 2011 International Conference on Biomed-
ical Engineering and Technology, IPCBEE vol, vol-
ume 11.
Mittal, A., Moorthy, A. K., and Bovik, A. C. (2012a). No-
reference image quality assessment in the spatial do-
main. In IEEE Transactions on Image Processing,
volume 21, pages 4695–4708. IEEE.
Mittal, A., Soundararajan, R., and Bovik, A. C. (2012b).
Making a “completely blind” image quality analyzer.
In IEEE Signal Processing Letters, volume 20, pages
209–212. IEEE.
Pech-Pacheco, J. L., Crist
´
obal, G., Chamorro-Martinez, J.,
and Fern
´
andez-Valdivia, J. (2000). Diatom autofocus-
ing in brightfield microscopy: a comparative study. In
Proceedings 15th International Conference on Pattern
Recognition. ICPR-2000, volume 3, pages 314–317.
IEEE.
Qin, H. and El-Yacoubi, M. A. (2017). Deep representation
for finger-vein image-quality assessment. In IEEE
Transactions on Circuits and Systems for Video Tech-
nology, volume 28, pages 1677–1693. IEEE.
Shrivakshan, G. and Chandrasekar, C. (2012). A compari-
son of various edge detection techniques used in im-
age processing. In International Journal of Computer
Science Issues (IJCSI), volume 9. Citeseer.
Smith, R. (2007). An overview of the tesseract ocr engine.
In Ninth international conference on document anal-
ysis and recognition (ICDAR 2007), volume 2, pages
629–633. IEEE.
Tekin, E., Coughlan, J. M., and Shen, H. (2011). Real-time
detection and reading of led/lcd displays for visually
impaired persons. In 2011 IEEE Workshop on Appli-
cations of Computer Vision (WACV), pages 491–496.
IEEE.
Image Quality Assessment in the Context of the Brazilian Electoral System
451
