
Low-Cost 3D Reconstruction of Caves
Jo
˜
ao Marcelo Teixeira
a
, Narjara Pimentel, Eder Barbier, Enrico Bernard, Veronica Teichrieb
and Gimena Chaves
Universidade Federal de Pernambuco, Recife, PE, Brazil
Keywords:
RGB-D Sensors, 3D Reconstruction, Cave Surveying.
Abstract:
Caves are spatially complex environments, frequently formed by different shapes and structures. Capturing
cave’s spatial complexity is often necessary for different purposes – from geological to biological aspects –
but difficult due to the challenging logistics, frequent absence of light, and because the necessary equipment
is prohibitively expensive. Efficient and low-cost mapping systems could produce direct and indirect benefits
for cave users and policy-makers, enabling from non-invasive research of fragile structures (like speleothems)
to new forms of interactive experiences in tourism, for example. Here we present a low-cost solution that
combines hardware and software to allow capturing cave spatial information through RGB-D sensors and the
later interpretation of the processed data. Our solution allows the navigation in a 3D reconstructed cave, and
may be used to estimate volume and area information, frequently necessary for conservation or environmental
licensing. We validated the proposed solution by partially reconstructing one cave in Northeastern Brazil.
Although some challenges have to be overcome, our approach showed that it was possible to retrieve relevant
information despite using low-cost RGB-D sensors.
1 INTRODUCTION
Caves are spatially complex tridimensional environ-
ments, mainly composed by irregular shapes. Such
complexity can manifest from a macro (i.e., conduits,
ceiling, walls, floor) to a smaller scale (i.e., stalactites,
stalagmites and other speleothems of reduced dimen-
sion). Documenting the spatial complexity of caves
is a challenging task, because besides their inherent
characteristics, the frequent lack of light in the cave’s
interior make such task even more difficult. Although
caves have been subject of study for decades, tra-
ditional topography techniques are not always capa-
ble of accurately representing the tridimensional com-
plexity of such environments (Gallay et al., 2015).
Recently, 3D reconstruction techniques have been
applied as an alternative for cave mapping and doc-
umentation. Such approaches are usually based on
laser scanning systems (i.e., Terrestrial Laser Scan-
ning - TLS, Light Detection and Ranging - LiDAR or
Mobile Laser Scanning - MLS) (Ullman et al., 2023)
(Li et al., 2023), where laser beams with thousands of
pulses per second are used to generate point clouds,
which will be recorded together in sequence. Such
approach allows to construct highly detailed 3D rep-
a
https://orcid.org/0000-0001-7180-512X
resentations of the environment captured, in high res-
olution (dense), enabling a refined view of the cave
(Grohmann, 2019).
The use possibilities of 3D reconstructed repre-
sentations of caves are vast and go beyond scientific
goals, including from cave documentation to a more
precise estimate of cave volume and area, all use-
ful information for the environmental licensing, eco-
tourism and environmental education. However, de-
spite being very promising, the use of laser scanning
techniques in Brazil is still imature and hindered by
some factors:
• Cost: Laser scanning equipment is very expen-
sive, with prices varying from thousands to hun-
dreds of thousands of Reais (R$);
• Difficult Access: the necessary equipment has
to be imported requiring time-consuming and bu-
reaucratic processes. Moreover, some laser scan-
ning solutions are rated restrict due to military or
security use;
• Handling: Data volume generated by such sys-
tems is usually very large and requires high per-
formance computers.
Such factors make the diffusion of laser-based
3D mapping techniques very restrict in Brazil, lim-
Teixeira, J., Pimentel, N., Barbier, E., Bernard, E., Teichrieb, V. and Chaves, G.
Low-Cost 3D Reconstruction of Caves.
DOI: 10.5220/0011786200003417
In Proceedings of the 18th International Joint Conference on Computer Vision, Imaging and Computer Graphics Theory and Applications (VISIGRAPP 2023) - Volume 5: VISAPP, pages
1007-1014
ISBN: 978-989-758-634-7; ISSN: 2184-4321
Copyright
c
2023 by SCITEPRESS – Science and Technology Publications, Lda. Under CC license (CC BY-NC-ND 4.0)
1007

iting their access and restricting their use to a few
big companies, some specialized consulting agencies
and an even smaller number of research laborato-
ries (Grohmann, 2019). Such restrictive scenario in
Brazil is very concerning, considering the huge spele-
ological potential of the country, estimated at about
310,000 caves (?). This situation is aggravated by the
lack of information about Brazilian caves and, at the
same time, by the high human pressure they experi-
ence.
A low-cost 3D alternative for cave reconstruction
could increase the possibilities of documentation of
Brazilian caves, contributing to reduce the current in-
formation gap. Moreover, documenting caves and
their characteristics is supported by the current poli-
cies, like the National Program for the Conservation
of the Brazilian Speleological Heritage (item MMA
358/2009). Such initiative provides support for data
production which may help the Brazilian government
to achieve their conservation and research goals. Be-
sides that, protected areas harboring caves could ben-
efit from cave surveying initiatives, enabling, for ex-
ample, non-invasive studies of fragile speleothems,
as well as by new forms of virtual interactions be-
tween tourists and the caves in those areas. Here we
present a low-cost solution that combines hardware
and software to allow capturing cave spatial informa-
tion through RGB-D sensors and the later interpreta-
tion of the processed data for the extraction of addi-
tional data such as cave volume and area.
This paper is therefore structured in the follow-
ing sections. Section 2 briefly describes some related
studies with different solutions for 3D reconstruction
of caves, highlighting the technologies used and the
direct application of the results obtained. Section 3
explains the methodology we used, with the steps for
the proposed process. In Section 4 we discuss the lim-
itations found in the proposed methodology together
with some insights on how to improve the results ob-
tained with the proposed solution. At last, in Section 5
we provide future directions that could make the pro-
posed solution more complete.
2 RELATED WORKS
The work from Oguchi et al. (Oguchi et al., 2011)
divides the main data sources used in earth surface
processes into analogic and digital ones. Analog
data sources comprise text descriptions, hand-drawn
illustrations, analog photographs and videos for vi-
sual interpretation, data from classical ground sur-
veying, topographic data from plane-table and analog
photogrammetry and topographic maps and thematic
maps. Regarding digital data sources, they include
digital ground/aerial photographs and videos for vi-
sual interpretation, digital satellite imagery, digital
aerial imagery, topographic data from modern ground
surveying (GPS, total station, laser range finder, ter-
restrial laser scanning), analytical and digital pho-
togrammetry, height data from airbone LiDAR and
Airbone/Satellite InSAR, com-piled height informa-
tion and digital topographic maps and thematic maps.
It is important to note that none of the aforemen-
tioned data sources include the use of depth (RGB-
D) sensors. One could argue that Oguchi’s work
was published in 2011, while the first low cost main-
stream depth sensor (Kinet V1) was released in 2010.
A different work, from Idrees and Pradhan (Mo-
hammed Oludare and Pradhan, 2016), which presents
the panorama of cave surveying solutions for 10 years
(2006-2016), also does not mention any low-cost ap-
proaches. From the almost fifty works published
in various international journals related to mapping
caves in their true 3D geometry with focus on sen-
sor design, methodology, data processing and appli-
cation development, all of them were based on laser
scanning technologies (time-of-flight and phase shift
ones).
According to Escalera (Escalera, 2012), it is pos-
sible to acquire depth information (to be further used
for 3D reconstructions) using different technologies.
Figure 1 illustrates different depth acquisition tech-
nologies, highlighting the light wave-based ones that
do not make use of laser measurements (in other
words, the ones that are low cost alternatives). The so-
lution proposed in this work makes use of an RGB-D
sensor based on the emission of structured light (cam-
era + light pattern projection) to infer depth informa-
tion, the ASUS Xtion PRO
1
. By performing a search
in Google Scholar using the “3D reconstruction of
caves” string, we noticed that most works found make
use of laser scanning to acquire cave data (Gallay
et al., 2016) (Pukansk
´
a et al., 2018) (Gallay et al.,
2015) (Beraldin et al., 2006) . Despite this tendency,
the work from Sellers and Chamberlain (Sellers and
Chamberlain, 1998) uses ultrasound reflections while
the work from Lee (Lee, 2018) presents the use of
RGB cameras (photogrammetry) as a low-cost alter-
native to the reconstruction of caves, but the work is
mostly focused on underwater caves.
Additionally, some works utilize more than one
type of sensor at the same time to improve data ac-
quisition (Azp
´
urua et al., 2023). This happens in the
work of MacFarlane et al. (McFarlane et al., 2013),
in which they combine data acquired from aerial
photogrammetry using an autonomous drone, three-
1
https://www.asus.com/3D-Sensor/Xtion PRO
VISAPP 2023 - 18th International Conference on Computer Vision Theory and Applications
1008
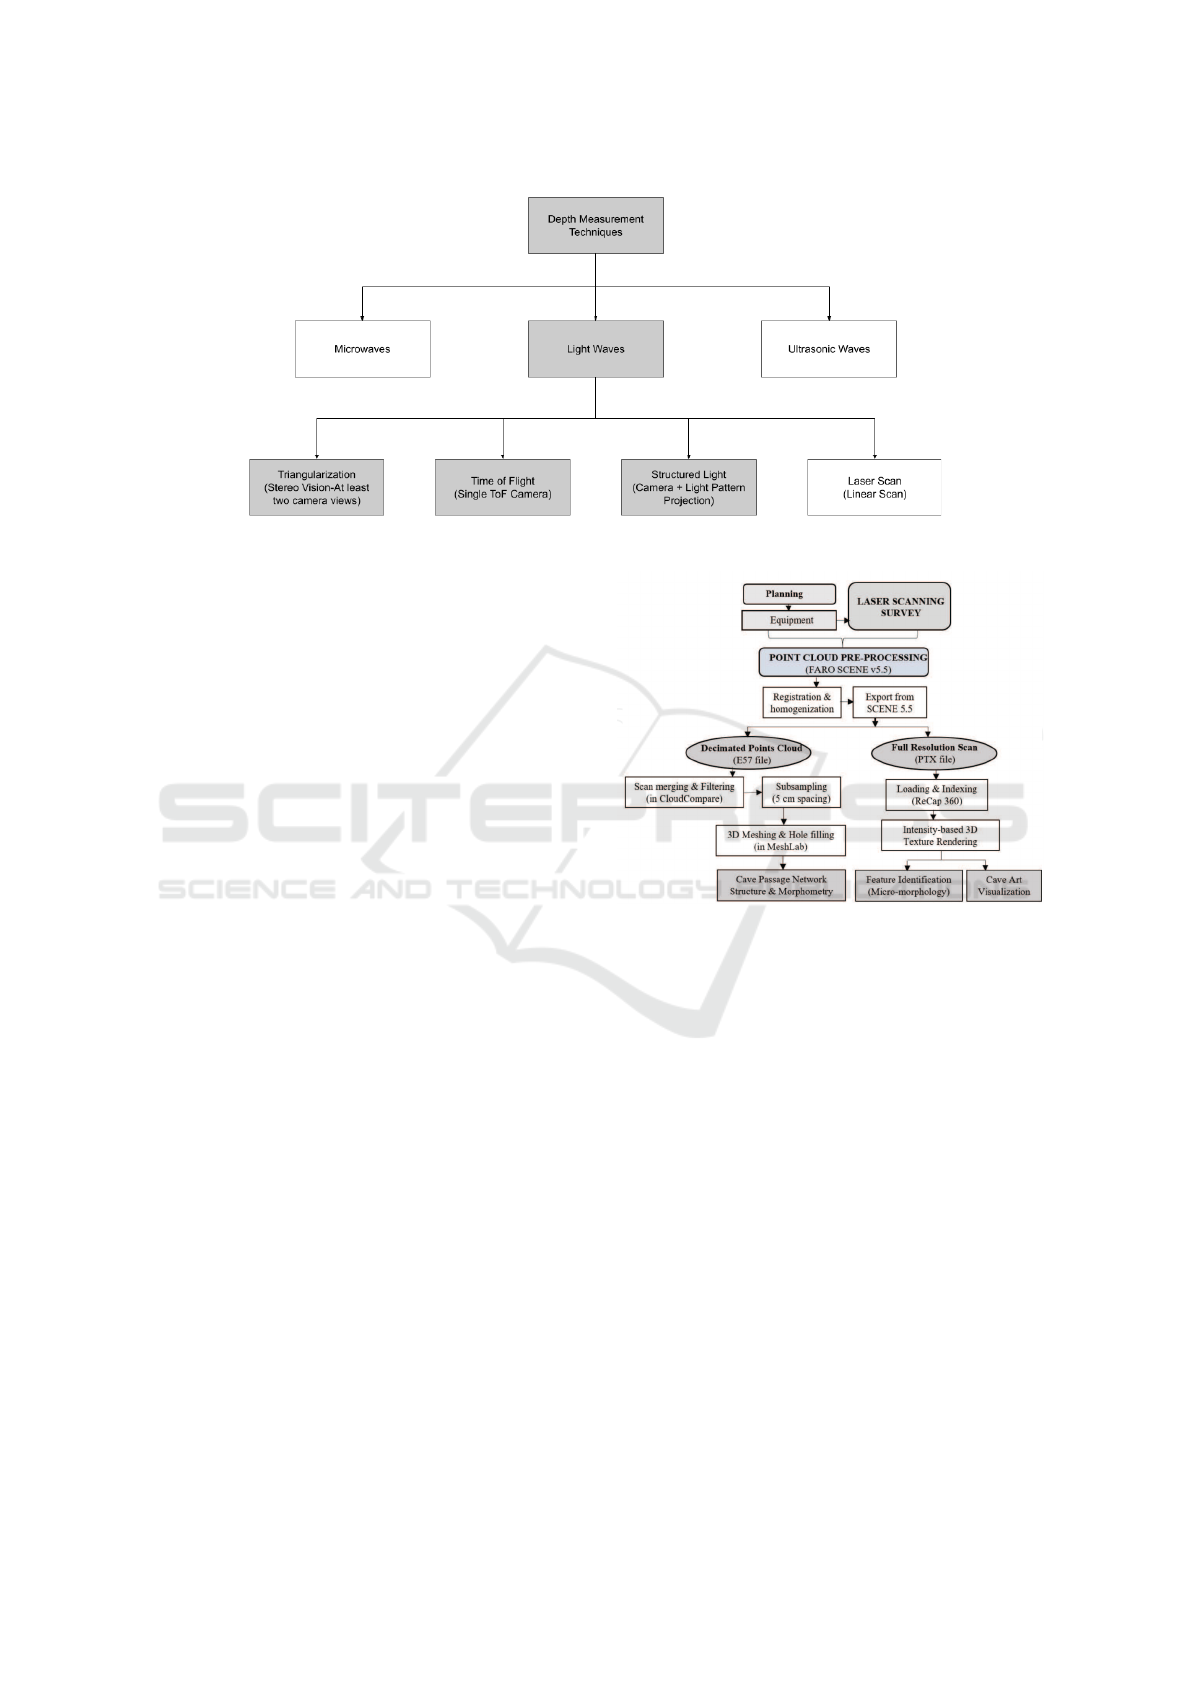
Figure 1: Different technologies for the acquisition of depth maps. Modified from (Escalera, 2012).
dimensional cave laser scanning at millimeter resolu-
tion, differentially corrected geodetic GPS, and con-
ventional compass-based cave surveying techniques.
The applications resulting from cave reconstruc-
tions go from preservation of the caves themselves
(Aiello et al., 2019), to make them accessible to dis-
abled people that cannot visit them “in loco” (Tomet-
zov
´
a et al., 2020) and art (Idrees and Pradhan, 2017a).
Besides that, it is possible to obtain valuable informa-
tion such as the cave volume and channel surface area.
3 METHODOLOGY
Independently of the data acquisition technology
used, the methodologies used for capturing data in-
side the cave and visualizing the final post processed
reconstruction are very similar. Figures 2, 3, 4 and 5
illustrate some of them.
The methodology we adopted can be simplified in
three macro stages: data capture, 3D reconstruction of
the cave, and visualization/extraction of information
based on the generated point cloud.
3.1 Data Capture
The state-of-the-art in capturing tridimensional data
(specially for caves) is focused on laser scanning
technologies (Grohmann, 2019). The problem with
such technologies is that their cost is directly propor-
tional to the quality of the obtained results. A high-
resolution laser scanner/LiDAR may reach dozens of
thousands of dollars, which restricts their acquisition
and use. Low cost alternatives do exist, and it is pos-
sible to obtain equivalent results with the use of pho-
togrammetry (RGB-only) or low resolution RGB-D
sensors, by combining many captured images. We
Figure 2: Data processing and analysis workflow from the
work of Idrees and Pradhan (Idrees and Pradhan, 2017a).
analyzed several low cost RGB-D sensors focusing
different aspects such as size, weight, available APIs,
power consumption, resolution and field of view. The
ten different sensors analyzed were: Orbecc Astra,
Orbecc Astra Pro, Microsoft Kinect V1, Microsoft
Kinect V2, Asus Xtion PRO, Realsense D435, Re-
alsense F200, Realsense SR300, Realsense R200, Re-
alsense ZR300. While both Kinect models allowed
very good reconstruction results, they need an exter-
nal power source, which makes their use difficult in
the field, inside caves. The Asus Xtion PRO showed
similar quality to Kinect V1, with the advantage of no
necessity to an external power source, and that was
the reason behind it was selected for our work.
The sensor was attached to a MacBook Air (11
inches version) with 4GB RAM, 128GB SSD drive
and a Core i5 1.4GHz processor. Despite being a
computer with more than five years, its battery still
keeps it running for about 2 hours, enough for data
capture. External drives were also used to free Mac-
Low-Cost 3D Reconstruction of Caves
1009
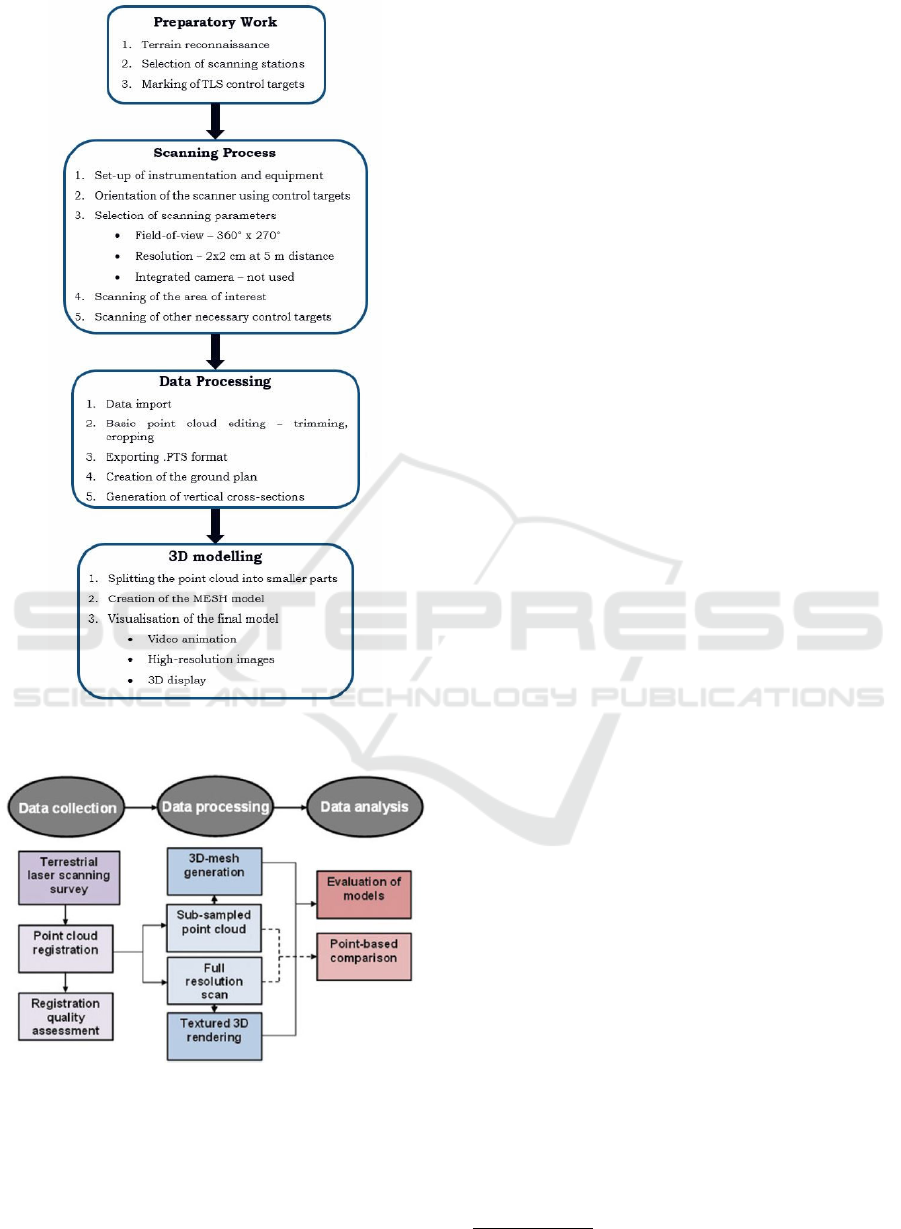
Figure 3: General workflow diagram from the work of
Tometzova et al. (Tometzov
´
a et al., 2020).
Figure 4: Methodological workflow diagram from the work
of Idrees and Pradhan (Idrees and Pradhan, 2017b).
Book’s storage space. In the future, we intend to use a
more portable and dedicated solution such as a Rasp-
berry Pi 4.
For performing both capture and processing of
the data, the Real-Time Appearance-Based Mapping
(RTAB-Map
2
) was used. It is an RGB-D, Stereo and
LIDAR Graph-Based SLAM software based on an
incremental appearance-based loop closure detector.
RTAB-Map being a loop-closure approach with mem-
ory management as its core, is independent of the
odometry approach used, meaning that it can be fed
with visual odometry, LIDAR odometry, or even just
wheel odometry. This means that RTAB-Map can be
used to implement either a visual SLAM approach, a
LIDAR SLAM approach, or a mix of both, making
it possible to reconstruct a 3D point cloud based on
RGB-D data.
Using the aforementioned hardware/software
combination, three biologists went to field-test the so-
lution in a real cave (Carrapateira), located at the mu-
nicipality of Felipe Guerra, in Rio Grande do Norte
state, northeastern Brazil. They started scanning the
cave’s entrance with RTAB-Map’s main application
running, capturing the data and viewing in real time if
image reg-istration was working. The entire cave was
scanned in parts and the output for each capture ses-
sion corresponded to a .db file, which is an SQLite file
format that stores RGB and depth information, and
will be later used in the 3D reconstruction process.
3.2 3D Reconstruction
The RTAB-Map’s 3D reconstruction pipeline can be
fed with real time data from sensors, or with im-
age frames of a previously recorded database, which
was used in this work. The default options were
used and the only modification was the feature detec-
tor/descriptor chosen, set to SIFT (Lowe, 2004). In
order to perform the reconstruction process, a more
powerful computer was used. Even using a computer
with a Core i7 CPU 2.9GHz processor, with 32GB
of RAM memory, 2TB SSD storage and an NVIDIA
GTX 1080 GPU, the entire reconstruction takes more
than 15 minutes to be completed.
Since the cave data was captured by parts, i.e.,
there were different .db files corresponding to the
same cave, it was possible to split the reconstruction
process, processing each file at a time. RTAB-Map
is capable of receiving all .db files at once and pro-
cess all of them together. In fact, we tried that option,
but the reconstruction took too long and the software
was not able to correctly register the different point
clouds captured. Therefore, we opted to generate a
point cloud for each .db file captured and later per-
form a manual registration of all point clouds.
2
http://introlab.github.io/rtabmap
VISAPP 2023 - 18th International Conference on Computer Vision Theory and Applications
1010
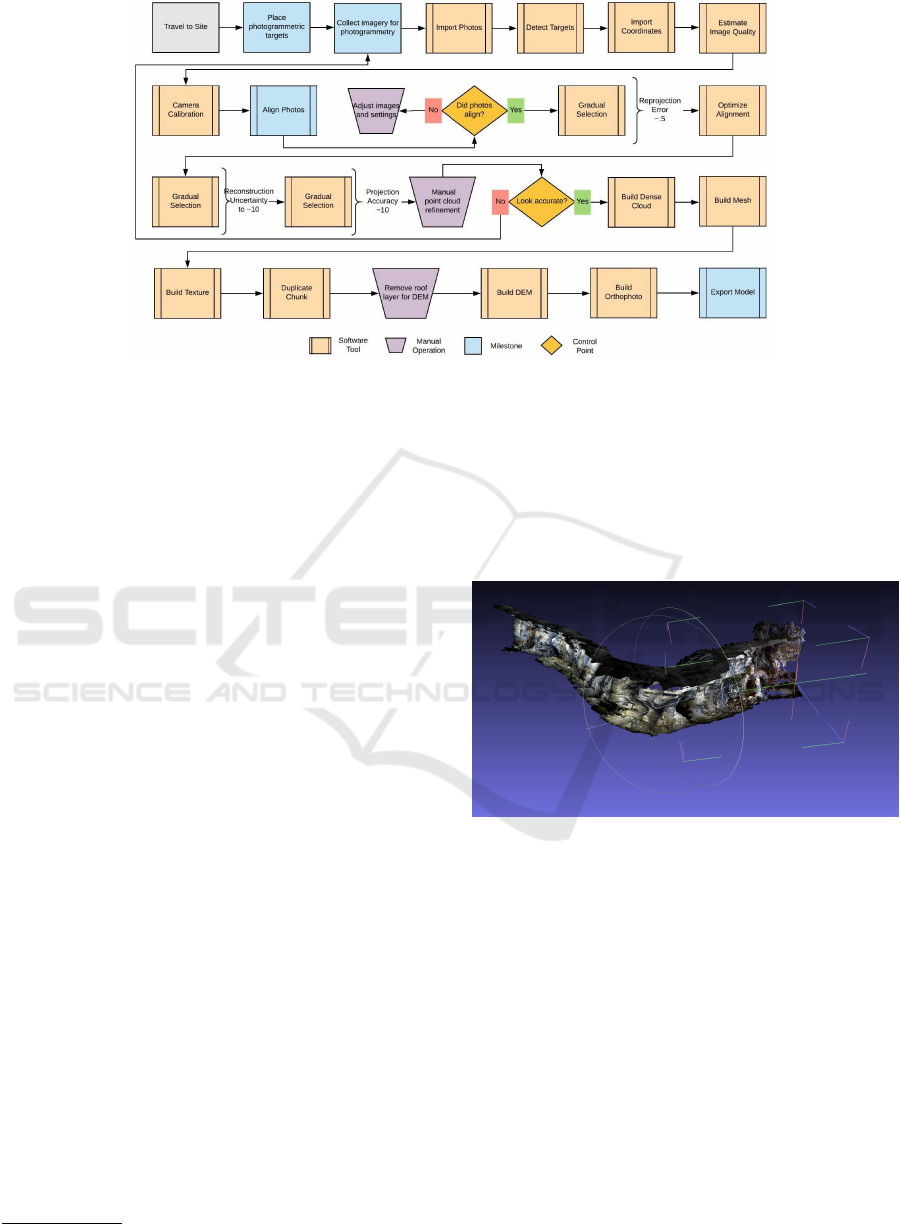
Figure 5: Protogrammetry workflow from the work of Lee (Lee, 2018).
3.3 Data Extraction/Visualization
An important part of the full 3D reconstruction of a
cave lies in the combination of its point clouds. If
there is more than one point cloud to process, a reg-
istration operation is necessary, i.e., an alignment be-
tween different points clouds will be necessary and
special attention must be paid to precisely overlap in-
tersections. This alignment can be done manually or
automatically, and this is a computationally demand-
ing process since its goal is to find a 3D to 3D trans-
form that brings the points from a point cloud coordi-
nate system to a different one, in a coherent way.
After obtaining the isolated point clouds, we used
Meshlab
3
for the manual point cloud registration.
This process was done in the presence of the persons
that captured the original data, so they could solve
questions about the cave shape. Figure 6 illustrates
the process of manually registering two point clouds
using Meshlab. While one point cloud remains still,
the second one is rotated/moved to match the previ-
ous one. Since we use an RGB-D sensor to capture
data, and their reference scale is the same, there is
no need to change scale for all points clouds. Some-
times, photos taken inside the cave were used to make
sure the point clouds being registered was correct. An
example of such photos can be visualized in Figure
7. In future situations, using some landmarks (e.g. a
solid object set at the cave floor or walls) when cap-
turing data would make this matching process easier
and more precise. After performing registration for
all generated point clouds, we were able to see the
entire path reconstructed, as shown in Figure 8.
After generating the final point cloud based on
the combination of the partial ones, data visualization
3
https://www.meshlab.net
is a concern. Considering that in the case of caves
points clouds will be usually dense (made of millions
of points close to each other), optimized approaches
must be used to avoid wasting the available computa-
tional resources. Idrees and Pradhan (Idrees and Prad-
han, 2017b) describe different possible visualizations
for data captured.
Figure 6: Example of two different point clouds being man-
ually registered using Meshlab.
4 DISCUSSION
3D mapping has been a valuable support tool in sev-
eral areas but just recently it became accessible for
speleologists and other cave-related professionals. 3D
mapping may help those professionals to acquire reli-
able information on the cave’s physical structure, and
even on biological features, like deposits of guano or
areas with higher animal concentration. However, this
is a relatively new technology and many cave profes-
sionals are not familiar with, so capturing such data
in field conditions may not be a simple task. The
major difficulties may be associated to the correct
equipment manipulation, good quality illumination
Low-Cost 3D Reconstruction of Caves
1011
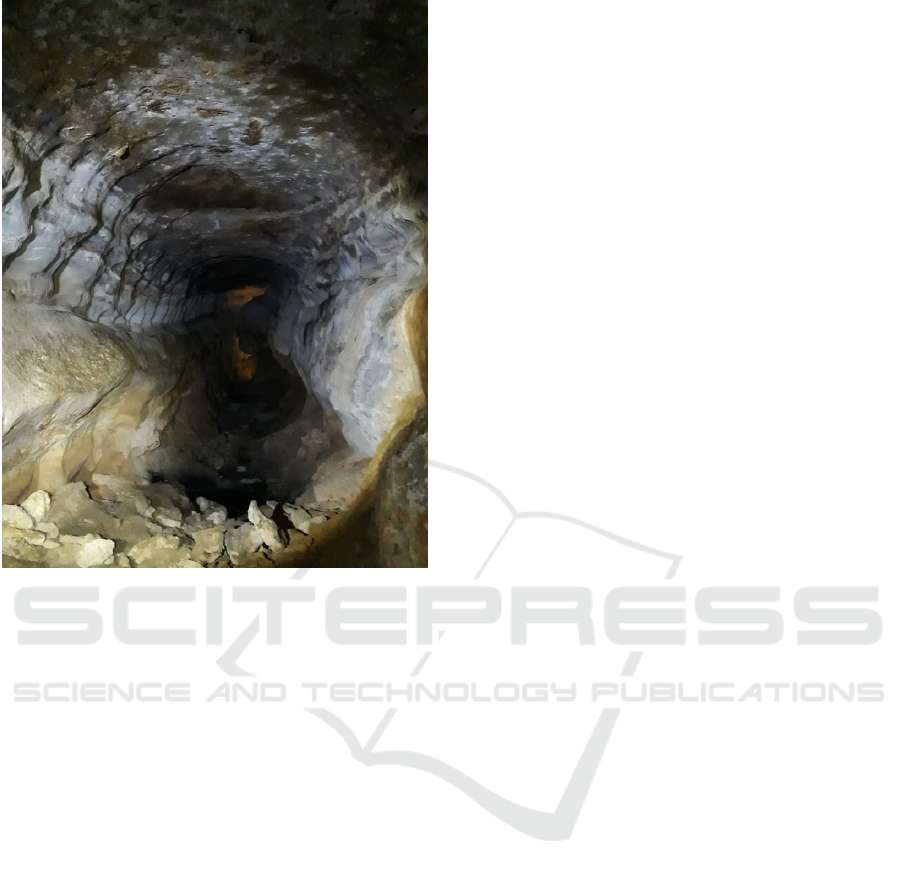
Figure 7: Photo taken by biologist to illustrate an interior
passage of the cave.
and even to how well- trained are the professionals to
capture data. All these characteristics are fundamen-
tal for an adequate data registration. Initial patience
and training are necessary.
The equipment used (Macbook + Xtion sensor)
showed to be very sensible to rapid movements and to
abrupt direction changes during the scanning process.
In situations like that, the software used for capturing
the data (RTAB-Map) frequently freezes due to im-
precise tentatives to find consecutive matched frames.
When the baseline is too large, the frames are differ-
ent enough to result in less matches, and consequently
the slam algorithm used in RTAB-Map failed. More-
over, there are difficult parts of the cave to access due
to their irregularity, making it harder for the team of
biologists to reach them.
The need for regular illumination and the use
of the sensor coupled to the laptop demanded more
than one professional for capturing the data. In
our approach, three professionals fully equipped with
lanterns and reflectors were required to work syn-
chronously so that the data capture could be success-
ful. In order to shorten the wide baseline between
frames, the field team started moving as slow as pos-
sible. One suggestion was to adapt the equipment to
a stabilization system to minimize the impact caused
by the terrain irregularity. The biologists were capa-
ble of using the equipment (Macbook + Xtion), but
they were just testing it. Refinements will be nec-
essary to improve both usability and ergonomics, in
case a better precision is needed.
Considering a laptop is used for visualization of
the captured data in real time, the cable connecting
the laptop to the RGB-D sensor has to be long enough
so the field team can keep distance while capturing
data inside the cave. A shorter cable would make the
capturing process less continuous and unstable, con-
tributing to the interruption of the process.
The proposed approach may generate different
database files for the same physical space (with much
data intersection). While this is good for registering
the point clouds, it is advisable to use some kind of
marker on the cave in order to facilitate further man-
ual registration of the captured point clouds. In this
work, the capture was performed without the use of
such visual markers, and it made the manual registra-
tion process take longer than expected.
Battery availability for the notebook used in field
work may also be an issue. A good battery auton-
omy may allow a single shot mapping, depending on
the extension of the cave and the objective of the field
team. Since our field team was testing the solution
and wanted to evaluate the quality of the captured
data, they had no problem in this sense. However,
longer and deeper caves will certainly require mul-
tiple scanning sessions or frequent battery replace-
ments.
During our field test, the system was freezing af-
ter some minutes of use due to memory restrictions
of the notebook used. We suspect that this happens
due to RTAB-Map’s high memory consumption dur-
ing the capture. Our field team recommend that caves
with larger spaces should be scanned in different parts
so that the point clouds could be joined later. The
longer is the capture time, the higher is the possibility
of the software to freeze and to lose the captured data
so far. Therefore, the field team must previously an-
alyze which parts of the cave will be recorded before
moving to a new section.
In summary, the equipment proved to be satisfac-
tory in the sense of allowing the acquisition of data
needed, but there is still room for improvements in
both hardware and software.
In the software side, we are currently working
on porting RTAB-Map to the Android platform while
adapting it to work with Intel Realsense RGB-D sen-
sors. This way, any Android phone could work as
a portable capture/reconstruction station. There is a
RTAB-Map version for iOS devices that have LiDAR
sensors, and we intend to do the same with Android
VISAPP 2023 - 18th International Conference on Computer Vision Theory and Applications
1012

Figure 8: Final reconstructed point cloud obtained from manual registration using Meshlab.
devices that use external RGB-D sensors. We also in-
tend to do some comparison of the obtained results
with the 3D reconstruction that comes as native out-
put of an iPhone 14 pro max, since it already has a Li-
DAR sensor and provides 3D reconstruction capabil-
ities natively. We have performed some experiments
on controlled environments with the iPhone and the
results were quite impressive, but tests in the real cave
scenario are still being planned. Efforts regarding im-
proving the reconstruction processes are also on the
go. We are performing some experimentation with
Neural Radiance Fields (NeRFs), which seems to be
the state of the art in 3D reconstruction at the time this
paper was written. Even for NeRFs, the cave environ-
ment may be challenging due to lack of or irregular
illumination and should be carefully investigated.
5 CONCLUSION
This work proposed a low-cost solution for 3D recon-
struction of caves, by means of the use of RGB-D sen-
sors. Our approach is an interesting alternative to the
well-known and commonly used laser scanning tech-
nologies, which are prohibitively expensive and hard
to acquire in Brazil. The proposed approach should
allow cave users to scan parts or even complete cave
structures, with emphasis on smaller parts like spe-
cific speleothems or details. The used sensor showed
enough resolution to enable a full 3D reconstruction
based on the combination of a sequence of captured
RGB-D images. Our proposed solution could en-
able, for instance, the non-destructive documentation
of cave shapes, forms and structures with the 3D mod-
els being manipulated from different points of view
in the computer. Besides, the 3D maps produced may
complement, correct and refine already existing topo-
graphical and cartographic mappings or new ones in
unmapped caves.
Complementary, information such as volume and
area calculations from the final cave 3D point cloud
may be used for additional research and environmen-
tal licensing. As future directions, we intend to de-
velop a miniaturized hardware platform based on a
Raspberry Pi 4 so it would be possible to have higher
mobility while capturing data inside the caves. This
would solve some of the problems detected by us
in the field. We also intend to improve the cap-
ture process by using a customized data recorder tool
from RTAB-Map. This would allow less processing
while capturing data, and consequently less power
consumption.
Finally, we intend to improve the 3D reconstruc-
tion process so that less human intervention is nec-
essary to record the point clouds. We plan to de-
velop an optimized solution to allow cave visualiza-
tion via web browser, using for example the Three.js
4
library. However, this will be challenging due to the
high number of points present in final caves recon-
structions. Optimizations will be necessary in order
to allow real time navigation on the browser inside
the virtual caves. Comparison with existing methods
regarding performance is also planned in a near fu-
ture.
ACKNOWLEDGEMENTS
The authors would like to thank CECAV/ICMBio
for financially supporting project “Modelagem 3D de
cavidades naturais subterr
ˆ
aneas”.
4
https://threejs.org/
Low-Cost 3D Reconstruction of Caves
1013

REFERENCES
Aiello, D., Basso, A., Spena, M., D’Agostino, G., Monte-
doro, U., Galizia, M., Grasso, R., and Santagati, C.
(2019). The virtual batcave: A project for the safe-
guard of a unesco whl fragile ecosystem. Interna-
tional Archives of the Photogrammetry, Remote Sens-
ing & Spatial Information Sciences.
Azp
´
urua, H., Saboia, M., Freitas, G. M., Clark, L., Agha-
mohammadi, A.-a., Pessin, G., Campos, M. F., and
Macharet, D. G. (2023). A survey on the autonomous
exploration of confined subterranean spaces: Per-
spectives from real-word and industrial robotic de-
ployments. Robotics and Autonomous Systems,
160:104304.
Beraldin, J.-A., Blais, F., Cournoyer, L., Picard, M.,
Gamache, D., Valzano, V., Bandiera, A., Gorgoglione,
M. A., et al. (2006). Multi-resolution digital 3d imag-
ing system applied to the recording of grotto sites: the
case of the grotta dei cervi. In VAST, pages 45–52.
Escalera, S. (2012). Human behavior analysis from depth
maps. In International Conference on Articulated
Motion and Deformable Objects, pages 282–292.
Springer.
Gallay, M., Hochmuth, Z., Ka
ˇ
nuk, J., and Hofierka, J.
(2016). Geomorphometric analysis of cave ceiling
channels mapped with 3-d terrestrial laser scanning.
Hydrology and Earth System Sciences, 20(5):1827.
Gallay, M., Ka
ˇ
nuk, J., Hochmuth, Z., Meneely, J. D.,
Hofierka, J., and Sedl
´
ak, V. (2015). Large-scale and
high-resolution 3-d cave mapping by terrestrial laser
scanning: a case study of the domica cave, slovakia.
International Journal of Speleology, 44(3):6.
Grohmann, C.H., Z.-G. G. G. B. F. A. F. A. I. (2019). Ma-
peamento e modelagem 3d do setor tur
´
ıstico da cav-
erna do diabo (sp) com laser scanner: resultados pre-
liminares. In Anais do 35º Congresso Brasileiro de
Espeleologia.
Idrees, M. O. and Pradhan, B. (2017a). Characterization
of macro-and micro-geomorphology of cave channel
from high-resolution 3d laser scanning survey: case
study of gomantong cave in sabah, malaysia. In Cave
Investigation. IntechOpen.
Idrees, M. O. and Pradhan, B. (2017b). Frontier in three-
dimensional cave reconstruction—3d meshing versus
textured rendering. In Global Civil Engineering Con-
ference, pages 1029–1038. Springer.
Lee, T. O. (2018). An Examination of Close-Range
Photogrammetry and Traditional Cave Survey Meth-
ods for Terrestrial and Underwater Caves for 3-
Dimensional Mapping. PhD thesis, University of
Southern California.
Li, Y., Zhao, L., Chen, Y., Zhang, N., Fan, H., and Zhang,
Z. (2023). 3d lidar and multi-technology collabora-
tion for preservation of built heritage in china: A re-
view. International Journal of Applied Earth Obser-
vation and Geoinformation, 116:103156.
Lowe, D. G. (2004). Distinctive image features from scale-
invariant keypoints. International journal of computer
vision, 60(2):91–110.
McFarlane, D., Buchroithner, M., Lundberg, J., Petters,
C., Roberts, W., and Van Rentergen, G. (2013).
Integrated three-dimensional laser scanning and au-
tonomous drone surface-photogrammetry at goman-
tong caves, sabah, malaysia. In Proceedings of the
16th International Congress of Speleology, Brno, vol-
ume 1, pages 317–319.
Mohammed Oludare, I. and Pradhan, B. (2016). A decade
of modern cave surveying with terrestrial laser scan-
ning: A review of sensors, method and application
development. International Journal of Speleology,
45(1):8.
Oguchi, T., Yuichi, S. H., and Wasklewicz, T. (2011). Data
sources. In Developments in Earth Surface Processes,
volume 15, pages 189–224. Elsevier.
Pukansk
´
a, K., Barto
ˇ
s, K., Sabov
´
a, J., and Tometzov
´
a, D.
(2018). High-resolution 3-d mapping for the sur-
vey of valuable inaccessible medvedia cave in the na-
tional park of slovensk
`
y raj. In Advances and Trends
in Geodesy, Cartography and Geoinformatics: Pro-
ceedings of the 10th International Scientific and Pro-
fessional Conference on Geodesy, Cartography and
Geoinformatics (GCG 2017), October 10-13, 2017,
Dem
¨
anovsk
´
a Dolina, Low Tatras, Slovakia, page 89.
CRC Press.
Sellers, W. and Chamberlain, A. (1998). Ultrasonic
cave mapping. Journal of archaeological science,
25(9):867–873.
Tometzov
´
a, D., Hlav
ˇ
nov
´
a, B., Drevko, S., Pukansk
´
a, K.,
Barto
ˇ
s, K., Bieda, A., and Kse
ˇ
nak, L. (2020). The
development of geotourism with the use of 3d digital
cave model. a case study of the bear cave, slovakia8.
Geomatics and Environmental Engineering, 14(2).
Ullman, M., Laugomer, B., Shicht, I., Langford, B.,
Ya’aran, S., Wachtel, I., Frumkin, A., and Davidovich,
U. (2023). Formation processes and spatial patterning
in a late prehistoric complex cave in northern israel
informed by slam-based lidar. Journal of Archaeolog-
ical Science: Reports, 47:103745.
VISAPP 2023 - 18th International Conference on Computer Vision Theory and Applications
1014
