
Prediction of Shuttle Trajectory in Badminton Using Player’s Position
Yuka Nokihara, Ryosuke Hori
a
, Ryo Hachiuma
b
and Hideo Saito
c
Department of Information and Computer Science, Keio University, Yokohama, Japan
Keywords:
Trajectory Prediction, Sports Analysis, Time-Sequence Model.
Abstract:
Data analysis in net sports, such as badminton, is becoming increasingly important. This research aims to
analyze data so that players can gain an advantage in the fast rally development of badminton matches. We
investigate the novel task of predicting future shuttle trajectories in badminton match videos and propose a
method that uses shuttle and player position information. In an experiment, we detected players from match
videos and trained a time-sequence model. The proposed method outperformed baseline methods that use
only the shuttle position information as the input and other methods that use time-sequence models.
1 INTRODUCTION
Recently, computer vision technologies have been ap-
plied to automatically analyze videos that capture a
net sports match, such as tennis, volleyball, and bad-
minton. For example, player pose detection (Sun
et al., 2019) and ball detection/tracking (Cao et al.,
2021) can be used to extract information during a
match from a video. This extracted information can
be used to estimate the high-level context, such as the
actions of the players.
One of the important tasks for sports video analy-
sis is to predict (forecast) the future movement of the
ball, shuttle, and opponent. Rallies are played, and if
a player can forecast the movement of the next ball
or shuttle during the rally, they will have an advan-
tage over their opponent. Therefore, many players
play while predicting future ball and shuttle move-
ments based on information acquired through expe-
rience. Especially in badminton, where the shuttle
speed is faster than in other net sports such as tennis
and table tennis, it is not an exaggeration to say that
predicting the movement of the shuttle a few tenths
ahead can mean the difference between winning and
losing a match.
Most of the research on future predictions in net
sports aims to predict the landing point of the ball or
shuttle (Waghmare et al., 2016; Wang et al., 2022).
However, unlike tennis or table tennis, badminton re-
quires the shuttle to be hit back without bouncing.
a
https://orcid.org/0000-0001-5553-2352
b
https://orcid.org/0000-0001-8274-3710
c
https://orcid.org/0000-0002-2421-9862
In addition, the net is high, so the shuttle must be
hit from a higher, faster forward position to gain an
advantage in the match. This objective cannot be
achieved by predicting the landing point. Therefore,
to gain an advantage in the match, it is necessary to
predict the movement of the shuttle itself (i.e., its tra-
jectory). Existing research on trajectory prediction
has been conducted for short periods of time, such as
the serve in table tennis and the toss in volleyball, and
not as a rally. Trajectory prediction in badminton has
not yet been examined.
In this paper, we present a method that predicts
the future trajectory of the badminton shuttle during a
match. One of the simple methods for modeling the
motion of the badminton shuttle is to input previous
shuttle trajectories and output the future shuttle tra-
jectories using sequential models, such as recurrent
neural networks (RNNs). For example, a player de-
cides where to hit the shuttle back by taking the other
player’s position into account when the player returns
the shuttle. Therefore, this paper presents a method
for predicting the future shuttle trajectory using the
players’ position information in addition to the shut-
tle’s position information.
To verify the effectiveness of the proposed
method, we employ the shuttlecock trajectory dataset
(Ik, 2020). Experiments confirm that the proposed
method improves the accuracy compared to the base-
line method using only the shuttle position informa-
tion. The study can be summarized as follows:
• The proposed method predicts the trajectory of the
shuttle using the players’ position information in
addition to the shuttle’s position information.
788
Nokihara, Y., Hori, R., Hachiuma, R. and Saito, H.
Prediction of Shuttle Trajectory in Badminton Using Player’s Position.
DOI: 10.5220/0011785800003417
In Proceedings of the 18th International Joint Conference on Computer Vision, Imaging and Computer Graphics Theory and Applications (VISIGRAPP 2023) - Volume 5: VISAPP, pages
788-795
ISBN: 978-989-758-634-7; ISSN: 2184-4321
Copyright
c
2023 by SCITEPRESS – Science and Technology Publications, Lda. Under CC license (CC BY-NC-ND 4.0)

Table 1: Existing studies of future predictions in net sports.
Year Author Sports Prediction target
2019 Shimizu et al. Tennis Shot direction
2019, 2020 Wu et al. Table tennis Serve landing point
2016 Waghmare et al. Badminton Shuttle landing point
2022 Wang et al. Badminton Stroke (Shot type and shuttle landing point)
2019 Suda et al. Volleyball Toss trajectory
2020 Lin et al. Table tennis Serve trajectory
2022 Proposed Badminton Shuttle trajectory
• The proposed method is more accurate than the
baseline method using only the shuttle’s position
information as input.
2 RELATED WORK
2.1 Future Predictions in Net Sports
In recent years, research on future predictions in
sports has become more popular, including net sports
such as tennis, table tennis, volleyball, and bad-
minton. In this section, we describe existing stud-
ies on net sports and compare them with the present
study.
As shown in Table 1, existing studies of future pre-
diction in net sports include shot direction, landing
point, and trajectory prediction. The following is a
detailed description of existing research in each sport.
In tennis, Shimizu et al. predicted the future shot
direction in three categories–right cross, left cross,
and straight–based on the player’s continuous posi-
tion and posture information until the ball was hit
(Shimizu et al., 2019). This was the first study of shot
direction prediction in tennis, and a new dataset with
shot directions was also created. However, in bad-
minton, the direction prediction is not enough because
players move differently in low and high trajectories.
In table tennis, Wu et al. predicted the landing
point of the service based on the player’s motion in-
formation up to just before hitting the ping-pong ball,
which was obtained by pose estimation (Wu et al.,
2019; Wu and Koike, 2020). In badminton, Wagh-
mare et al. predicted the landing point of the shut-
tle by calculating the shuttle’s speed and direction us-
ing a two-dimensional laser scanner (Waghmare et al.,
2016). Wang et al. used a network called ShuttleNet
to predict the next stroke based on the stroke (shot
type and landing point) (Wang et al., 2022). This is
the first study on stroke prediction in sports. These
methods assist the player in getting to the landing
point quickly but are not sufficient to help the player
gain an advantage in the game by hitting the shuttle
back faster and higher.
In volleyball, Suda et al. predicted the trajectory
of the toss 0.3 sec before the actual toss based on the
setter player’s 3D joint positions (Suda et al., 2019).
In table tennis, Lin et al. predicted the trajectory of a
subsequent serve from the initial trajectory of the ser-
vice using a dual-network method in which two sepa-
rate trajectories are learned: a parabola from the ser-
vice point to the landing point on the table (parabola
1) and a parabola from the landing point to the hitting
point (parabola 2) (Lin et al., 2020).
All of these existing studies were conducted in the
last few years. As shot direction prediction in tennis
(Shimizu et al., 2019) and stroke prediction in bad-
minton (Wang et al., 2022) were the first tasks to be
worked on, the research on future prediction in net
sports is considered to be in its developing stage. As
for research on future prediction in badminton, land-
ing point prediction and stroke prediction have been
examined, but trajectory prediction has not been ade-
quately studied. Therefore, in this study, we perform
trajectory prediction of the shuttle in badminton.
2.2 Object Detection
Object detection identifies objects in an image as
bounding boxes. There are two types of deep
learning-based object detection methods: a one-step
method that directly detects the target object from
the input image and a two-step method that selects
rough candidate regions from the input image and
then performs detailed detection for each candidate
region. The former is a method that emphasizes pro-
cessing speed, such as in real-time, and typical meth-
ods include YOLOv4 (Bochkovskiy et al., 2020). The
latter has a lower processing speed than the former,
but higher detection accuracy and typical methods in-
clude Region-CNN (R-CNN) (Girshick et al., 2014),
Fast R-CNN (Girshick, 2015), and Faster R-CNN
(Ren et al., 2015). In this method, we use Faster R-
CNN, which is the best-performing of the two-stage
methods that can obtain more accurate position and
posture information about the players.
Prediction of Shuttle Trajectory in Badminton Using Player’s Position
789
Input Video
Players’
Trajectory (𝑅
4
)
Shuttle’s
Trajectory (𝑅
2
)
Shuttle’s Trajectory (𝑅
2
)
Input
Trajectory
Data (𝑅
6
)
Player
Detection
LSTM
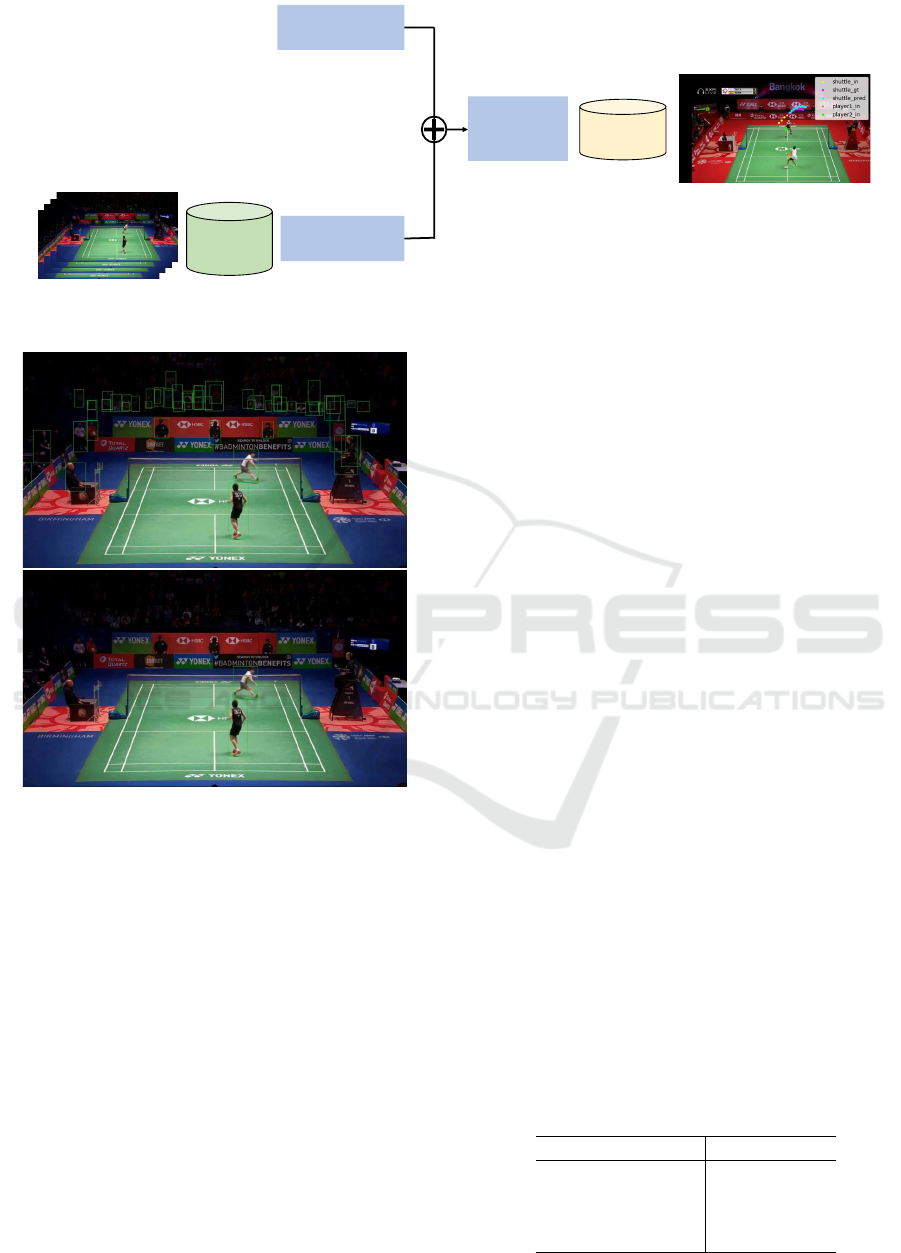
Figure 1: Overview of the proposed method.
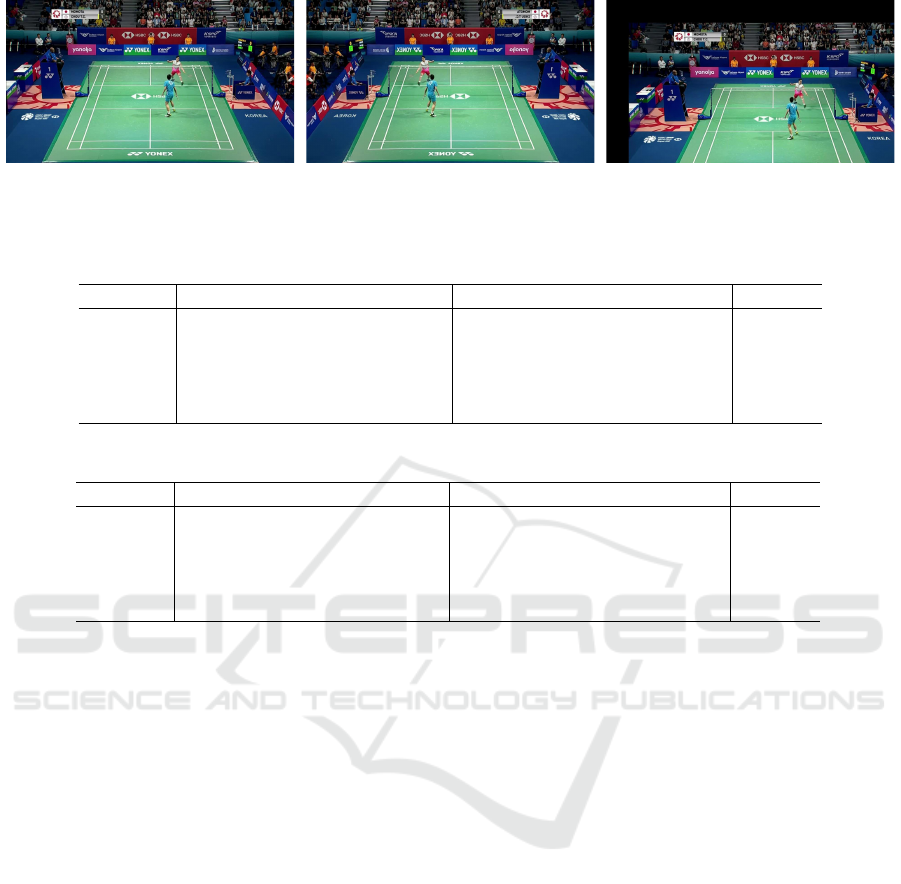
Figure 2: Player detection.
3 METHOD
3.1 Overview
We propose a trajectory prediction method based on
the shuttle and player positions. As shown in Fig-
ure 1, the proposed method consists of two parts. In
the first part, we take a sequence of images obtained
from badminton match videos as the input and per-
form player detection for each image. The players’
position information is stored as bounding boxes. In
the second part, trajectory prediction is performed us-
ing the shuttle position information and the player po-
sition obtained in the first stage as inputs.
3.2 Player Detection
The object detector for detecting humans uses a Faster
R-CNN (Ren et al., 2015) that has been previously
trained with the Microsoft Common Objects in Con-
text (MS COCO) dataset (Lin et al., 2014).
The detection results include bounding boxes and
confidence levels. The bounding box is represented
by four two-dimensional coordinate points on the im-
age when the human range is surrounded by a rect-
angle. The confidence level is a value between 0 and
1, indicating the likelihood that the object in the de-
tected bounding box is a human. By using the con-
fidence level, only players are detected instead of all
people, including referees and spectators. Referees
and spectators detected in addition to the players have
a lower confidence level than players because they are
sitting, have only their faces in the image, are facing
sideways, or are small. Therefore, as shown in Figure
2, we acquire the player’s bounding box by assuming
that the person with the highest confidence level is the
player. The center coordinates of the players are cal-
culated using the acquired bounding boxes, and the
players are differentiated by numbering them in the
image, starting with the player on the lower side.
3.3 Trajectory Prediction
The trajectory prediction in this method uses the po-
sition information of the shuttle and the position in-
formation of the players obtained by the object de-
tector. We employ the two-dimensional coordinates
Table 2: Learning rate for each time-sequence model.
Models Learning rate
RNN 0.005
GRU 0.01
Transformer 0.001
LSTM (Proposed) 0.02
VISAPP 2023 - 18th International Conference on Computer Vision Theory and Applications
790
(a) (b) (c)
Figure 3: Data augmentation. (a) is the original image, (b) is the image after left-right flipping, and (c) is the image with 100
translations to the right and 100 translations to the bottom.
Table 3: ADE results.
Input data Models Match A Match B Match C Average
Baseline Shuttle LSTM 0.06033 0.04778 0.05507 0.05469
Shuttle + Player RNN 0.05801 0.04194 0.05381 0.05237
Shuttle + Player GRU 0.05937 0.04110 0.05012 0.05199
Shuttle + Player Transformer 0.06152 0.04579 0.05327 0.05518
Proposed Shuttle + Player LSTM 0.05497 0.04092 0.04938 0.04908
Table 4: FDE results.
Input data Models Match A Match B Match C Average
Baseline Shuttle LSTM 0.10507 0.08872 0.09161 0.09424
Shuttle + Player RNN 0.10197 0.07416 0.08576 0.08944
Shuttle + Player GRU 0.10704 0.07655 0.08248 0.09137
Shuttle + Player Transformer 0.10056 0.07389 0.08327 0.08894
Proposed Shuttle + Player LSTM 0.09534 0.07224 0.08053 0.08391
x
s
and y
s
as the shuttle position information, which
is obtained from the shuttle detector, such as Track-
Net (Huang et al., 2019). The player position in-
formation is calculated by finding the center coordi-
nates of the bounding box obtained with player de-
tection. This is represented as four-dimensional co-
ordinates (x
p1
, y
p1
, x
p2
, andy
p2
), where x
p1
represents
the x coordinate of the player who is shown on the
front side of the image. The shuttle position infor-
mation and the player position information are com-
bined to form the six-dimensional position coordi-
nates (x
s
, y
s
, x
p1
, y
p1
, x
p2
, andy
p2
).
This combined position information is inputted
to the long short-term memory (LSTM) network
(Hochreiter and Schmidhuber, 1997), which is the
second module for predicting the shuttle trajectory.
The output of the LSTM, which stacks multiple his-
torical information as the input, is further passed to
the fully connected layer.
4 EXPERIMENT
4.1 Dataset
We used the shuttlecock trajectory dataset (Ik, 2020).
This dataset was created for model training and test-
ing of TrackNet (Huang et al., 2019) and TrackNetV2
(Sun et al., 2020) for badminton applications and con-
sists of 26 match videos for training and three match
videos for testing. The resolution of the match video
was 1280 × 720, the frame rate was 30 fps, and the
video was separated by rallies. A rally is a record that
begins with a serve and ends with its score.
In each frame, information on the position of the
shuttle and the moment the shuttle hits the racket is
given. However, the last three of the 26 match videos
for learning are personal play videos, to which no in-
formation is given to each frame. In this method, we
used 23 matches for learning and three matches for
testing, excluding the amateur matches. The profes-
sional matches were singles matches in international
tournaments held between 2018 and 2021. The 23
match rally videos for training were randomly split so
that the training set was 80% and the validation set
was 20%. The three match rally videos for testing
Prediction of Shuttle Trajectory in Badminton Using Player’s Position
791
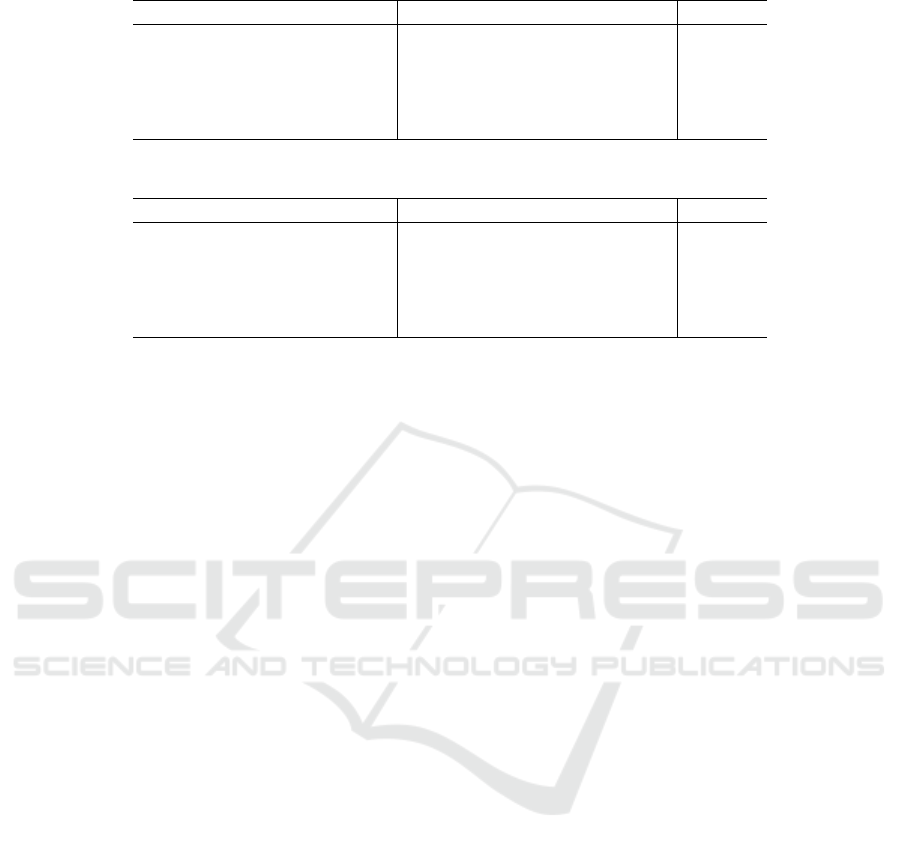
Table 5: ADE results when input/output frames are changed.
Input frames Output frames Match A Match B Match C Average
12 4 0.01863 0.02104 0.02171 0.02054
10 6 0.02523 0.02678 0.02971 0.02740
8 8 0.03330 0.03300 0.03308 0.03301
6 10 0.04696 0.03654 0.04358 0.04363
4 12 0.05497 0.04092 0.04938 0.04908
Table 6: FDE results when input/output frames are changed.
Input frames Output frames Match A Match B Match C Average
12 4 0.02926 0.03410 0.03105 0.03160
10 6 0.04364 0.04110 0.04558 0.04460
8 8 0.05607 0.05788 0.05510 0.05597
6 10 0.08200 0.06640 0.07325 0.07552
4 12 0.09534 0.07224 0.08053 0.09180
were set as the test set.
Data cleansing was also performed on this dataset
to improve prediction accuracy. The position coor-
dinates of the shuttle in the data set are set to (0, 0)
when the shuttle is hidden by a person or otherwise
not visible, and this has a negative impact on learn-
ing because the shuttle appears to move unnaturally
in the frames before and after it. When such frames
were included, data cleansing was performed so that
the consecutive frame group was not used for learn-
ing.
In addition, data augmentation was performed to
increase the data virtually. As the badminton match
video would no longer be appropriate as a sport if it
were flipped upside down, only left-right flipping and
translations were performed. After the original image
was flipped left and right with a probability of 50%,
the image was translated to the right side or the bot-
tom in the range of 0–100 with respect to the width
and height. Figure 3 shows the results of the data aug-
mentation.
4.2 Evaluation Metrics
Two types of displacement errors were employed as
evaluation metrics for this experiment. The first is the
average displacement error (ADE), which is the aver-
age of the errors across all output frames. The sec-
ond is the final displacement error (FDE). This is the
error at the final point of the output trajectory. The
1280 × 720 pixel image was normalized so that the
minimum value is 0, and the maximum value is 1.
The normalized coordinate values were used to calcu-
late the Euclidean distance between two points to de-
termine the error. The ADE is particularly important
because this method predicts the trajectory for multi-
ple frames rather than the landing point.
4.3 Other Models
To verify the effectiveness of the proposed method,
we set a baseline model for a method that does not in-
put the position coordinates of the player after object
detection, only the position information of the shuttle.
We used LSTM as the model for trajectory prediction,
but also investigated three other time-sequence mod-
els: an RNN (Rumelhart et al., 1986), Gated Recur-
rent Unit (GRU) (Cho et al., 2014), and Transformer
(Vaswani et al., 2017).
4.4 Network Training
We implemented the proposed approach in PyTorch
(Paszke et al., 2017) (1.12.1+cu102, with Python
3.7.13) and ran it on the NVIDIA TITAN RTX pro-
cessing unit using CUDA 11.4. For all time-sequence
models, the number of layers was set to 3, the hidden
layer to 128 dimensions, and the network was opti-
mized using Adam (Kingma and Ba, 2015), with a
weight decay of 1e-4 and the momentums β1 = 0.5
and β2 = 0.999 and a learning rate as shown in Ta-
ble 2. We trained the model for 400 epochs with four
input frames and 12 output frames for all cases. The
mean squared error (MSE) was employed as the loss
function, and the output results were compared with
the correct data to calculate the error. Then the pa-
rameters were updated to reduce the error using the
error backpropagation method.
VISAPP 2023 - 18th International Conference on Computer Vision Theory and Applications
792
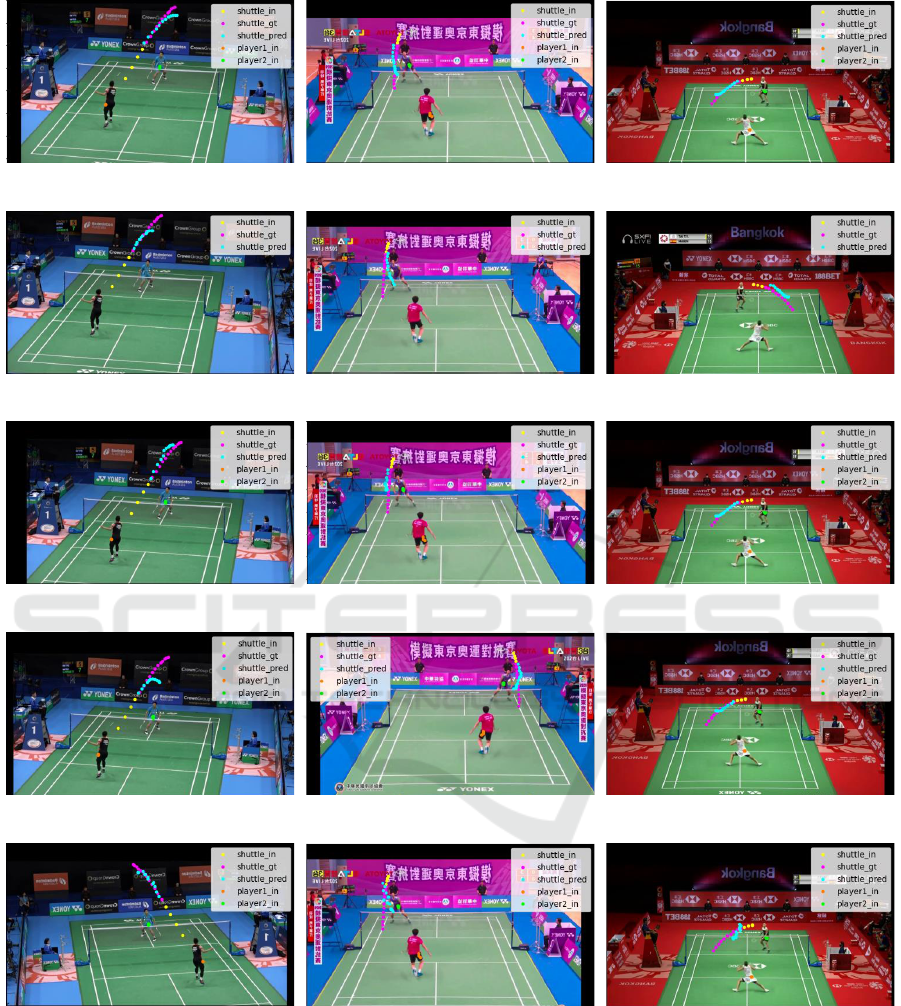
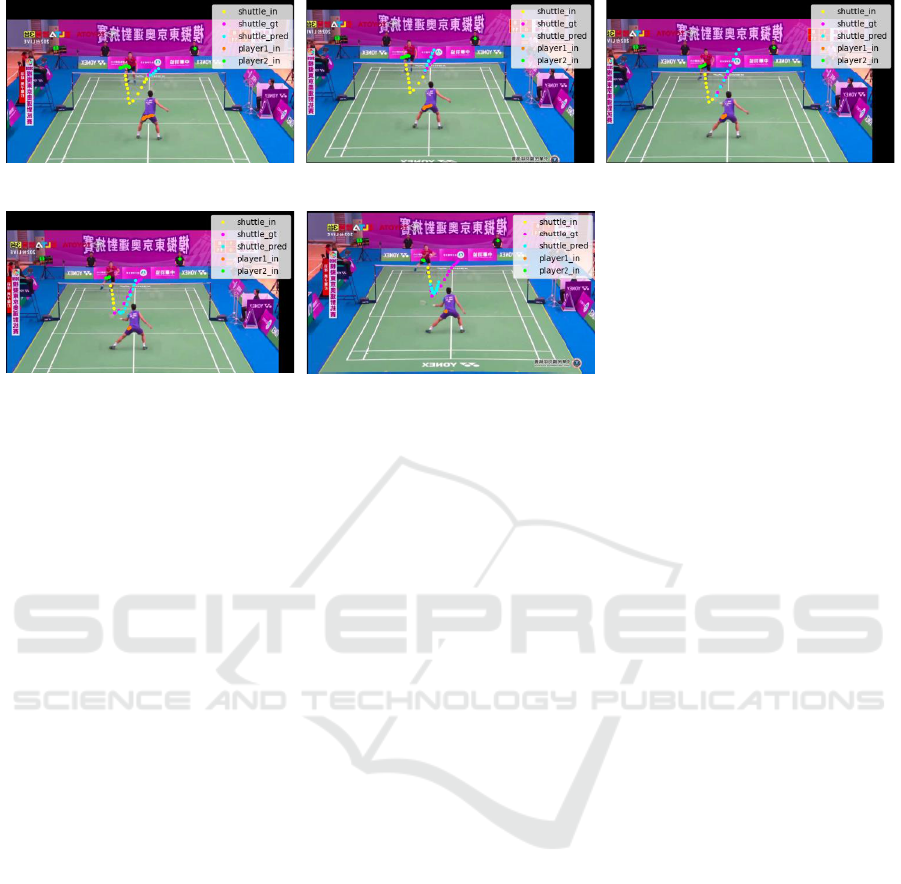
(a) Match A of the proposed method. (b) Match B of the proposed method. (c) Match C of the proposed method.
(d) Match A of the baseline. (e) Match B of the baseline. (f) Match C of the baseline.
(g) Match A of the RNN. (h) Match B of the RNN. (i) Match C of the RNN.
(j) Match A of the GRU. (k) Match B of the GRU. (l) Match C of the GRU.
(m) Match A of the Transformer. (n) Match B of the Transformer. (o) Match C of the Transformer.
Figure 4: Future predictions of shuttle trajectories.
5 RESULTS
5.1 Comparison with Other Models
The results are shown in Figure 4, Table 3, and Table
4. The proposed method shows the best results in the
ADE and the FDE. The results show that it is effective
to input not only the shuttle’s position but also both
the shuttle’s and the players’ positions and that LSTM
is the best model among the time-sequence models
examined.
Prediction of Shuttle Trajectory in Badminton Using Player’s Position
793
(a) Input: 12, Output: 4. (b) Input: 10, Output: 6. (c) Input: 8, Output: 8.
(d) Input: 6, Output: 10. (e) Input: 4, Output: 12.
Figure 5: Comparison according to the number of frames of input/output.
5.2 Comparison of the Number of
Frames of Input/output
The results for verifying how the accuracy varies by
changing the balance of the number of frames to be
input and the number of frames to be predicted are
shown in Figure 5, Tables 5, and Table 6. These
results show that as the number of input frames in-
creases and the number of frames to be predicted de-
creases, the accuracy improves.
6 CONCLUSION
In this paper, we approached the novel task of predict-
ing the trajectory of the shuttle in a badminton match
video and proposed a trajectory prediction method
that uses information about the shuttle’s position and
the players’ position to achieve this task. We also
conducted a comparison experiment with the baseline
method and confirmed the effectiveness of the pro-
posed method. Furthermore, we verified which model
is better by changing the time-sequence model, and
found that the LSTM used in this method achieves
the highest accuracy.
REFERENCES
Bochkovskiy, A., Wang, C., and Liao, H. M. (2020).
Yolov4: Optimal speed and accuracy of object detec-
tion. CoRR, abs/2004.10934.
Cao, Z., Liao, T., Song, W., Chen, Z., and Li, C. (2021).
Detecting the shuttlecock for a badminton robot: A
yolo based approach. Expert Systems with Applica-
tions, 164:113833.
Cho, K., van Merrienboer, B., G
¨
ulc¸ehre, C¸ ., Bougares, F.,
Schwenk, H., and Bengio, Y. (2014). Learning phrase
representations using RNN encoder-decoder for sta-
tistical machine translation. CoRR, abs/1406.1078.
Girshick, R. (2015). Fast R-CNN. In Proceedings of the
IEEE International Conference on Computer Vision
(ICCV), pages 1440–1448.
Girshick, R., Donahue, J., Darrell, T., and Malik, J. (2014).
Rich feature hierarchies for accurate object detection
and semantic segmentation. In Proceedings of the
IEEE Conference on Computer Vision and Pattern
Recognition (CVPR), pages 580–587.
Hochreiter, S. and Schmidhuber, J. (1997). Long short-term
memory. Neural Computation, 9(8):1735–1780.
Huang, Y.-C., Liao, I.-N., Chen, C.-H.,
˙
Ik, T.-U., and Peng,
W.-C. (2019). Tracknet: A deep learning network for
tracking high-speed and tiny objects in sports applica-
tions. In 16th IEEE International Conference on Ad-
vanced Video and Signal Based Surveillance (AVSS),
pages 1–8.
Ik, T.-U. (2020). Shuttlecock trajectory dataset. https:
//hackmd.io/Nf8Rh1NrSrqNUzmO0sQKZw.
Kingma, D. P. and Ba, J. (2015). Adam: A method for
stochastic optimization. In Bengio, Y. and LeCun,
Y., editors, 3rd International Conference on Learning
Representations (ICLR).
Lin, H.-I., Yu, Z., and Huang, Y.-C. (2020). Ball tracking
and trajectory prediction for table-tennis robots. Sen-
sors, 20(2):333.
Lin, T.-Y., Maire, M., Belongie, S. J., Hays, J., Perona, P.,
Ramanan, D., Doll
´
ar, P., and Zitnick, C. L. (2014).
Microsoft COCO: Common objects in context. In Eu-
ropean Conference on Computer Vision (ECCV), vol-
ume 8693, pages 740–755.
Paszke, A., Gross, S., Chintala, S., Chanan, G., Yang, E.,
DeVito, Z., Lin, Z., Desmaison, A., Antiga, L., and
VISAPP 2023 - 18th International Conference on Computer Vision Theory and Applications
794

Lerer, A. (2017). Automatic differentiation in Py-
torch. In NIPS 2017 Workshop on Autodiff.
Ren, S., He, K., Girshick, R., and Sun, J. (2015). Faster
R-CNN: Towards real-time object detection with re-
gion proposal networks. In Advances in Neural Infor-
mation Processing Systems (NIPS), volume 28, pages
91–99.
Rumelhart, D. E., Hinton, G. E., and Williams, R. J. (1986).
Learning representations by back-propagating errors.
In Nature, volume 323, pages 533–536.
Shimizu, T., Hachiuma, R., Saito, H., Yoshikawa, T., and
Lee, C. (2019). Prediction of future shot direction
using pose and position of tennis player. In Proceed-
ings of the 2nd International Workshop on Multimedia
Content Analysis in Sports (MMSports), pages 59–66.
Suda, S., Makino, Y., and Shinoda, H. (2019). Prediction of
volleyball trajectory using skeletal motions of setter
player. In Proceedings of the 10th Augmented Human
International Conference (AH), pages 16:1–16:8.
Sun, K., Xiao, B., Liu, D., and Wang, J. (2019). Deep high-
resolution representation learning for human pose es-
timation. In Proceedings of the IEEE Conference
on Computer Vision and Pattern Recognition (CVPR),
pages 5686–5696.
Sun, N.-E., Lin, Y.-C., Chuang, S.-P., Hsu, T.-H., Yu, D.-
R., Chung, H.-Y., and
˙
Ik, T.-U. (2020). Tracknetv2:
Efficient shuttlecock tracking network. In Interna-
tional Conference on Pervasive Artificial Intelligence
(ICPAI), pages 86–91.
Vaswani, A., Shazeer, N., Parmar, N., Uszkoreit, J., Jones,
L., Gomez, A. N., Kaiser, L. u., and Polosukhin, I.
(2017). Attention is all you need. In 31st Conference
on Neural Information Processing System (NIPS), vol-
ume 30, pages 5998–6008.
Waghmare, G., Borkar, S., Saley, V., Chinchore, H., and
Wabale, S. (2016). Badminton shuttlecock detection
and prediction of trajectory using multiple 2 dimen-
sional scanners. In IEEE First International Confer-
ence on Control, Measurement and Instrumentation
(CMI), pages 234–238.
Wang, W.-Y., Shuai, H.-H., Chang, K.-S., and Peng, W.-
C. (2022). ShuttleNet: Position-aware fusion of rally
progress and player styles for stroke forecasting in
badminton. Proceedings of the AAAI Conference on
Artificial Intelligence (AAAI), 36(4):4219–4227.
Wu, E. and Koike, H. (2020). Futurepong: Real-time table
tennis trajectory forecasting using pose prediction net-
work. In Extended Abstracts of the 2020 CHI Confer-
ence on Human Factors in Computing Systems (CHI
EA), page 1–8.
Wu, E., Perteneder, F., and Koike, H. (2019). Real-time
table tennis forecasting system based on long short-
term pose prediction network. In SIGGRAPH Asia
Posters (SA), pages 23:1–23:2.
Prediction of Shuttle Trajectory in Badminton Using Player’s Position
795
