
BigGraphVis: Visualizing Communities in Big Graphs Leveraging
GPU-Accelerated Streaming Algorithms
Ehsan Moradi
a
and Debajyoti Mondal
b
Department of Computer Science, University of Saskatchewan, Canada
Keywords:
Graph Visualization, Big Graphs, Community Detection, GPGPU, Streaming Algorithms, Count-Min Sketch.
Abstract:
Graph layouts are key to exploring massive graphs. Motivated by the advances in streaming community detec-
tion methods that process the edge list in one pass with only a few operations per edge, we examine whether
they can be leveraged to rapidly create a coarse visualization of the graph communities, and if so, then how
the quality would compare with the layout of the whole graph. We introduce BigGraphVis which combines a
parallelized streaming community detection algorithm and probabilistic data structure to leverage the parallel
processing power of GPUs to visualize graph communities. To the best of our knowledge, this is the first
attempt to combine the potential of streaming algorithms coupled with GPU computing to tackle community
visualization challenges in big graphs. Our method extracts community information in a few passes on the
edge list, and renders the community structures using a widely used ForceAtlas2 algorithm. The coarse layout
generation process of BigGraphVis is 70 to 95 percent faster than computing a GPU-accelerated ForceAtlas2
layout of the whole graph. Our experimental results show that BigGraphVis can produce meaningful layouts,
and thus opens up future opportunities to design streaming algorithms that achieve a significant computational
speed up for massive networks by carefully trading off the layout quality.
1 INTRODUCTION
Graph visualization has been one of the most useful
tools for studying complex relational data. A widely
used algorithm for computing a graph layout is force-
directed layout (Kobourov, 2012), where forces on
the nodes and edges are defined in a way such that
in an equilibrium state, the distances between pairs
of nodes become proportional to their graph-theoretic
distances. As a result, such layouts can reveal dense
subgraphs or communities in a graph. Here, a com-
munity is considered as a subgraph where nodes have
more edges with each other than with the rest of the
nodes in the graph. Constructing meaningful visual-
izations for big graphs (with millions of nodes and
edges) is challenging due to the long computing time,
memory requirements and display limitations. To
cope with the enormous number of nodes and edges,
researchers often first detect the communities in the
graph and then visualize a smaller coarse graph (Wal-
shaw, 2000; Hachul and J
¨
unger, 2004; Riondato et al.,
2017), where communities are merged into supern-
odes. Other approaches include layout computation
a
https://orcid.org/0000-0001-6689-4711
b
https://orcid.org/0000-0002-7370-8697
based on distributed architecture (Perrot and Auber,
2018) or GPUs (Brinkmann et al., 2017), computa-
tion of graph thumbnails (Yoghourdjian et al., 2018),
interactive filtering by approximating the node rank-
ing (Huang and Huang, 2018; Nachmanson et al.,
2015; Mondal and Nachmanson, 2018), or retrieval of
a pre-computed visualization based on machine learn-
ing (Kwon et al., 2018).
This paper focuses on visualizing a supergraph
(Fig. 1), i.e., a coarse or compressed graph com-
puted from a large graph. We can construct such
a compressed graph in various ways (Von Landes-
berger et al., 2011; Abello et al., 2006; Hu et al.,
2010). For example, one can examine a sampled or
filtered graph (Leskovec and Faloutsos, 2006), or ex-
amine only the densest subgraph (Gallo et al., 1989)
(a vertex-induced subgraph with the maximum aver-
age degree), or several dense subgraphs (communi-
ties) of the original graph (Gibson et al., 2005; New-
man, 2004). Sometimes nodes and edges are aggre-
gated (Elmqvist et al., 2008) (merged into some su-
pernodes) based on node clusters or attributes. Since
a supergraph retains major relational structures of
the original graph, the hope is that the visualization
might reveal the crucial relations between communi-
ties. Most algorithms for computing a supergraph run
Moradi, E. and Mondal, D.
BigGraphVis: Visualizing Communities in Big Graphs Leveraging GPU-Accelerated Streaming Algorithms.
DOI: 10.5220/0011783700003417
In Proceedings of the 18th International Joint Conference on Computer Vision, Imaging and Computer Graphics Theory and Applications (VISIGRAPP 2023) - Volume 3: IVAPP, pages
195-202
ISBN: 978-989-758-634-7; ISSN: 2184-4321
Copyright
c
2023 by SCITEPRESS – Science and Technology Publications, Lda. Under CC license (CC BY-NC-ND 4.0)
195

Figure 1: Different layouts computed for a graph (web-BerkStan (Leskovec and Krevl, 2014a)): (left) A layout produced
by the traditional ForceAtlas2 algorithm. (middle) The graph layout produced by our approach — BigGraphVis, where the
communities are shown with colored nodes of varying radii based on the community sizes. (right) The ForceAtlas2 layout,
where nodes are colored by the color assignment computed through BigGraphVis community detection. A qualitative color
scale is used to provide an idea of the node size distribution and to illustrate a detailed mapping of the nodes between
BigGraphVis and ForceAtlas2 visualizations.
in linear time on the number of vertices and edges of
the graph. However, even linear-time algorithms turn
out to be slow for big graphs if the constant factor hid-
den in the asymptotic notation is large. A bold idea in
such a scenario is to design a parallel streaming al-
gorithm that processes the edge list in one pass, takes
only a few operations to process each edge, and ren-
ders the graph as soon as it finishes reading the edge
list. Note that the graph does not need to be tempo-
ral or streamed, one can read the graph from exter-
nal or local memory. The idea of a parallel stream-
ing algorithm is to limit the number of passes the in-
put elements are being looked at. To achieve high
computational speed, realizing such an approach for
big graphs would require streaming edges in parallel.
Such streaming algorithms naturally come with sev-
eral benefits, e.g., fast computing and limited mem-
ory requirement, and with a cost of losing quality.
However, to the best of our knowledge, no such one-
pass parallel algorithm for big graph visualization is
known to date.
Understanding whether we can effectively visual-
ize big graphs in a streaming or one-pass model pre-
dominantly relies on our knowledge of whether we
can extract a meaningful structure in such a model.
In this paper we take a first step towards achieving
the goal by bringing the streaming community de-
tection into the scene, which allows us to create an
edge-weighted supergraph by merging the detected
communities into single nodes (i.e., supernodes). We
then visualize the supergraph using the known graph
layout algorithm. Although visualizing a supergraph
is not a new idea (e.g., see (Batagelj et al., 2010;
Batagelj et al., 2010; Abello et al., 2006)), integrating
streaming community detection for big graph visual-
ization is a novel approach and brings several natural
and intriguing questions: How fast can we produce
a supergraph visualization using streaming commu-
nity detection? Is there a reasonable GPU-processing
pipeline? Do we lose the quality significantly us-
ing streaming community detection, when compared
with the traditional force-based visualization algo-
rithms (Jacomy et al., 2014)? Can we meaningfully
stylize traditional graph layouts by coloring the com-
munities without increasing the time overhead?
To keep the whole pipeline of community detec-
tion, graph aggregation, and visual rendering mean-
ingful and fast (in a few minutes), we propose Big-
GraphVis, which is a GPU-accelerated pipeline that
seamlessly integrates streaming community detection
and visual rendering. The availability of an increased
number of computer processing units and GPUs with
hundreds of cores have inspired researchers to imple-
ment force-based visualization algorithms that lever-
age these computing technologies (Frishman and Tal,
2007; Brinkmann et al., 2017). Although GPUs
can allow massive parallelization via a high num-
ber of cores and low-cost task dispatching, they are
structured processing units that suit structured data
like matrices (Shi et al., 2018; Frishman and Tal,
2007). Hence, designing parallel graph processing al-
gorithms often turns out to be challenging, especially
for graphs (Moradi et al., 2015). Integrating stream-
ing community detection and force-based visualiza-
tion algorithms becomes even more challenging since
the supergraph between these two processes needs to
be handled with care retaining as much quality as pos-
sible.
Our Contribution. Our first contribution is to adapt
streaming community detection algorithms to visu-
alize communities in a graph and to examine the
trade-offs between speed and layout quality. We
IVAPP 2023 - 14th International Conference on Information Visualization Theory and Applications
196

propose a pipeline BigGraphVis that combines the
idea of GPU-powered parallel streaming community
detection and probabilistic data structures to com-
pute and visualize supergraphs, which can be com-
puted 70 to 95 times faster than computing a layout
of the whole graph using GPU-accelerated ForceAt-
las2 (Brinkmann et al., 2017). This can potentially
be useful in time-sensitive applications if the qual-
ity of the detected communities in the coarse layout
is reasonable when compared with the layout of the
whole graph. Although BigGraphVis trades off the
layout resolution (the amount of details to be visu-
alized) to achieve such high speed, we indicate (by
comparing with the ForceAtlas2 outputs) that it can
still detect large communities in the graph. Thus, Big-
GraphVis creates a stronghold for exploring the op-
portunity for designing one-pass graph drawing algo-
rithms in the future. Note that one-pass community
detection algorithms are several orders of magnitude
faster than GPU-accelerated community detection al-
gorithms (Hollocou et al., 2017). Thus, any pipeline
based on a typical GPU-accelerated community de-
tection (e.g., Louvain, Walktrap, etc.) followed by a
force-directed layout algorithm is much slower than
BigGraphVis.
We observe that the relative community sizes in a
ForceAtlas2 visualization may sometimes be difficult
to interpret. Since the size of a community is deter-
mined by a complex force simulation, communities
that are visually similar regarding to the space they
occupy, demonstrate different behaviors: One may
contain a large number of nodes but fewer edges, and
the other may contain many edges but fewer nodes.
A community with a high average degree with fewer
nodes may take a significantly large space (due to
node repulsion) than another community with numer-
ous nodes but fewer edges. Therefore, when we em-
ploy the community detection algorithm, we maintain
an approximate size (number of edges) for each com-
munity, and the supernodes are drawn with circles of
various radii based on the community sizes. We pro-
vide empirical evidence that BigGraphVis can reveal
communities of good quality, which is crucial for lay-
out interpretation.
Our second contribution is to leverage GPUs to
parallelize streaming community detection and prob-
abilistic data structures to fast approximate commu-
nity sizes to be used by the force layout algorithms.
To compute the supergraph, we first detect commu-
nities and then merge each of them into a supernode.
Since community detection algorithms take a consid-
erable amount of time, we adopt a streaming com-
munity detection algorithm (SCoDA (Hollocou et al.,
2017)) that finds the communities in linear time by
going over the edges in one pass. To accelerate the
procedure, we propose a GPU-accelerated version of
SCoDA that allows for hierarchical community detec-
tion.
We use GPUs to manage millions of threads that
keep the speed of the whole process. However, com-
puting a supergraph using community detection is
challenging in a parallel environment, since we need
to compute each community’s size (i.e., the number
of edges). However, counting is an atomic opera-
tion, which means that if we want to count the com-
munities’ sizes in parallel, each thread assigned to a
community should examine the whole network. We
indicate how one can use a probabilistic data struc-
ture count-min sketch (Cormode and Muthukrishnan,
2005) to approximately compute the size of each
community in parallel to be used in the subsequent
force layout algorithm.
2 TECHNICAL BACKGROUND
Here we describe the building blocks that will be
leveraged to implement BigGraphVis.
ForceAtlas2. We were inspired to choose ForceAt-
las2 due to its capability and popularity (Bastian
et al., 2009) for producing aesthetic layout for large
graphs (Jacomy et al., 2014), and also its speed when
implemented via GPU (Brinkmann et al., 2017). The
first step of ForceAtlas2 is reading the edge list and
putting each node in a random position. After the
initialization step, it calculates several variables, as
follows: A gravity force that keeps all nodes in-
side the drawing space (we distribute nodes among
threads). An attractive force to attract the neigh-
bor nodes (edges are distributed among threads and
atomic operations are used to avoid race conditions).
A body repulsion force to move nodes that are not re-
lated further apart from each other. A variable that
controls the node displacements at each iteration. A
‘swinging’ strategy to optimize the convergence (cal-
culate different update speeds for different nodes).
The algorithm displaces the nodes based on the forces
and the update speed. The forces are updated over a
number of iterations for better convergence.
SCoDA. To attain fast speed, BigGraphVis uses a par-
allel streaming algorithm for community detection. A
streaming algorithm takes a sequence of edges as in-
put and produces the output by examining them in
just one or a few passes. A streaming algorithm is
not necessarily for real-time streaming data, but any
graph can be read as a list of edges. SCoDA, pro-
posed by Hollocou et al. (Hollocou et al., 2017), is a
streaming community detection algorithm, which was
BigGraphVis: Visualizing Communities in Big Graphs Leveraging GPU-Accelerated Streaming Algorithms
197

implemented using sequential processing. SCoDA
is based on the key observation that a random edge
picked is highly likely to be an intra-community edge
(i.e., an edge connecting two nodes in the same com-
munity) rather than an inter-community edge (i.e.,
an edge between two different communities). Let
e(C,C) and e(C,C) be the intra and inter-community
edges of a community C, respectively. Assume that
e(C) = e(C,C) + e(C,C). Then if we draw k edges
from e(C), then the probability that they are all intra-
community edges of C is as follows.
P[intra
k
(C)] =
k−1
∏
l=0
|e(C,C)| − l
|e(C)| − l
=
k−1
∏
l=0
(1 − φ
l
(C)),
where φ
l
(C) =
|e(C,C)|
2|e(C,C)|+|e(C,C)|−l
. For a well-defined
community, φ
l
(C) will be small. Therefore, as long
as k is small, the chance for picking edges within the
community C is large. The algorithm starts with all
nodes having degree 0 and a degree threshold. It then
updates the node degrees as it examines new edges.
For every edge, if both its vertices are of degree less
than D, then the vertex with a smaller degree joins the
community of the vertex with a larger degree. Other-
wise, the edge is skipped. The degree threshold en-
sures that only the first few edges of each community
are being considered for forming the communities.
Count-Min Sketch. BigGraphVis computes a super-
graph based on the detected communities. We present
the communities as ‘supernodes’ with weights corre-
sponding to their number of edges. However, comput-
ing frequencies (community sizes) is highly costly for
a parallel algorithm (each thread needs to go through
the whole data, which is not efficient). The commonly
used method will be an atomic operation, which is
very time-consuming for big graphs. Therefore, we
exploit an approximate method, which is reasonable
since we are interested in presenting supergraphs and
thus can avoid computing finer details. A simple so-
lution is to use a hash table to map the data to their
occurrences. However, for big graphs, to get a good
approximation with this method, one needs to allo-
cate a massive space in the memory. Hence we use
a data structure named count-min sketch (Cormode
and Muthukrishnan, 2005), which can keep the oc-
currences in a limited space with a better guarantee
on solution quality.
The count-min sketch algorithm maintains an r ×c
matrix M, where r, c are determined based on the tol-
erance for error. Each row is assigned a hash function,
and the columns keep an approximate count deter-
mined by that hash function. To count the frequency
of events, for each event j and for each row i, the en-
try M[i, hash
i
( j)] is increased by 1, where hash
i
(·) is
the hash function associated to the ith row. The value
min
1≤i≤r
M[i, hash
i
( j)] determines the number of oc-
currences of j. Having more pairwise independent
hash functions ensures less collision and thus pro-
vides more accurate results. Since the hash functions
are independent of each other, this naturally allows
for parallel processing.
3 ALGORITHM OVERVIEW
The proposed algorithm reads an edge list stream as
the input. We then detect the communities based on a
GPU-accelerated version of SCoDA, as follows.
Modified and GPU-Accelerated SCoDA. Although
SCoDA processes each edge once with two compar-
isons, we need to deal with graphs with millions of
edges. Consequently, we design a GPU-accelerated
version of the SCoDA, where we read the edges in
parallel and use atomic operations for the degree up-
date. We run SCoDA in multiple rounds such that the
communities converge and the number of communi-
ties becomes small. This can also be seen as hier-
archical community detection. The pseudocode for
this process is illustrated in Algorithm 1 (lines 8–22).
At the end of the first round, some communities are
detected, but the number of detected communities is
very large. Furthermore, the degree of each node is
at most the initial degree threshold. In the subsequent
rounds, communities with large average degrees ab-
sorb the smaller ones. However, due to the increase
in node degrees, a bigger threshold is needed. There-
fore, we increase the degree threshold at each round
by a multiplicative factor. One can choose a factor for
the threshold based on the nature of the graph.
Leveraging Count-Min Sketch to Approximate
Community Sizes. After SCoDA, we compute a su-
pergraph that represents the communities as supern-
odes, where each node is weighted proportional to
the number of edges it contains. Although one can
calculate the community sizes in the community de-
tection process, it would require adding more atomic
counters and significantly slow down the computa-
tion. Hence we leveraged count-min sketch.
We took the sum of the vertex degrees (equiv-
alently, twice the number of edges) within a com-
munity as the weight of the corresponding supern-
ode. To compute this, for each node v, we increment
M[i, hash
i
(com(v))] by the degree of v, where 1 ≤ i ≤
r, com(·) is the community number, and hash
i
(·) is
the hash function associated to the ith row. The value
min
1≤i≤r
M[i, hash
i
(com(v))] determines the approxi-
mate size for com(v).
IVAPP 2023 - 14th International Conference on Information Visualization Theory and Applications
198

Drawing the Supergraph Using GPU-Accelerated
ForceAtlas2. Finally, we leveraged the GPU-
accelerated ForceAtlas2 (Section 2) to draw the ag-
gregated nodes. When drawing a supernode, we
choose the radius proportional to the square root of
its size. For dense communities, the space occu-
pied by a supernode is thus proportional to the num-
ber of vertices that it contains. If a visualization for
the whole graph is needed (instead of a supergraph),
then we first compute a layout for the whole graph
using GPU-accelerated ForceAtlas2 and then color
the nodes based on the communities detected using
SCoDA. The details of such coloring are in Section 3.
Count-Min Sketch Parameters. The error in the
count-min sketch can be controlled by choosing the
size of the sketch matrix, i.e., the number of hash
functions and the number of columns w. For a partic-
ular hash function, the expected amount of collision
is
N
w
, where N is the total number of items and they
are mapped to {1,2, . . . , w} by the hash function. Cor-
mode and Muthukrishnan (Cormode and Muthukrish-
nan, 2005) observed that the probability of seeing a
collision of more than an expected amount is bounded
by
1
2
, and for d hash functions, the probability of hav-
ing a large error is bounded by
1
2
d
. This indicates that
a larger number of hash functions is a better choice
when accuracy is important. However, this also in-
creases the size of the count-min sketch matrix. In our
experiment, we choose the number of hash functions
to be four and the number of columns to be a fraction
10
−4
of the number of edges, which is bounded by our
available GPU memory. Choosing a larger number of
columns can further improve the count-min sketch ac-
curacy as more collisions can be avoided.
Community Detection Parameters. For stream-
ing community detection, we need to define two pa-
rameters: the degree threshold and the number of
rounds. The streaming community detection algo-
rithm is based on the idea that the probability of
intra-community edges appearing before the inter-
community edges is very high when a community
is being formed. Therefore, the degree threshold
could be very sensitive since a very small threshold
might miss some intra-community edges, which can
break communities into sub-communities (Hollocou
et al., 2017). Similarly, if the degree threshold is se-
lected too high, it may lose granularity, i.e., it can
merge too many communities into a single commu-
nity. Thus, as suggested in the original SCoDA (Hol-
locou et al., 2017), we have chosen the most common
degree (mode degree δ) in the graph as the degree
threshold. However, if the user wants to have big-
ger communities with a larger number of nodes, then
choosing a slightly bigger degree will produce such
results. In our experiment, we observed a few rounds
suffice to have a high modularity score. The modular-
ity is a metric to measure the quality of the commu-
nities (Newman, 2006). The modularity Q ranges be-
tween −0.5 and 1, where 1 denotes the highest qual-
ity. After achieving high modularity, the communi-
ties become stable, and hence choosing a big num-
ber of rounds does not affect the running time. Since
the degrees of the supernodes increases at each round,
we choose the δ
i
to be the threshold at the ith round,
where i runs from 1 to 10.
Convergence. The node positions in the ForceAt-
las2 algorithm are updated in several rounds so that
the energy of the system is minimized. To achieve
convergence, one needs to choose a large number
of iterations for big graphs. For the graphs with
millions of nodes and edges, the GPU-accelerated
ForceAtlas2 with 500 iterations showed a good per-
formance (Brinkmann et al., 2017). However, in our
method, much fewer rounds are enough since we have
a much smaller network for drawing after community
detection. We observed that for visualizing the super-
graph, 100 iterations is more than enough to obtain a
stable layout for all graphs we experimented with.
Coloring Communities. When visualizing super-
graph, we create 11 node groups and color them us-
ing a qualitative color scheme (Brewer and Harrower,
2001). Specifically, we first compute the sum α of the
sizes of all communities, then sort the communities
based on their sizes, and color the smaller communi-
ties that take 50% of α with a brown color. The rest
of the supernodes are partitioned into 10 groups and
colored using (from small to big) brown, light pur-
ple, purple, light orange, orange, light red, red, light
green, green, light blue, blue (Fig. 1). Such coloring
provides a sense of the community size distribution in
the layout.
Note that the above coloring scheme assigns a
color to each supernode. If visualization of the whole
graph is needed (instead of a supergraph), then we
color the layout of the whole graph computed by the
GPU-accelerated ForceLayout2, where each node is
drawn with the color of its corresponding supernode.
Such a compatible coloring provides us a way to ex-
amine the quality of ForceAtlas2 from the perspective
of community detection and vice versa.
4 EXPERIMENTS
For our experiments, we used an Nvidia Tesla k20c
with 5GB of VRAM. It is based on the Kepler archi-
tecture, which has 2496 CUDA cores. The compiler
that we used is a CUDA 11.0.194.
BigGraphVis: Visualizing Communities in Big Graphs Leveraging GPU-Accelerated Streaming Algorithms
199

Algorithm 1: BigGraphVis Layout.
Input: Edge list (src, dst)
1: D ← ModeDegree
2: #GPUthreads ← #edges
3: EachThread i do
4: C
i
← i, Csize
i
← 0
5: end EachThread
6: EachThread j = 1 . . . Number o f Rounds do
7: EachThread i do
8: if deg(src) ≤ D and deg(dst) ≤ D then
9: if deg(src) > deg(dst) then
10: C
dst
← C
src
11: atomic(deg(dst) + +)
12: else
13: if deg(dst) > deg(src) then
14: C
src
← C
dst
15: atomic(deg(src) + +)
16: end if
17: end if
18: end if
19: end EachThread
20: D ← multiplicative f actor
21: end EachThread
GPUdo Find community sizes Csize
i
via Count-
Min Sketch
GPUdo C
i
x,C
i
y ← FA2(Csrc,Cdst,Csize)
GPUdo Draw(C
i
,C
i
x,C
i
y,Csize
i
)
The implementation of ForceAtlas2 that we
are using is the same as that of Brinkmann et
al. (Brinkmann et al., 2017), which provides a
grayscale layout. BigGraphVis leverages commu-
nity detection to color the nodes. Furthermore, the
node repulsion in BigGraphVis considers the node
weights (i.e., supernode sizes), which provides the
space needed to draw the supernode. For a proper
comparison of the speed up, we choose the ForceAt-
las2 force parameters similar to Brinkmann et al.’s
work. Thus the gravitational and repulsive force pa-
rameters remain the same as 1 and 80 for all networks.
Note that Brinkmann et al. mentioned that tuning
these variables does not have any major influence on
the algorithm’s performance. The source code of our
implementation is available as a GitHub repository
1
.
Data. We choose multiple real-world datasets for our
work (Leskovec and Krevl, 2014b). Whereas most of
these graphs have millions of edges, they also have
millions of nodes. Hence to examine dense graphs,
we choose a graph Bio, created from bio-mouse-gene
network (Rossi and Ahmed, 2015), and another graph
called Authors. The Authors graph is created by tak-
ing authors of 15 journals as nodes, where an edge
1
https://github.com/Ehsan486/GraphVis
represents that the corresponding authors published in
the same journal (Tang et al., 2008).
Running Time. Table 1 compares the running
time of BigGraphVis (visualizing supergraph) and
GPU-accelerated ForceAtlas2 (visualizing the whole
graph). For BigGraphVis, we report both the run-
ning time (in milliseconds) and the size of the su-
pergraph (number of supernodes or communities de-
tected), whereas for GPU-accelerated ForceAtlas2,
we report the running time. We also compute the
speedup in percentage for all the networks, which
ranges between 70 to 95. The results are repeated 20
times to see if there is any difference in speedup; and
the least speedup is reported. Table 1 also reports sep-
arately the time taken by BigGraphVis to detect the
communities using 10 rounds. This is to provide an
idea of time required to stylize a ForceAtlas2 visual-
ization using a color mapping based on community
sizes. We noticed that for all graphs this overhead is
only a few seconds. For all our graphs, the outputs
were seen to converge in 3 rounds, which indicates
that the number of rounds could be lowered to achieve
yet a smaller overhead.
Quantity Measure (Modularity). We examined
modularity of the detected communities. For five of
the 10 graphs, the modularity scores were very high
(above 0.7 and upto 0.9), and for none of them was
below 0.55. This indicates reliable detection of the
communities.
Visual Comparison. We now visually examine
the ForceAtlas2 and BigGraphVis layouts on various
datasets. Fig. 2 illustrates three layouts for github,
eu-2005, web-BerkStan and soc-LiveJournal graphs
: (left) GPU-accelerated ForceAtlas2, (middle) Big-
GraphVis supergraph, and (right) ForceAtlas2 layout
colored by BigGraphVis. It is noticeable that Big-
GraphVis were able to reveal big communities. One
can access the members of each community using the
dataset created at hierarchical community detection
rounds. ForceAtlas2 layouts, which are colored by
BigGraphVis, take more time but show a higher level
of detail. However, the community sizes seen in a
ForceAtlas2 output may not always show their true
sizes (i.e., the number of nodes or edges are not clear).
On the other hand, the BigGraphVis supergraph can
provide us with a quick understanding of the number
of big communities in a graph and some idea of their
relative sizes. Although true communities for these
graphs are either unknown or not well-defined, for the
graph Authors Fig. 3, we know the authors are from
15 journals. Both the BigGraphVis supergraph and
the ForceAtlas2 output colored by BigGraphVis, re-
veal about 15 big visual blobs. This provides an indi-
cation that even in cases when the streaming commu-
IVAPP 2023 - 14th International Conference on Information Visualization Theory and Applications
200
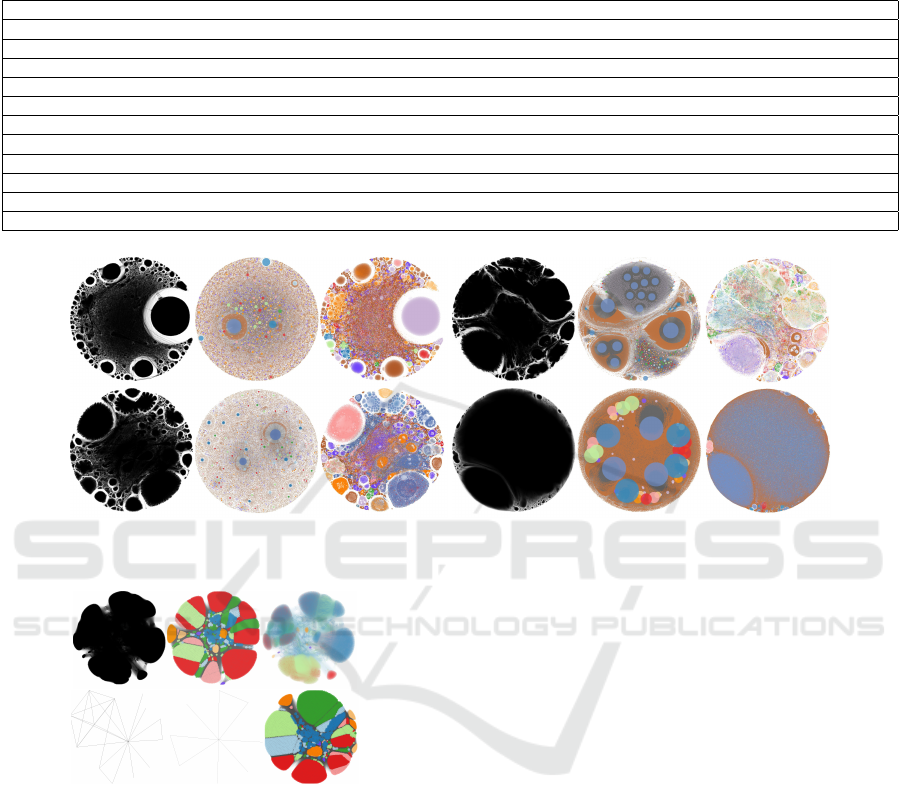
Table 1: BigGraphVis speed up when compared with GPU-accelerated ForceAtlas2 (time is in milliseconds). DT, SS, SN,
SE, M are the degree threshold, sketch size, super nodes, super edges, and modularity, respectively. SG time is the time to
compute supergraph. BGV time is the total time taken by BigGraphVis.
Network Name Nodes Edges DT SS SN SE FA2 time BGV Time SG Time Speedup M
Wiki-Talk 2.39M 5.02M 5 5K 112K 122K 400K 28K 3854 92 0.64
bio-mouse-gene 45101 14506195 5 14500 193 196 50016 8937 7941 82 0.88
as-Skitter 1696414 11095298 7 11000 136597 300779 350141 58750 7128 83 0.55
web-flickr 105938 2316948 43 2000 1094 26170 25251 3280 1497 87 0.61
github 1471422 13045696 11 13000 71166 91345 181538 17519 9115 90 0.90
com-Youtube 1157827 2987624 4 3000 211192 232266 233915 43666 2198 81 0.73
eu-2005 333377 4676079 15 4500 9181 20263 52268 5145 2827 90 0.66
web-Google 916427 5105039 11 5000 75443 125287 131792 13863 3415 89 0.80
web-BerkStan 685230 6649470 11 6500 31213 57382 138000 6565 4566 95 0.81
soc-LiveJournal 3997962 34681189 17 34500 248188 566160 3862325 315072 21344 91 0.62
Authors 12463 10305446 2 10000 4315 1398089 146443 42541 6382 70 0.62
Figure 2: ForceAtlas2 layout, BigGraphVis layout and stylized ForceAtlas2 layout for four graphs: (top-left) github, (top-
right) eu-2005, (bottom-left) web-BerkStan and (bottom-right) soc-LiveJournal.
Figure 3: (top) Visualization for the graph — Authors. (bot-
tom) Illustration for the effect of different rounds of com-
munity detection.
nity detection may be a coarse approximation, Big-
GraphVis can produce a meaningful layout since it
employs ForceAtlas2 to visualize the supergraph.
5 CONCLUSION
In this paper, we propose BigGraphVis that visual-
izes communities in big graphs leveraging streaming
community detection and GPU computing. Our com-
puting pipeline uses probabilistic data structures to
produce a coarse layout of the graph that is fast, yet
can reveal major communities. Through a detailed
experiment with the real-world graphs (the biggest
graph, soc-LiveJournal, had about 34 million edges),
we observed that BigGraphVis can produce a mean-
ingful coarse layout within a few minutes (about five
minutes for soc-LiveJournal). We also showed how
the graph summary produced by BigGraphVis can be
used to color ForceAtlas2 output to reveal meaningful
graph structure for the whole graph. Exploring user
interactions while visualizing graphs from streamed
edges would be an interesting directions for future
work. We believe that our work will inspire future re-
search on leveraging streaming algorithms and GPU
computing to visualize massive graphs.
ACKNOWLEDGEMENTS
The research is supported in part by the Natural Sci-
ences and Engineering Research Council of Canada
(NSERC), and by a Research Junction Grant with the
University of Saskatoon and the Saskatoon Transit di-
vision of the City of Saskatoon.
BigGraphVis: Visualizing Communities in Big Graphs Leveraging GPU-Accelerated Streaming Algorithms
201

REFERENCES
Abello, J., van Ham, F., and Krishnan, N. (2006). Ask-
graphview: A large scale graph visualization system.
IEEE Trans. Vis. Comput. Graph., 12(5):669–676.
Bastian, M., Heymann, S., and Jacomy, M. (2009). Gephi:
An open source software for exploring and manipulat-
ing networks. In Proc. of the Int. AAAI Conf. on Web
and Social Media, volume 3.
Batagelj, V., Didimo, W., Liotta, G., Palladino, P., and Pa-
trignani, M. (2010). Visual analysis of large graphs
using (X, Y)-clustering and hybrid visualizations. In
IEEE Pacific Visualization Symposium, pages 209–
216.
Brewer, C. and Harrower, M. (2001). Colorbrewer 2.0.
https://colorbrewer2.org/.
Brinkmann, G. G., Rietveld, K. F., and Takes, F. W. (2017).
Exploiting GPUs for fast force-directed visualization
of large-scale networks. In 2017 46th Int. Conf. on
Parallel Processing (ICPP), pages 382–391. IEEE.
Cormode, G. and Muthukrishnan, S. (2005). An improved
data stream summary: the count-min sketch and its
applications. Journal of Algorithms, 55(1):58–75.
Elmqvist, N., Do, T.-N., Goodell, H., Henry, N., and Fekete,
J.-D. (2008). Zame: Interactive large-scale graph vi-
sualization. In 2008 IEEE Pacific visualization Symp.,
pages 215–222. IEEE.
Frishman, Y. and Tal, A. (2007). Multi-level graph layout
on the GPU. IEEE Transactions on Visualization and
Computer Graphics, 13(6):1310–1319.
Gallo, G., Grigoriadis, M. D., and Tarjan, R. E. (1989). A
fast parametric maximum flow algorithm and applica-
tions. SIAM Journal on Computing, 18(1):30–55.
Gibson, D., Kumar, R., and Tomkins, A. (2005). Discover-
ing large dense subgraphs in massive graphs. In Int.
Conf. on Very large data bases, pages 721–732. Cite-
seer.
Hachul, S. and J
¨
unger, M. (2004). Drawing large graphs
with a potential-field-based multilevel algorithm. In
Graph Drawing, pages 285–295. Springer.
Hollocou, A., Maudet, J., Bonald, T., and Lelarge, M.
(2017). A linear streaming algorithm for commu-
nity detection in very large networks. arXiv preprint
arXiv:1703.02955.
Hu, Y., Gansner, E. R., and Kobourov, S. G. (2010). Visu-
alizing graphs and clusters as maps. IEEE Computer
Graphics and Applications, 30(6):54–66.
Huang, X. and Huang, C. (2018). NGD: filtering graphs for
visual analysis. IEEE Trans. Big Data, 4(3):381–395.
Jacomy, M., Venturini, T., Heymann, S., and Bastian, M.
(2014). Forceatlas2, a continuous graph layout algo-
rithm for handy network visualization designed for the
gephi software. PloS one, 9(6):e98679.
Kobourov, S. G. (2012). Spring embedders and force
directed graph drawing algorithms. arXiv preprint
arXiv:1201.3011.
Kwon, O., Crnovrsanin, T., and Ma, K. (2018). What would
a graph look like in this layout? A machine learning
approach to large graph visualization. IEEE Trans.
Vis. Comput. Graph., 24(1):478–488.
Leskovec, J. and Faloutsos, C. (2006). Sampling from large
graphs. In ACM SIGKDD Int. Conf. on Knowledge
discovery and data mining, pages 631–636.
Leskovec, J. and Krevl, A. (2014a). Snap datasets: Stanford
large network dataset collection.
Leskovec, J. and Krevl, A. (2014b). SNAP Datasets: Stan-
ford large network dataset collection. http://snap.
stanford.edu/data.
Mondal, D. and Nachmanson, L. (2018). A new approach to
GraphMaps, a system browsing large graphs as inter-
active maps. In Proceedings of the 13th International
Joint Conference on Computer Vision, Imaging and
Computer Graphics Theory and Applications (VISI-
GRAPP), pages 108–119. SciTePress.
Moradi, E., Fazlali, M., and Malazi, H. T. (2015). Fast par-
allel community detection algorithm based on modu-
larity. In Int. Symp. on Comp. Architecture and Digital
Systems (CADS), pages 1–4. IEEE.
Nachmanson, L., Prutkin, R., Lee, B., Riche, N. H., Hol-
royd, A. E., and Chen, X. (2015). Graphmaps: Brows-
ing large graphs as interactive maps. In Graph Draw-
ing and Network Visualization (GD), volume 9411 of
LNCS, pages 3–15. Springer.
Newman, M. E. (2004). Fast algorithm for detecting com-
munity structure in networks. Physical review E,
69(6):066133.
Newman, M. E. (2006). Modularity and community struc-
ture in networks. Proc. of the national academy of
sciences, 103(23):8577–8582.
Perrot, A. and Auber, D. (2018). Cornac: Tackling huge
graph visualization with big data infrastructure. IEEE
Transactions on Big Data, 6(1):80–92.
Riondato, M., Garc
´
ıa-Soriano, D., and Bonchi, F. (2017).
Graph summarization with quality guarantees. Data
mining and knowledge discovery, 31(2):314–349.
Rossi, R. A. and Ahmed, N. K. (2015). The network data
repository with interactive graph analytics and visual-
ization. In AAAI Conf. on Artificial Intelligence, pages
4292–4293.
Shi, X., Zheng, Z., Zhou, Y., Jin, H., He, L., Liu, B., and
Hua, Q.-S. (2018). Graph processing on GPUs: A
survey. ACM Computing Surveys, 50(6):1–35.
Tang, J., Zhang, J., Yao, L., Li, J., Zhang, L., and Su, Z.
(2008). Arnetminer: extraction and mining of aca-
demic social networks. In ACM SIGKDD Int. Conf.
on Knowledge discovery and data mining, pages 990–
998.
Von Landesberger, T., Kuijper, A., Schreck, T., Kohlham-
mer, J., van Wijk, J. J., Fekete, J.-D., and Fellner,
D. W. (2011). Visual analysis of large graphs: state-
of-the-art and future research challenges. In Computer
graphics forum, volume 30, pages 1719–1749. Wiley
Online Library.
Walshaw, C. (2000). A multilevel algorithm for force-
directed graph drawing. In Graph Drawing, pages
171–182. Springer.
Yoghourdjian, V., Dwyer, T., Klein, K., Marriott, K., and
Wybrow, M. (2018). Graph thumbnails: Identifying
and comparing multiple graphs at a glance. IEEE
Trans. Vis. Comput. Graph., 24(12):3081–3095.
IVAPP 2023 - 14th International Conference on Information Visualization Theory and Applications
202
