
Hallucinated Heartbeats: Anomaly-Aware Remote Pulse Estimation
Jeremy Speth, Nathan Vance, Benjamin Sporrer, Lu Niu, Patrick Flynn and Adam Czajka
Computer Vision Research Laboratory, University of Notre Dame, Notre Dame, U.S.A.
Keywords:
Anomaly Detection, Camera-Based Vitals, Deep Learning, Remote Photoplethysmography (rPPG).
Abstract:
Camera-based physiological monitoring, especially remote photoplethysmography (rPPG), is a promising tool
for health diagnostics, and state-of-the-art pulse estimators have shown impressive performance on benchmark
datasets. We argue that evaluations of modern solutions may be incomplete, as we uncover failure cases for
videos without a live person, or in the presence of severe noise. We demonstrate that spatiotemporal deep
learning models trained only with live samples “hallucinate” a genuine-shaped pulse on anomalous and noisy
videos, which may have negative consequences when rPPG models are used by medical personnel. To address
this, we offer: (a) An anomaly detection model, built on top of the predicted waveforms. We compare models
trained in open-set (unknown abnormal predictions) and closed-set (abnormal predictions known when train-
ing) settings; (b) An anomaly-aware training regime that penalizes the model for predicting periodic signals
from anomalous videos. Extensive experimentation with eight research datasets (rPPG-specific: DDPM, CD-
DPM, PURE, UBFC, ARPM; deep fakes: DFDC; face presentation attack detection: HKBU-MARs; rPPG
outlier: KITTI) show better accuracy of anomaly detection for deep learning models incorporating the pro-
posed training (75.8%), compared to models trained regularly (73.7%) and to hand-crafted rPPG methods
(52-62%).
1 INTRODUCTION
Remote vitals estimation is a growing field aiming to
measure physiological signals from a camera. Per-
haps the two most commonly estimated vitals are res-
piration rate and pulse rate, where algorithms pre-
dict a periodic waveform from a video. Several al-
gorithms for estimating the blood volume pulse with
remote photoplethysmography (rPPG) are robust to
movement and even give error rates within FDA-
approvable bounds on benchmark datasets (Chen and
McDuff, 2018; Speth et al., 2021a).
While current estimators predict the correct signal
if one exists, it is unclear if they are selective when
there is no genuine pulse signal in the input. For in-
stance: does the model generate a “flatline” signal if
no heartbeat exists in the video? Or does it generate
a genuine-looking pulse waveform, hence giving im-
proper feedback to the user (e.g. medical practitioner)
if the system is failing? These considerations gener-
ate four research questions which we address in this
paper:
• (Q1): What do state-of-the-art rPPG models pre-
dict when a live subject is not in the video, or the
pulse signal is too weak?
• (Q2): Can we build anomaly detection of abnor-
mal pulse waveforms into existing deep learning
rPPG estimators?
• (Q3): Can we train anomaly-aware rPPG mod-
els to reflect input signal quality in their predicted
waveforms?
• (Q4): If the answer to Q3 is affirmative, how does
anomaly-awareness affect performance of pulse
rate estimation applied to genuine videos?
To answer the above questions we first show that
state-of-the-art rPPG models (including deep learning
approaches) are incapable of alerting the user of ab-
normalities in the predicted pulse waveform (re: Q1).
We then train binary classifiers to predict whether an
input is anomalous from estimated waveform features
on live videos and pulseless artificial videos. We also
train one-class classifiers on waveform features from
genuine videos to prepare the model for unseen data
(re: Q2). Next, we introduce various spectral reg-
ularization terms while training deep learning-based
rPPG models that encourage a flat spectrum when the
input videos do not contain a pulse signal (re: Q3).
Finally, we evaluate the proposed approaches on set-
106
Speth, J., Vance, N., Sporrer, B., Niu, L., Flynn, P. and Czajka, A.
Hallucinated Heartbeats: Anomaly-Aware Remote Pulse Estimation.
DOI: 10.5220/0011781700003414
In Proceedings of the 16th International Joint Conference on Biomedical Engineering Systems and Technologies (BIOSTEC 2023) - Volume 4: BIOSIGNALS, pages 106-117
ISBN: 978-989-758-631-6; ISSN: 2184-4305
Copyright
c
2023 by SCITEPRESS – Science and Technology Publications, Lda. Under CC license (CC BY-NC-ND 4.0)
Replicated
image
with added
noise
Heavily
compressed
Out of set
(no face)
Genuine video
Anomalous videos
Predictions of
anomaly-unaware model
Predictions of
anomaly-aware models
(spectral flatness loss)
(standard deviation loss)
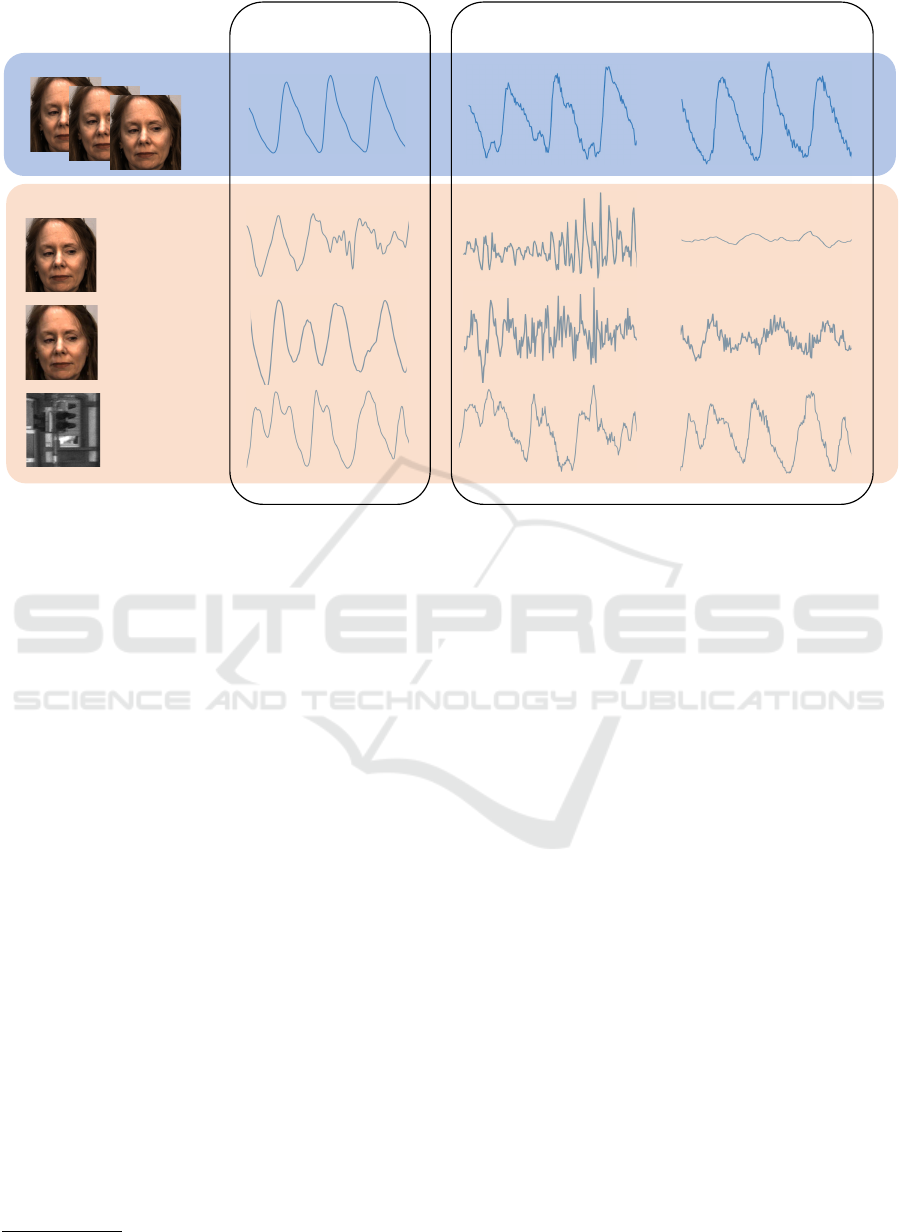
Figure 1: Given the black-box nature of modern, usually deep learning-based rPPG systems, can we trust that these models
estimate correct waveforms for genuine inputs, and alert the examiner when abnormal samples are processed? Surprisingly,
state-of-the-art solutions are able to “hallucinate” a realistically-looking pulse waveform from anomalous video that does not
contain a human subject (bottom left examples). To facilitate trustworthy vitals measurement, we propose anomaly-aware
rPPG models that generate correct waveforms only for living individuals, and output low-quality, easy-to-detect signals for
out-of-set samples. For real faces (top row examples), the predicted signals are evaluated by comparing to ground truth
collected from a fingertip pulse oximeter. Different training strategies, such as requesting flat spectrum (bottom middle
examples) or low standard deviation (bottom right examples) of the predicted waveforms for out-of-set samples, along with
closed- and open-set classifiers to easily detect “hallucinated” samples are also proposed.
tings where the pulse is noisy or nonexistent, such
as face presentation attacks, DeepFakes, compressed
videos, rPPG attacks, and dynamic scenes (not con-
taining faces at all) (re: Q4).
We believe this work contributes to building trust-
worthy rPPG systems. The proposed models react
better to unknown, noisy, and out-of-set signals by
either alerting about abnormality or producing rPPG
signals only for genuine inputs. To facilitate repro-
ducibility and future research, we are releasing the
source codes of the designed methods
1
.
2 RELATED WORK
2.1 Remote Photoplethysmography
Remote Photoplethysmography (rPPG) is a technique
for non-contact estimation of the blood volume pulse
from reflected light. As the blood volume in mi-
crovasculature changes with each heart beat, the dif-
1
https://github.com/CVRL/Anomaly-Aware-rPPG
fuse reflection changes due to the strong light absorp-
tion of hemoglobin. The observable changes are very
subtle even in modern camera sensors, and we sus-
pect they are “sub-pixel” (McDuff, 2021). Initial ap-
proaches utilized only the green channel (Verkruysse
et al., 2008). Color transformation approaches (De
Haan and Jeanne, 2013; De Haan and Van Leest,
2014; Wang et al., 2017; Wang et al., 2019) are still
used as strong baselines due to their robustness and
cross-dataset performance.
Some deep learning approaches regress the pulse
rate directly without a waveform. Niu et al. (Niu
et al., 2018; Niu et al., 2020) passed spatial-temporal
maps to ResNet-18, followed by a gated recurrent unit
to predict the pulse rate. While the model is accu-
rate on benchmark datasets, it lacks any measure of
confidence, and may produce a feasible pulse rate on
anomalous inputs without feedback to the user.
The most common deep learning approaches
regress the pulse waveform values over a video (Chen
and McDuff, 2018; Yu et al., 2019; Liu et al., 2020b;
Lee et al., 2020; Lu et al., 2021; Speth et al., 2021a;
Zhao et al., 2021; Yu et al., 2022). Several ap-
Hallucinated Heartbeats: Anomaly-Aware Remote Pulse Estimation
107

proaches use frame differences to estimate the wave-
form derivative (Chen and McDuff, 2018; Liu et al.,
2020b; Zhao et al., 2021), which has the benefit
of only requiring spatial models. Many other ap-
proaches leverage spatiotemporal features, and can
process video clips end-to-end (Yu et al., 2019; Lee
et al., 2020; Lu et al., 2021; Speth et al., 2021a; Yu
et al., 2022). There are numerous advantages to pro-
ducing a full waveform, including the ability to ex-
tract unique cardiac features such as atrial fibrilla-
tion (Liu et al., 2022; Wu et al., 2022), and the ability
to estimate noise as a proxy for model confidence.
2.2 Deep Anomaly Detection
This paper relates closely to anomaly detection by
training with generated (Lee et al., 2018) or anoma-
lous (Hendrycks et al., 2019) inputs. Lee et al. (Lee
et al., 2018) use a generative adversarial network to
sample inputs near the data distributions boundary,
then penalize high confidence on generated samples.
Hendrycks et al. (Hendrycks et al., 2019) studied
outlier exposure, where an entire out-of-distribution
(OOD) dataset is introduced to the model during
training. They use cross-entropy loss with the uni-
form distribution over classes as the target for OOD
samples. Our approach encourages a uniform dis-
tribution over the frequency domain of the estimated
pulse waveform. We find it trivial to create anomalous
samples that are spatially similar to the training data
distribution, and we only use simple transformations
to the original video dataset. This, to our knowledge,
has never been explored in the rPPG context.
3 MOTIVATION
As rPPG systems become more common in commer-
cial products, it is important that they gracefully fail
in unexpected situations, rather than giving incorrect
vitals measurements. This paper presents a step to-
wards incorporating the rPPG signal quality into the
model’s estimate. While we focus on detecting viable
pulsatility for a global waveform, there are also sev-
eral applications for quantifying pulsatility over the
spatial dimension of a video.
For example, Wang et al. (Wang et al., 2015;
Wang et al., 2017) showed that local rPPG estima-
tion can be used for segmenting skin pixels in video
frames. Spatial measurement can also be used to mea-
sure blood perfusion in transplanted organs to verify
that sufficient volumes of blood flow are flowing to
the new tissue (Kossack et al., 2022). Another im-
pactful extension of current rPPG algorithms to the
spatial domain is blood pressure estimation via pulse
transit time (Wu et al., 2022; Iuchi et al., 2022). Al-
though current approaches manually segment regions
of interest for estimating a pulse waveform, an end-
to-end model that both segments the skin and esti-
mates the local blood volume would be valuable. All
of the aforementioned algorithms require models to
only predict the pulse where it exists, so regions with
tissue can be properly separated from the background.
4 PROBLEM DEFINITION
We first formulate the process for designing accurate
pulse estimators. State-of-the-art methods regress the
pulse waveform rather than the pulse rate. Given a
video volume X
N×W×H×C
, the goal is to predict a real
value at each frame corresponding to the true blood
volume pulse, Y
N
, where N is the number of frames,
W and H are frame width and height, and C is the
number of image channels. Recently, the task has
been effectively modeled directly via spatiotemporal
neural networks. Another common approach is to
use frame differences to predict the first derivative of
the waveform, which only requires processing two-
dimensional input via common convolutional neural
network architectures (Chen and McDuff, 2018).
Models estimate a waveform from cropped and
rescaled face frame sequences. They are optimized
via stochastic gradient descent to minimize the loss
between the estimate and a ground truth pulse la-
bel. Common loss functions include mean square
error (MSE) and negative Pearson (Yu et al., 2019)
correlation. Training models with the above frame-
work leads to highly accurate pulse rate estimators on
videos of live subjects, and unpredictable “pulse” (yet
realistically-looking, as depicted in Fig. 1) signals es-
timated for videos not containing living subjects.
This paper thus explores the setting where the
rPPG system should inform the end-user of a failure,
by either generating unrealistic-looking waveforms or
providing an additional signal-quality-related output
for anomalous input videos. We formulate this prob-
lem as our first research question Q1 listed in the in-
troduction. To answer this question, we pass video
samples that are anomalous (i.e. they do not contain
a live human with a pulse) to our trained estimators
and analyze the waveforms. Throughout the rest of
the paper, we refer to samples containing a pulse as
positive samples, and anomalous samples as negative.
As demonstrated later in Sec. 7.1, we find that accu-
rate pulse regressors such as color-based and spa-
tiotemporal deep learning models are not neces-
sarily effective liveness detectors.
BIOSIGNALS 2023 - 16th International Conference on Bio-inspired Systems and Signal Processing
108

Figure 2: Models are trained on genuine DDPM and syn-
thetic samples. Several features such as signal-to-noise ra-
tio, standard deviation, and peak-to-peak distances are ex-
tracted from predicted waveforms to use as features for
closed-set and open-set anomaly detection. We test on
datasets with genuine samples (top 3) and anomalous sam-
ples (bottom 5).
5 APPROACH
To make the models “aware” of the input signal’s
quality, allow them to react differently for genuine
and anomalous signals, and thus address our research
question Q3, we propose adding specially-crafted
negative samples during training to reduce the sen-
sitivity to pulseless input samples. The following sec-
tions describe how we designed samples without a
pulse, and novel loss functions to penalize periodic
predictions for such inputs. Also, to address our re-
search question Q2, we dicuss here binary classifiers
for detecting anomalous inputs from the predicted
waveform features. Figure 2, along with the next sub-
sections, summarize the training and testing experi-
ment setups.
5.1 Training dataset: Deception
Detection and Physiological
Monitoring (DDPM)
DDPM dataset (Speth et al., 2021b; Speth et al.,
2021a) consists of 86 subjects in an interview setting,
where subjects attempted to respond to questions de-
ceptively. Interviews were recorded at 90 frames-per-
second for more than 10 minutes on average. Natural
conversation and frequent head pose changes make it
a difficult and less-constrained rPPG dataset.
5.2 Designing Negative Samples
In the true open-set regime, models are shown sam-
ples from unknown classes at inference time without
having seen them during training. It is impossible to
sample from the set of unknown unknowns, so train-
ing an open-set model in a supervised fashion is an
incomplete modeling of the problem. However, it is
straightforward to augment the existing video samples
such that a true pulse signal does not exist. Assum-
ing this heuristic approach to defining negative sam-
ples covers a sufficient portion of the negative space,
we can artificially generate negative samples during
training and train classifiers for binary liveness clas-
sification.
We define three different approaches for gener-
ating negative video samples taken from the DDPM
dataset (illustrated at the left side of Fig. 2):
1. NORMAL: A single video frame is replicated
over time with dynamic pixel-wise Gaussian noise
added to the video.
2. UNIFORM: As in (1), except uniform noise is
added.
3. SHUFFLE: The order of frames in a video is ran-
domly shuffled.
Hence, constructing useful negative samples for rPPG
is mainly concerned with temporal dynamics of blood
volume. In fact, the spatial contents of the input video
can remain almost unaltered. This ensures the neg-
ative samples are spatially similar to positive sam-
ples, so we can sample near the boundary between
the two classes. We use a standard deviation of 3 for
sampling noise in NORMAL samples, and lower and
upper bounds of -3 and 3, respectively, for sampling
noise in UNIFORM samples. In all three approaches,
a face is present in the input video, but the periodic
signal is nonexistent.
5.3 Training with Negative Samples
We trained the state-of-the-art rPPG model RPNet
(Speth et al., 2021a) with the aforementioned nega-
tive samples to avoid periodic predictions in the ab-
sence of a pulse. Positive and negative samples were
presented with equal probability to the model during
training. Our complete loss formulation is given by a
loss for positive samples, L
+
, and a loss for negative
samples, L
−
:
L =
(
L
+
(
ˆ
Y ,Y ), if sample is positive with a pulse
L
−
(
ˆ
Y ), if sample is anomalous,
(1)
where
ˆ
Y is the model’s waveform prediction and Y is
the ground truth pulse waveform. The positive loss
minimizes the difference between the ground truth
pulse of a positive sample and the prediction. The
negative loss pushes predictions away from periodic
features to make anomalous inputs easy to detect.
Hallucinated Heartbeats: Anomaly-Aware Remote Pulse Estimation
109

Note that the loss for negative samples only depends
on the model’s prediction, so the only requirement is
finding samples known to be negative.
When considering signal quality, it is typically
easier to formulate an objective in the frequency do-
main. We formulate two new FFT-based rPPG losses
given a predicted waveform. Both losses use the nor-
malized power spectral density:
F(
ˆ
Y ) =
FFT(
ˆ
Y )
K
∑
i=1
FFT(
ˆ
Y )
, (2)
where K is the number of frequency bins. To further
constrain the frequencies for rPPG, we zero all fre-
quencies lower than 40 bpm and higher than 240 bpm
prior to normalization. We used PyTorch’s FFT pack-
age to pass the gradient through the FFT operation.
Full details for both training and inference of all pulse
estimators can be found in the supplementary materi-
als.
5.3.1 Standard Deviation Loss
Next, we explore penalizing the non-constant com-
ponent of the predicted signal by using the standard
deviation for negative samples. The goal of this loss
is to reflect the input signal quality in the amplitude
of the predictions and encourage the model to predict
flatline signals. Positive samples still use the negative
Pearson loss.
5.3.2 Spectral Entropy Loss
While the previous two losses penalize predictions in
the time domain, we also use penalties in the fre-
quency domain. A common method for measuring
signal strength is signal-to-noise ratio (SNR), which
compares power within a narrow band to the power
outside that range. This approach is possible, because
the blood volume pulse can typically be approximated
by few frequencies. On the other extreme, a sample
without a pulse should effectively return a white noise
signal with a uniform spectrum. Shannon’s entropy is
a valuable metric for measuring the diversity of a dis-
tribution, which we believe is a good proxy for signal
quality:
L
−
(
ˆ
Y ) = −
K
∑
i=1
F(
ˆ
Y )log(F(
ˆ
Y ))
log(K)
, (3)
where K is the number of frequency bins of the pre-
dicted waveform,
ˆ
Y . The loss penalizes waveforms
with power concentrated amongst few frequencies,
and encourages a white noise signal when no pulse
exists in the input video.
5.3.3 Spectral Flatness Loss
Similarly to the our spectral entropy loss, we use
spectral flatness (Dubnov, 2004) to penalize narrow-
band predictions on negative samples:
L
−
(
ˆ
Y ) =
1
K
∑
i=1
F(
ˆ
Y )
exp
1
K
K
∑
i=1
log(F(
ˆ
Y )
!
, (4)
where K is the number of discrete frequency bins, and
ˆ
Y is the estimated waveform for the anomalous sam-
ple. Both the spectral entropy and spectral flatness
losses range between 0 and 1.
5.4 Anomaly Detection from Pulse
Features
To address Q2, we use handcrafted and interpretable
features from estimated pulse waveforms for the pre-
diction whether a sample is anomalous. All features
were calculated over a 10-second time window. From
the frequency domain, we extract the signal-to-noise-
ratio (SNR), due its common use in rPPG experi-
ments (De Haan and Jeanne, 2013; Nowara et al.,
2021) and applications (Kossack et al., 2022) as a
general signal quality metric. We extract features re-
lated to the amplitude of the signal including the stan-
dard deviation (σ) and the envelope calculated from
the Hilbert transform.
Additionally, we calculated several features from
the peaks of negated signal (troughs). Peaks were cal-
culated with a Python implementation (Colak et al.,
2016) of the automatic multiscale-based peak detec-
tion algorithm (AMPD) (Scholkmann et al., 2012).
First, we calculated the mean and standard devi-
ation of the difference between consecutive peaks.
Next, we calculated the mean and standard devia-
tion of the difference of differences, effectively ex-
amining the change in heart rate. Finally, we calcu-
lated the root mean square of successive differences
(RMSSD) (Shaffer and Ginsberg, 2017).
In general, SNR helps us understand how con-
centrated the signal power is in the frequency do-
main, and the amplitude features help measure how
far the signal is from a “flatline.” The peak-related
features analyze the heart rate variability over short
time frames. We concatenated all 8 features into a
single feature vector for each 10-second window.
We trained both one-class and two-class support
vector machines (SVM) with radial basis function
kernels on the aforementioned features for binary
anomaly detection. The one-class SVMs were trained
only on features from positive samples in the DDPM
validation set. The two-class SVMs were trained on
BIOSIGNALS 2023 - 16th International Conference on Bio-inspired Systems and Signal Processing
110

Figure 3: Frames of genuine samples from the DDPM training set (top left) and benchmark rPPG datasets for testing (top
right). Synthetic frames transformed from the DDPM dataset (bottom left) and testing frames from several anomalous
datasets (bottom right).
positive samples from the DDPM validation set and
constructed negative samples described in section 5.2.
Inclusion of a typical open-set classifier (one-class
SVM) was to assess a general value of adding neg-
ative rPPG samples to the training regime. For both
SVM architectures we used scikit-learn’s default pa-
rameters. Figure 2 shows the overall pipeline for our
approach and experiments.
6 EXPERIMENTAL EVALUATION
6.1 Pulse Test Datasets
– PURE (Stricker et al., 2014): PURE is a benchmark
rPPG dataset consisting of 10 subjects recorded over 6
sessions. Each session lasted approximately 1 minute,
and raw video was recorded at 30 fps. The 6 sessions
for each subject consisted of: (1) steady, (2) talking,
(3) slow head translation, (4) fast head translation, (5)
small and (6) medium head rotations.
– UBFC-rPPG (Bobbia et al., 2019): UBFC-rPPG
contains 1-minute long videos from 42 subjects
recorded at 30 fps. Subjects played a time-sensitive
mathematical game to raise their heart rates, but head
motion is limited during the recording.
6.2 Pulseless Test Datasets
We compiled several video datasets that do not con-
tain a visible pulse to assess our approach. We mostly
selected datasets that contain genuine or masked
faces, such that the rPPG pipeline may not detect an
anomalous input before passing video to the model.
For a more extreme experiment, we used a dataset
of dynamic scenes from a vehicle that do not contain
faces or visible skin.
– Compressed DDPM (CDDPM): Video compres-
sion is a well-studied challenge for rPPG (McDuff
et al., 2017; Zhao et al., 2018; Nowara and McDuff,
2019; Yu* et al., 2019; Nowara et al., 2021). Most
previous work has attempted to design models capa-
ble of robustly estimating the pulse on compressed
videos. At high compression rates, however, estima-
tion performance drops significantly, and usability of
the system becomes questionable. To this end, we
used the H264 video compression codec with a CRF
value of 30.
– Adversarial Remote Physiological Monitoring
(ARPM) (Speth et al., 2022): Similarly to adversar-
ial attacks in traditional biometric recognition, a re-
cent work showed that rPPG systems are also prone
to injection and presentation attacks that can change
the predicted pulse rate. The dataset contains subjects
sitting near an LED that projects a dynamic adversar-
ial pattern on their skin. We consider the samples in
this dataset to be negative, since a reliable rPPG sys-
tem should detect an attack and warn the practitioner,
rather than estimating the waveform.
– DeepFake Detection Challenge (DFDC) (Dolhan-
sky et al., 2019; Dolhansky et al., 2020): DeepFakes
are realistic videos that change the identity of the orig-
inal subject, while maintaining their actions. Signifi-
cant efforts have been made to detect DeepFakes, as
they pose a significant media threat.
– HKBU 3D Mask Attack with Real World Vari-
ations (MARs) (Liu et al., 2016): We use version
2 of HKBU-MARs, which contains videos with both
realistic 3D masks and unmasked subjects, to exam-
ine spatially realistic video with anomalous temporal
dynamics. This is a valuable scenario to test, since
the face masks are easily detected and landmarked
by OpenFace (Baltrusaitis et al., 2018), so the videos
would be passed to the pulse estimator in a real sys-
tem. Note that rPPG features were already shown to
be useful on this dataset (Liu et al., 2020a), but there
evaluation is performed in a closed-set scenario, and
does not evaluate models trained for robust pulse es-
Hallucinated Heartbeats: Anomaly-Aware Remote Pulse Estimation
111

timation.
– KITTI (Geiger et al., 2013): The KITTI dataset is
a benchmark for autonomous vehicles, and contains
recordings from several sensors attached to a vehicle.
We used video from city and residential settings as an
extreme case to test our approach, since they do not
contain faces or skin pixels. We randomly selected a
square region of interest with a minimum length of 64
pixels across all frames in each video.
6.3 Evaluation Metrics
To answer Q1 we qualitatively examine waveforms
from pulse estimators on anomalous data.
To answer Q2 and Q3 we evaluate the SVM clas-
sifiers’ binary predictions of whether an input video
contains a pulse. We train both one-class and two-
class SVMs on the set of 8 features described in sec-
tion 5.4. We calculate the accuracy as the number
of correctly classified frames over the total number
of frames. Accuracy is calculated for each SVM on
all datasets separately, and then combined to give an
overall evaluation for the various domains.
To answer Q4 we estimate pulse rates for the
DDPM, UBFC-rPPG, and PURE physiological mon-
itoring datasets. Pulse rates are computed as the
highest spectral peak between 0.66 Hz and 4 Hz (40
bpm to 240 bpm) over a 10-second sliding window.
The same procedure is applied to the ground truth
waveforms for a reliable evaluation (Mironenko et al.,
2020). We apply common error metrics amongst
rPPG research, such as mean error (ME), mean ab-
solute error (MAE), root mean square error (RMSE),
and Pearson correlation coefficient between frame-
wise prediction and label pairs.
7 RESULTS
7.1 Addressing Research Question Q1
(Predicted Waveforms for
Anomalous Samples)
The bottom row of Fig. 1 shows predictions from
a standard RPNet model and anomaly-aware RPNet
models. The top waveforms are from a DDPM sam-
ple, and all show a clear pulse signal. The bottom
waveforms are from a KITTI sample of city driving.
The prediction from the standard RPNet model looks
visually similar to that of a blood volume pulse. In
fact, the model’s priors are so strong that it even adds
a dicrotic notch to the third cycle. The anomaly-aware
RPNet model trained with the spectral flatness penalty
predicts a wideband signal without strong frequen-
cies in the typical pulse range. The anomaly-aware
RPNet model trained with standard deviation penalty
predicts a low amplitude signal compared to that of
the genuine prediction. To answer Q1, spatiotem-
poral deep learning models can produce genuine-
looking waveforms from anomalous inputs, even
adding distinct features such as the dicrotic notch.
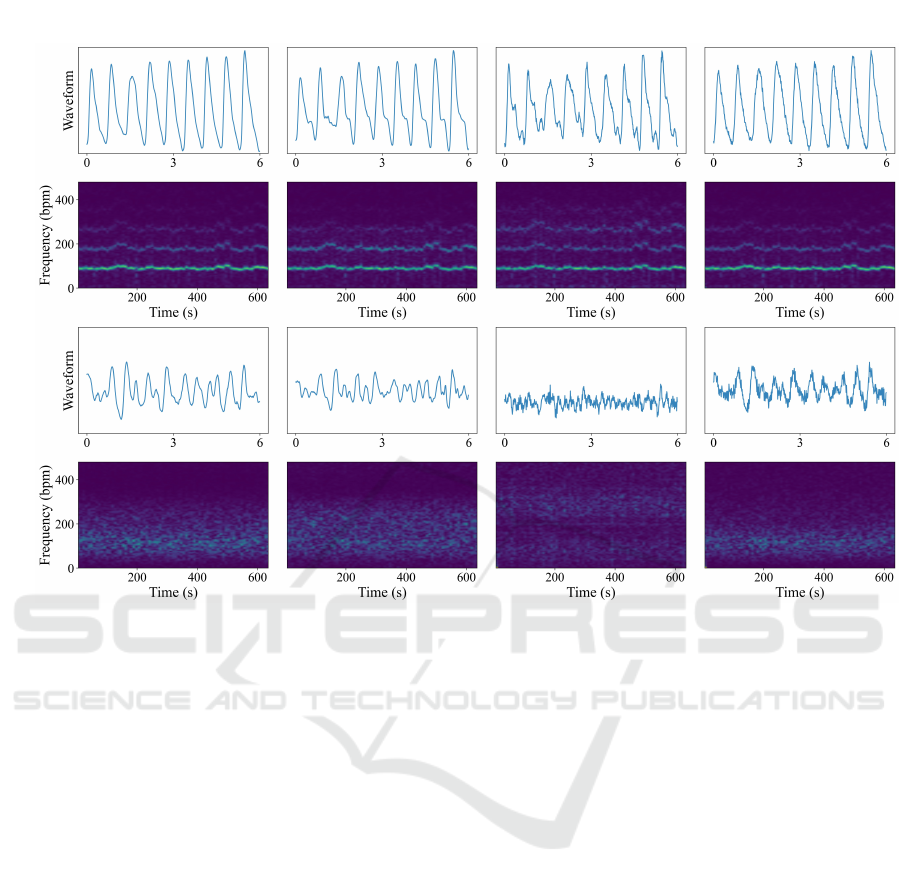
Additionally, the bottom row of Fig. 4 shows es-
timated waveforms for a 6-second segment, and pe-
riodograms for several minutes from the original and
regularized RPNet models on a still face frame with
additive uniform noise. As shown in the periodogram,
the original model occasionally estimates periodic
components between 50 and 300 bpm, and effectively
bandpass filters the signal. When training with spec-
tral flatness penalty for negative samples, the model
uniformly spreads the signal strength over all frequen-
cies, giving a white noise signal. The spectral en-
tropy model allows slightly higher frequency compo-
nents than the original model. The standard devia-
tion model allows for high frequency components as
well, but surprisingly keeps a somewhat narrower fre-
quency band between 50 and 180 beats per minute.
Visually, the waveforms for the regularized models
look more unrealistic than the original model, and
correctly propagate input errors to the prediction.
7.2 Addressing Research Question Q2
(Anomaly Detection on Top of
Existing rPPG Estimators)
The first three columns in Table 1 show the one-
class and two-class SVM anomaly detection results
for baseline pulse estimators. Features from the orig-
inal RPNet result in an overall accuracy of 73.70%
with two-class SVMs. CHROM gives the highest ac-
curacy of the color-transformation approaches with
62.04%. POS gives the worst baseline performance,
which we attribute to the lack of bandpass filtering, al-
lowing for high frequency signals to occur regardless
of the video input.
One-class classification is difficult, since only fea-
tures from live samples in DDPM were used to fit
the classifier, and it is an open-set problem. In the
three upper-leftmost columns, the color transforma-
tion methods achieves lower than 50% accuracy on
the combined data, but the RPNet model achieves
56.77% accuracy. To answer Q2, the color trans-
formation methods struggle to extract useful fea-
tures for anomaly detection, and the deep learning
model (RPNet) with unmodified training is still rel-
atively poor at propagating input signal quality to
the waveform prediction.
BIOSIGNALS 2023 - 16th International Conference on Bio-inspired Systems and Signal Processing
112
Anomalous
Genuine
!
!
=
Negative Pearson
!
!
=
Negative Pearson
!
"
=
Spectral Flatness
!
!
=
Negative Pearson
!
"
=
Spectral Entropy
!
!
=
Negative Pearson
!
"
=
Standard Deviation
Figure 4: Waveform estimates over a 6-second window and spectrograms for an entire 600+ second video. The top row shows
predictions on a genuine video from the DDPM test set. The bottom row shows predictions from a negative video generated
by adding pixel-wise uniform noise to a single static frame from randomly selected from the same DDPM video. The first
column represents an RPNet model (Speth et al., 2021a) trained only with positive samples and negative Pearson loss. The
last three columns represent models trained with both positive and negative samples and the corresponding loss functions
shown above.
7.3 Addressing Research Question Q3
(Anomaly Detection from
Anomaly-Aware rPPG Estimators)
Using two-class SVMs, the anomaly-aware model
trained with spectral entropy gives the highest accu-
racy for detecting anomalous video inputs. Compar-
ing to the original training regime for RPNet, we find
a 4% and 2% increase in accuracy for one- and two-
class SVMs with our proposed training strategy. The
one-class classifiers perform worse overall than the
two-class classifiers, but the proposed training strat-
egy still gives improvements over the original RPNet
model. Standard deviation loss provides the richest
features for one-class classification. We see that de-
tecting anomalous inputs from waveforms is still a
difficult task. Overall, the answer to Q3 is affirma-
tive: the proposed training regimen results in more
discriminative features for anomaly detection.
7.4 Addressing Research Question Q4
(Performance of Anomaly-Aware
Models for Live Subjects)
Table 2 shows pulse rate performance across the RP-
Net models and baseline color transformation meth-
ods. The deep learning estimators outperform the
baselines on DDPM, since they were trained on data
in the same setting. For PURE, the baselines give
the lowest error rates, and the RPNet models trans-
fer poorly from DDPM. The poor performance could
be explained by the low average pulse rate in PURE
compared to DDPM, which is reflected in the strong
bias from all deep learning models. Performance
is relatively stable across deep learning and baseline
models on the UBFC-rPPG. The vanilla RPNet model
trained with simple negative Pearson loss on DDPM
transfers well, giving a mean absolute error of 1.46
bpm.
Across all datasets, the model penalized with stan-
dard deviation gives the most accurate pulse rates.
Hallucinated Heartbeats: Anomaly-Aware Remote Pulse Estimation
113

Table 1: Accuracy for anomaly detection from rPPG features on all datasets. RPNet stands for off-the-shelf model and
training, while three last columns correspond to the off-the-shelf RPNet architecture with the proposed training regimes.
Dataset
CHROM POS RPNet
RPNet +
Entropy
RPNet +
Flatness
RPNet
+ σ
One-Class SVM
DDPM 41.96 43.60 51.96 ± 3.32 59.22 ± 1.21 41.65 ± 3.32 42.02 ± 2.53
PURE 4.60 0.00 0.12 ± 0.18 0.76 ± 1.02 3.16 ± 4.24 13.58 ± 5.73
UBFC 22.87 0.00 21.37 ± 9.59 11.07 ± 4.60 21.86 ± 21.17 57.07 ± 2.71
CDDPM 37.34 59.24 88.44 ± 1.64 95.77 ± 0.77 71.21 ± 5.03 87.35 ± 4.06
ARPM 100.00 98.68 31.95 ± 1.77 40.64 ± 8.17 80.22 ± 6.44 78.31 ± 1.71
DFDC 47.67 50.01 49.81 ± 0.32 49.97 ± 0.37 49.10 ± 0.65 49.80 ± 0.30
MARs 52.98 50.00 64.37 ± 1.09 63.49 ± 1.43 54.92 ± 3.60 56.05 ± 3.35
KITTI 100.00 100.00 100.00 ± 0.00 100.00 ± 0.00 98.18 ± 2.91 91.69 ± 2.78
All 45.04 48.88 56.77 ± 1.06 60.67 ± 0.47 52.65 ± 2.68 61.11 ± 0.55
Two-Class SVM
DDPM 91.31 100.00 97.69 ± 0.96 98.92 ± 0.45 97.17 ± 2.84 94.26 ± 2.91
PURE 99.72 100.00 100.00 ± 0.00 100.00 ± 0.00 94.51 ± 5.55 75.64 ± 14.00
UBFC 99.44 100.00 99.20 ± 0.61 99.95 ± 0.06 96.90 ± 3.76 91.12 ± 7.33
CDDPM 1.82 0.09 76.38 ± 5.10 80.60 ± 4.42 4.35 ± 7.30 47.12 ± 24.00
ARPM 2.73 4.31 13.01 ± 2.20 19.69 ± 2.50 2.42 ± 2.94 12.41 ± 6.30
DFDC 47.33 49.99 48.44 ± 0.48 48.03 ± 0.60 48.84 ± 1.00 49.30 ± 0.60
MARs 69.25 50.00 52.54 ± 1.27 49.94 ± 0.90 54.23 ± 4.33 68.63 ± 9.35
KITTI 96.50 0.00 0.00 ± 0.00 0.00 ± 0.00 42.78 ± 37.03 45.48 ± 22.83
All 62.03 52.11 73.70 ± 1.23 75.78 ± 1.32 56.68 ± 2.71 65.87 ± 7.21
The deep learning models do not provide a sig-
nificant improvement over baseline color transfor-
mation methods in cross-dataset testing. However,
models trained with our technique have low errors
when examining both the within-dataset and cross-
dataset evaluations. Therefore, the answer to Q4
is that anomaly-aware training with negative sam-
ples does not harm pulse rate estimation and may
even improve performance. We believe this is an
encouraging finding, and additional model regulariza-
tion techniques for rPPG should be explored further.
8 DISCUSSION
8.1 Do All Models “hallucinate” Pulse
Waveforms?
We show that spatiotemporal deep learning models
can produce genuine-looking waveforms that do not
exist in the input. Note that this problem will only
occur in models that operate over the time dimension.
For one-dimensional temporal neural networks (Wu
et al., 2022), the model could similarly extract a
periodic signal within physiological bounds. Two-
dimensional neural networks that estimate the pulse
Table 2: Pulse rate estimation performance for baseline and
spatiotemporal methods on all pulse datasets.
ME MAE RMSE r
DDPM
CHROM 8.68 13.04 28.49 0.56
POS 4.21 8.88 23.67 0.69
RPNet -1.91 ± 0.13 3.41 ± 0.11 12.38 ± 0.27 0.91 ± 0.00
Entropy -1.26 ± 0.45 4.06 ± 0.38 13.62 ± 0.68 0.89 ± 0.01
σ -1.39 ± 0.35 3.75 ± 0.24 13.07 ± 0.58 0.90 ± 0.01
Flatness 0.73 ± 2.18 7.00 ± 2.60 19.45 ± 4.61 0.76 ± 0.11
PURE
CHROM -0.02 0.73 2.14 1.00
POS 0.13 0.77 3.84 0.99
RPNet -9.64 ± 2.73 13.21 ± 2.74 25.72 ± 3.61 0.60 ± 0.06
Entropy -6.74 ± 1.76 11.01 ± 1.02 25.73 ± 1.07 0.54 ± 0.02
σ -5.34 ± 1.08 10.74 ± 2.48 22.21 ± 3.20 0.60 ± 0.11
Flatness -3.90 ± 5.11 9.41 ± 3.43 23.33 ± 7.58 0.62 ± 0.15
UBFC-rPPG
CHROM 2.12 2.64 10.37 0.85
POS 1.44 2.06 8.85 0.89
RPNet 0.18 ± 0.28 1.46 ± 0.52 5.64 ± 1.59 0.94 ± 0.03
Entropy 0.15 ± 0.41 1.76 ± 0.77 7.68 ± 2.23 0.90 ± 0.05
σ 0.63 ± 0.46 2.71 ± 1.48 8.98 ± 3.24 0.87 ± 0.08
Flatness -1.01 ± 4.91 5.41 ± 3.31 16.97 ± 7.55 0.69 ± 0.17
All
CHROM 4.82 7.37 20.87 0.74
POS 2.46 5.15 17.46 0.82
RPNet -3.79 ± 0.87 5.92 ± 0.75 16.79 ± 1.52 0.83 ± 0.03
Entropy -2.61 ± 0.52 5.67 ± 0.50 17.40 ± 0.75 0.82 ± 0.02
σ -2.16 ± 0.47 5.61 ± 0.44 15.91 ± 0.82 0.84 ± 0.02
Flatness -0.98 ± 3.26 7.40 ± 2.03 20.82 ± 3.92 0.74 ± 0.08
derivative (Chen and McDuff, 2018; Liu et al., 2020b)
avoid the problem, since the model treats each time
step independently.
BIOSIGNALS 2023 - 16th International Conference on Bio-inspired Systems and Signal Processing
114

8.2 Other Sources of Artificial
Frequencies
Spatiotemporal and temporal models typically con-
sume short overlapping segments from a video, and
the predictions are “glued” together with techniques
such as overlap-adding (De Haan and Jeanne, 2013).
Our initial experiments exposed artificial frequencies
that were added to our predictions due to the default
padding parameters in PyTorch. In the default 3-D
convolution operation, the input video clips were be-
ing padded with zeros in the time dimension, which
created an artificial temporal response from our model
even on constant input videos. We recommend edge-
based padding to mitigate this problem.
9 CONCLUSIONS
We present the first experiments to explore how spa-
tiotemporal networks for rPPG behave when given
anomalous video inputs, and the first rPPG models
trained to appropriately react to anomalous input sig-
nals. Spatiotemporal networks learn such strong pri-
ors on the shape of blood volume pulse waveforms
that they can “hallucinate” a genuine-looking wave-
form when no live subject exists in the input video.
To mitigate this problem, we propose a new training
regimen for spatiotemporal models. We find that pe-
nalizing the model for predicting periodic signals on
inputs without a human pulse yields more trustwor-
thy predictions. Our experiments showed that features
extracted from the proposed models were more pow-
erful for detecting anomalous videos and even gave
lower error rates for pulse rate estimation applied to
genuine videos.
ACKNOWLEDGEMENTS
This research was sponsored by the Securiport Global
Innovation Cell, a division of Securiport LLC. Com-
mercial equipment is identified in this work in order
to adequately specify or describe the subject matter.
In no case does such identification imply recommen-
dation or endorsement by Securiport LLC, nor does it
imply that the equipment identified is necessarily the
best available for this purpose. The opinions, find-
ings, and conclusions or recommendations expressed
in this publication are those of the authors and do not
necessarily reflect the views of our sponsors.
REFERENCES
Baltrusaitis, T., Zadeh, A., Lim, Y. C., and Morency,
L. (2018). Openface 2.0: Facial behavior analysis
toolkit. In IEEE International Conference on Auto-
matic Face Gesture Recognition (FG), pages 59–66.
Bobbia, S., Macwan, R., Benezeth, Y., Mansouri, A., and
Dubois, J. (2019). Unsupervised skin tissue seg-
mentation for remote photoplethysmography. Pattern
Recognition Letters, 124:82–90.
Chen, W. and McDuff, D. (2018). DeepPhys: Video-based
physiological measurement using convolutional atten-
tion networks. In European Conference on Computer
Vision (ECCV), pages 356–373.
Colak, A. M., Shibata, Y., and Kurokawa, F. (2016). Fpga
implementation of the automatic multiscale based
peak detection for real-time signal analysis on renew-
able energy systems. In 2016 IEEE International Con-
ference on Renewable Energy Research and Applica-
tions (ICRERA), pages 379–384.
De Haan, G. and Jeanne, V. (2013). Robust pulse rate
from chrominance-based rppg. IEEE Transactions on
Biomedical Engineering, 60(10):2878–2886.
De Haan, G. and Van Leest, A. (2014). Improved mo-
tion robustness of remote-PPG by using the blood
volume pulse signature. Physiological Measurement,
35(9):1913–1926.
Dolhansky, B., Bitton, J., Pflaum, B., Lu, J., Howes, R.,
Wang, M., and Ferrer, C. C. (2020). The deepfake
detection challenge dataset.
Dolhansky, B., Howes, R., Pflaum, B., Baram, N.,
and Ferrer, C. C. (2019). The deepfake detection
challenge (dfdc) preview dataset. arXiv preprint
arXiv:1910.08854.
Dubnov, S. (2004). Generalization of spectral flatness mea-
sure for non-gaussian linear processes. IEEE Signal
Processing Letters, 11(8):698–701.
Geiger, A., Lenz, P., Stiller, C., and Urtasun, R. (2013).
Vision meets robotics: The kitti dataset. International
Journal of Robotics Research (IJRR).
Hendrycks, D., Mazeika, M., and Dietterich, T. (2019).
Deep anomaly detection with outlier exposure. Pro-
ceedings of the International Conference on Learning
Representations.
Iuchi, K., Miyazaki, R., Cardoso, G. C., Ogawa-Ochiai, K.,
and Tsumura, N. (2022). Remote estimation of con-
tinuous blood pressure by a convolutional neural net-
work trained on spatial patterns of facial pulse waves.
In Proceedings of the IEEE/CVF Conference on Com-
puter Vision and Pattern Recognition (CVPR) Work-
shops, pages 2139–2145.
Kossack, B., Wisotzky, E., Eisert, P., Schraven, S. P.,
Globke, B., and Hilsmann, A. (2022). Perfusion
assessment via local remote photoplethysmography
(rppg). In Proceedings of the IEEE/CVF Conference
on Computer Vision and Pattern Recognition (CVPR)
Workshops, pages 2192–2201.
Lee, E., Chen, E., and Lee, C.-Y. (2020). Meta-rppg: Re-
mote heart rate estimation using a transductive meta-
Hallucinated Heartbeats: Anomaly-Aware Remote Pulse Estimation
115

learner. In European Conference on Computer Vision
(ECCV).
Lee, K., Lee, H., Lee, K., and Shin, J. (2018). Training
confidence-calibrated classifiers for detecting out-of-
distribution samples. In International Conference on
Learning Representations.
Liu, S., Yang, B., Yuen, P. C., and Zhao, G. (2016). A
3d mask face anti-spoofing database with real world
variations. In Proceedings of the IEEE Conference
on Computer Vision and Pattern Recognition (CVPR)
Workshops.
Liu, S. Q., Lan, X., and Yuen, P. C. (2020a). Temporal sim-
ilarity analysis of remote photoplethysmography for
fast 3D mask face presentation attack detection. Pro-
ceedings of the IEEE/CVF Winter Conference on Ap-
plications of Computer Vision (WACV), pages 2597–
2605.
Liu, X., Fromm, J., Patel, S., and McDuff, D. (2020b).
Multi-task temporal shift attention networks for on-
device contactless vitals measurement. In Larochelle,
H., Ranzato, M., Hadsell, R., Balcan, M. F., and Lin,
H., editors, Advances in Neural Information Process-
ing Systems, volume 33, pages 19400–19411. Curran
Associates, Inc.
Liu, X., Yang, X., Wang, D., Wong, A., Ma, L., and Li, L.
(2022). Vidaf: A motion-robust model for atrial fib-
rillation screening from facial videos. IEEE Journal
of Biomedical and Health Informatics, 26(4):1672–
1683.
Lu, H., Han, H., and Zhou, S. K. (2021). Dual-GAN : Joint
BVP and Noise Modeling for Remote Physiological
Measurement. In IEEE Conference on Computer Vi-
sion and Pattern Recognition (CVPR), pages 12404–
12413.
McDuff, D. (2021). Camera measurement of physiological
vital signs. CoRR, abs/2111.11547.
McDuff, D. J., Blackford, E. B., and Estepp, J. R. (2017).
The Impact of Video Compression on Remote Cardiac
Pulse Measurement Using Imaging Photoplethysmog-
raphy. IEEE International Conference on Automatic
Face and Gesture Recognition Workshops (FG), pages
63–70.
Mironenko, Y., Kalinin, K., Kopeliovich, M., and
Petrushan, M. (2020). Remote photoplethysmogra-
phy: Rarely considered factors. In IEEE Conference
on Computer Vision and Pattern Recognition Work-
shops (CVPRW), pages 1197–1206.
Niu, X., Han, H., Shan, S., and Chen, X. (2018). VIPL-HR:
A multi-modal database for pulse estimation from
less-constrained face video. In Asian Conference on
Computer Vision (ACCV), pages 562–576.
Niu, X., Shan, S., Han, H., and Chen, X. (2020). Rhythm-
Net: End-to-end heart rate estimation from face via
spatial-temporal representation. IEEE Transactions
on Image Processing, 29:2409–2423.
Nowara, E. and McDuff, D. (2019). Combating the Im-
pact of Video Compression on Non-Contact Vital Sign
Measurement Using Supervised Learning. In IEEE In-
ternational Conference on Computer Vision Workshop
(ICCVW), pages 1706–1712. ISSN: 2473-9944.
Nowara, E. M., McDuff, D., and Veeraraghavan, A. (2021).
Systematic analysis of video-based pulse measure-
ment from compressed videos. Biomedical Optics Ex-
press, 12(1):494.
Scholkmann, F., Boss, J., and Wolf, M. (2012). An
efficient algorithm for automatic peak detection in
noisy periodic and quasi-periodic signals. Algorithms,
5(4):588–603.
Shaffer, F. and Ginsberg, J. P. (2017). An overview of heart
rate variability metrics and norms. Frontiers in Public
Health, 5.
Speth, J., Vance, N., Czajka, A., Bowyer, K., and Flynn, P.
(2021a). Unifying frame rate and temporal dilations
for improved remote pulse detection. Computer Vision
and Image Understanding (CVIU), pages 1056–1062.
Speth, J., Vance, N., Czajka, A., Bowyer, K., Wright, D.,
and Flynn, P. (2021b). Deception detection and re-
mote physiological monitoring: A dataset and base-
line experimental results. In International Joint Con-
ference on Biometrics (IJCB), pages 4264–4271.
Speth, J., Vance, N., Flynn, P., Bowyer, K. W., and
Czajka, A. (2022). Digital and physical-world at-
tacks on remote pulse detection. In Proceedings of
the IEEE/CVF Winter Conference on Applications of
Computer Vision (WACV), pages 2407–2416.
Stricker, R., Muller, S., and Gross, H. M. (2014). Non-
contact video-based pulse rate measurement on a mo-
bile service robot. IEEE International Symposium on
Robot and Human Interactive Communication, pages
1056–1062.
Verkruysse, W., Svaasand, L. O., and Nelson, J. S. (2008).
Remote plethysmographic imaging using ambient
light. Opt. Express, 16(26):21434–21445.
Wang, W., Den Brinker, A. C., and De Haan, G. (2019).
Single-Element Remote-PPG. IEEE Transactions on
Biomedical Engineering, 66(7):2032–2043.
Wang, W., den Brinker, A. C., Stuijk, S., and de
Haan, G. (2017). Algorithmic principles of remote
PPG. IEEE Transactions on Biomedical Engineering,
64(7):1479–1491.
Wang, W., Stuijk, S., and de Haan, G. (2015). Unsupervised
subject detection via remote ppg. IEEE Transactions
on Biomedical Engineering, 62(11):2629–2637.
Wang, W., Stuijk, S., and de Haan, G. (2017). Living-skin
classification via remote-ppg. IEEE Transactions on
Biomedical Engineering, 64(12):2781–2792.
Wu, B.-f., Wu, B.-j., Cheng, S.-e., and Sun, Y. (2022).
Motion-Robust Atrial Fibrillation Detection Based on
Remote-Photoplethysmography. XX(XX):1–12.
Yu, Z., Li, X., and Zhao, G. (2019). Remote photoplethys-
mograph signal measurement from facial videos us-
ing spatio-temporal networks. In Proceedings of the
British Machine Vision Conference (BMVC), pages 1–
12.
Yu*, Z., Peng*, W., Li, X., Hong, X., and Zhao, G. (2019).
Remote heart rate measurement from highly com-
pressed facial videos: an end-to-end deep learning so-
lution with video enhancement. In International Con-
ference on Computer Vision (ICCV).
BIOSIGNALS 2023 - 16th International Conference on Bio-inspired Systems and Signal Processing
116

Yu, Z., Shen, Y., Shi, J., Zhao, H., Torr, P. H., and Zhao,
G. (2022). Physformer: Facial video-based physio-
logical measurement with temporal difference trans-
former. In Proceedings of the IEEE/CVF Conference
on Computer Vision and Pattern Recognition (CVPR),
pages 4186–4196.
Zhao, C., Lin, C.-L., Chen, W., and Li, Z. (2018). A Novel
Framework for Remote Photoplethysmography Pulse
Extraction on Compressed Videos. In IEEE Con-
ference on Computer Vision and Pattern Recognition
Workshops (CVPRW), pages 1380–138009. ISSN:
2160-7516.
Zhao, Y., Zou, B., Yang, F., Lu, L., Belkacem, A. N., and
Chen, C. (2021). Video-based physiological measure-
ment using 3d central difference convolution attention
network. In 2021 IEEE International Joint Confer-
ence on Biometrics (IJCB), pages 1–6.
APPENDIX
10 MODEL TRAINING DETAILS
For the Fourier-based loss functions, the nfft value
was set to 5400, giving a frequency resolution of 1
bpm on a 90 frames-per-second (fps) input video.
Calibrated models trained with negative samples
were trained for 60 epochs. We selected the best-
performing model on the DDPM and negative-DDPM
validation sets as the final model for testing.
11 MODEL INFERENCE
DETAILS
The RPNet model was trained on 90 fps videos from
the DDPM dataset, but many of the datasets for test-
ing have lower frame rates. For these videos, we
first landmarked and cropped the face as described
in (Speth et al., 2021a), then linearly interpolated the
cropped video arrays up to 90 fps. For the CHROM
and POS approaches, we estimated the pulse wave-
forms on the video’s native frame rate, then upsam-
pled the waveform with cubic interpolation to 90 sam-
ples per second.
12 APPROACHES THAT FAILED
12.1 Recurrent Neural Networks
We built several recurrent neural network (RNN)
models for anomaly detection. We trained three RNN
models by using the feature maps from the seventh,
eighth, and ninth layers of pretrained RPNet models
as input. We employed a binary cross-entropy loss
and trained with both positive and the designed nega-
tive samples. The RNN models had one hidden layer
and used a gated recurrent unit (GRU). We found that
the RNN models did not generalize outside the train-
ing data. They gave very accurate predictions when
classifying DDPM and the negative DDPM samples,
but failed on other datasets. We also found that the
RPNet model for input feature maps did not signifi-
cantly change the performance.
12.2 Mean Square Error Loss
The simplest loss we explored was the mean square
error (MSE) loss. In this case, we applied the same
loss for both negative and positive samples. For pos-
itive samples, the target signal was the ground truth
waveform. For negative samples, we considered the
target sample to be a “flatline” waveform of zeros. We
found that features extracted from this model’s pre-
dictions were not conducive for anomaly-detection.
Furthermore, the MSE loss on positive samples pro-
duces worse pulse estimation performance than nega-
tive Pearson loss (Yu et al., 2019).
Hallucinated Heartbeats: Anomaly-Aware Remote Pulse Estimation
117
