
Towards Lung Cancer Staging via Μultipositional Radiomics and
Machine Learning
Dimitris Fotopoulos
1a
, Dimitris Filos
1b
, Ekaterini Xinou
2c
and Ioanna Chouvarda
1d
1
School of Medicine, Aristotle University of Thessaloniki, Thessaloniki, Greece
2
Theagenio Cancer Hospital, Thessaloniki, Greece
Keywords: Lung Cancer, Disease Staging, CT Imaging Radiomics, Tumour and Organ Features, Machine Learning.
Abstract: This work addresses lung cancer diagnosis, and more specifically disease staging, as a major clinical challenge,
crucial for further treatment decisions. The procedure is currently performed by experts based on clinical and
medical imaging data and is time consuming and costly. Within INCISIVE, an EU-funded research project
which aims to develop a pan-European federated image repository for cancer and implement Artificial
Intelligence (AI) tools for clinical practice, clinical challenges have been identified that can be supported by
AI in medical imaging data to facilitate accurate diagnosis and support treatment planning. The support and
automation of lung cancer staging has been identified as a priority among the INCISIVE clinical challenges.
In this scope, we propose a method to automatically classify between the group that represents disease stages
I and II (low severity), vs the group that includes stages III and IV (severe). Tumour-Node-Metastasis system
is used as a reference for staging. Based on lung CT image series with tumour and lung volume segmentation,
we calculate and harmonise radiomics features and we propose the combination of tumour and lung lobes
radiomics features towards improving the classification performance. Having a rich feature set as a basis,
several combinations of feature selection and classification methods are tested and compared. Multiple
repetitions of cross-validation and external testing splits are used to reach robust manner. The proposed
method is trained and tested on an integrated dataset comprised of two open datasets (the NSCLC-Radiomics
and the NSCLC-Radiogenomics dataset from the Cancer Imaging Archive). It achieves average Precision and
Recall of 77.5% and 78.7% respectively, which could be further improved with a more extensive training set.
Therefore, this can be the basis for a prioritisation tool regarding lung cancer cases and detailed
staging/treatment decisions.
1 INTRODUCTION
Lung cancer is the leading cause of cancer-related
mortality for both males and females with the daily
deaths to be more than 2.5 times more than colorectal
cancer, the second most common non-gender specific
cancer, or more than breast, prostate, and pancreas
cancer-related deaths together (Siegel et al, 2022).
Primary or second-hand smoking, COPD, family
history, or exposure to carcinogens, such as asbestos,
cadmium or diesel fumes, are some of the risk factors
(Thandra et al, 2021). Early diagnosis will have a
great impact on the management of lung cancer
a
https://orcid.org/0000-0001-8605-8593
b
https://orcid.org/0000-0001-5613-652X
c
https://orcid.org/0000-0003-1573-8123
d
https://orcid.org/0000-0001-8915-6658
patients since it is found that the five-year survival
rates reach the 57% when the cancer is diagnosed in
its early stages (Raz et al, 2007).
In INCISIVE project (https://incisive-project.eu/),
we aim to address some major challenges in lung
cancer diagnosis and treatment, using Artificial
Intelligence tools and big data. Supporting and
automating lung cancer staging has been recognized
as one of the important challenges, which can
facilitate accurate diagnosis and support treatment
planning.
Specifically, non-small cell lung cancer is one of
the two main categories of lung cancer. The disease
Fotopoulos, D., Filos, D., Xinou, E. and Chouvarda, I.
Towards Lung Cancer Staging via ultipositional Radiomics and Machine Learning.
DOI: 10.5220/0011781500003414
In Proceedings of the 16th International Joint Conference on Biomedical Engineering Systems and Technologies (BIOSTEC 2023) - Volume 4: BIOSIGNALS, pages 317-324
ISBN: 978-989-758-631-6; ISSN: 2184-4305
Copyright
c
2023 by SCITEPRESS – Science and Technology Publications, Lda. Under CC license (CC BY-NC-ND 4.0)
317

stage can reveal information regarding the size of the
tumour if it has spread in parts of the body and it is
important information when planning what kind of
treatment is required. Staging is performed at the
initial diagnosis of the patient and at a second time
after the beginning of treatment, using the Tumour-
Node-Metastasis system (TNM) (Rami-Porta et al,
2009).
Cancer imaging is mainly used for diagnosis,
evaluation and treatment planning. In Lung cancer,
CT screening is recommended for the detection of
lung cancer but also as a screening for high-risk
populations. Imaging data are used for the evaluation
of disease severity with the TNM classification
scheme proposed (Amin et al, 2017). In addition, the
National Comprehensive Cancer Network (NCCN –
https://www.nccn.org) has proposed guidelines for
the selection of the appropriate therapy based on the
TNM classification and staging of the patients, and
thus the accurate staging of the cancer remains a
major clinical challenge. The staging procedure is
currently performed by experts through inspection
and assessment of physical exams, biopsy results and
imaging tests, which involve health costs, time effort,
and invasive methods.
Introducing digital tools to facilitate this
procedure, in terms of speed, cost, or accuracy, would
be of great benefit. In this direction, radiomic analysis
aims to extract characteristics of specific structures
found in medical images, leading to the quantitative
analysis of images. Radiomics features have already
been combined with machine learning methods to
detect malignancy in lung cancer (Anagnostopoulos
et al, 2022), while additional clinical features, such as
histopathological analysis results, have been used to
improve the success rates of the above algorithms.
A number of previous research efforts have
proposed methods to identify the stage of the patient
non-invasively, using biomarkers that are extracted
from medical images. Yu et al. (Yu et al., 2019)
implemented a machine learning algorithm for
radiomics-based prediction of the pathological stage
of lung cancer. They reported that their results were
promising, being able to predict the tumour stages
with high accuracy, especially for lung
adenocarcinoma type of cancer. Another paper on this
topic, from (Kasinathan and Jayakumar, 2022),
presents a cloud-based system and one of its
components is a classifier for staging. They report a
97% accuracy of the model in this task for images
automaticallysegmented. In (Ubaldi et al., 2021),
authors,report a machine learning pipeline that
utilizes open data and radiomic feature extraction for
histological and overall stage classification. They
approached stage classification as a binary problem
between stages I – II and achieved the best results
with a Random Forest (AUC = 0.72 ± 0.04) and
Support Vector Machine (0.84 ± 0.03) classifier.
Interestingly, they also mention that while using 2
datasets, one for training and another for testing, they
obtained better results when they used the 1st dataset
for training and the 2nd for testing, than with the
opposite order. They attributed this to the
misrepresentation of the two classes (stages I-II) for
the 2nd dataset. Indeed, the accuracy of the reference
information and the harmonization requirements may
increase the complexity of the problem.
The goal of our study is to employ radiomic
features, extracted from both healthy and pathological
tissue to develop a machine learning model for the
accurate staging of the lung cancer case. We present
a binary classification scheme, which classifies stage
I and II vs stage III and IV using lung CT imaging
data. We propose the use of tumourcharacteristics
combined with those of both lung lobes for the
characterization of staging. Upon full automation,
this can be a valuable decision support tool for first-
line diagnosis.
Figure 1: Overview of the analysis steps.
preprocessing lung masks
discard invalid data
merge datasests
feature
extraction
radiomics features for tumour
radiomics features for the two
lobes-lung volumes
normalised tumour radiomics
features by lung volume features
relative difference features
b
etween the two lobes
reject near zero variance
feature
selection
iterations and
final
selection
repeat the following in 100 runs
make a train-test split
au
g
ment trainin
g
data
Kruskal-Wallis for statistical
si
g
nificance
reject correlate
d
a
p
ply feature selection (RFE,
Boruta, Scad+L2) per method,
find features consistently chosen
>50% runs
model
building and
model
comparision
100 runs splits
each run CV each of the feature
sets
train/tune models (svm linear,
RF,nnet, dnn, glmnet) and
majority/stacked ensembles
calculate average model
performance metrics for
com
p
arison
BIOSIGNALS 2023 - 16th International Conference on Bio-inspired Systems and Signal Processing
318

2 METHODS
Cancer staging is originally a multiclass problem. In
this work, we reduced it to a 2-class problem. Our
proposed solution makes use of two publicly
available datasets. Thus, the need for harmonization
and the need to synthetically balance and augment the
two classes were two crucial points. An overview of
the proposed approach is presented in Figure 1. To
increase statistical robustness, a repetitive procedure
was chosen for feature selection, and consensus
features were selected. Following model training and
testing were also repeated multiple times, with
different training/testing splits for cross-validation
and external testing, to produce more stable results.
2.1 Data Description
The unified dataset used for the development of the
model is comprised of two datasets available in the
TCIA archive:
The Radiomics dataset (Aerts et al, 2014). It
contains 422 cases of non-small cell lung
cancer (NSCLC). For each case, pre-treatment
CT scans, segmentations of ROIs of the images
and clinical data are included. A manual
delineation by a radiation oncologist of the 3D
volume of the primary gross tumour volume
("GTV-1") and selected anatomical structures
(i.e., lung) are available. The clinical variables
available included age, TNM stages, Overall
stage (inferred from TNM), gender, survival
and other. The overall stage variable includes
data belonging to stages: I, II, III.
The Radiogenomics database. It contains 211
cases of NSCLC (Bakr et al, 2018). It includes
data belonging to classes I to IV. For each case,
CT images and tumour segmentations are
available, together with biological and clinical
data, including among other survival, age,
gender. In this work, lung volume
segmentations were not available, and
therefore we applied the lungmask automated
segmentation pipeline, based on deep learning
(Hofmanninger et al, 2020).
In this work, the stages are grouped in two classes, C0
(I and II subtypes), and C1 (III, and IV subtypes). The
rationale behind this choice is twofold: a) this
distinction reflects the severity and need for different
treatment options, and b) the multiclass problem
would require a much higher number of samples per
class, therefore the simplification to a two-class
problem can lead to a more robust and useful
approach. After rejecting problematic and incomplete
samples, the final unified dataset includes 434
samples: 126 of which from the Radiogenomics
database, and the rest from the Radiomics database.
C0 has 198 samples and C1 has 236 samples, which
include annotations for the tumour volume, left and
right lung lobes, and needed clinical information. The
percentage of stages represented is as follows: Stage
I:147, Stage II:51, Stage III:232, and Stage IV:4.
2.2 Radiomics Features
2.2.1 Calculation of Radiomics Features
We employed radiomics features for the quantitative
description of medical images. The pyradiomics
pipeline (van Griethuysen et al, 2017) was employed
for the calculation of radiomics features from the 3D
volumes, resulting in 1218 features. These
corresponded to features from the original images, the
Laplacian filtered images, and the Wavelet images,
including First Order Statistics, Shape-based (3D and
2D) descriptors, Gray Level Co-occurrence Matrix
(GLCM), Gray Level Run Length Matrix (GLRLM),
Gray Level Size Zone (GLSZM), Neighbouring Gray
Tone Difference Matrix and Gray Level Dependence
Matrix (GLDM).
Using the above-mentioned established pipeline,
we calculated radiomics features for the following
volumes: tumour volume, left lobe volume, right lobe
volume. These volumes were already segmented,
either manually or automatically, as mentioned in
section 2.1. The calculation of features on the
different volumes resulted in the Tu, LVR, and RVR
radiomics vectors, respectively.
2.2.2 Multi-Source Harmonization of
Radiomics Features
Harmonization at image level or feature level is a
necessary step for multisite analysis (Mali et al,
2021), but also analysis of data produced by
modalities of different vendors, to remove unwanted
variation when combining data across scanners and
sites. In the dataset used in this work, two sites and
multiple vendors were identified. The data originating
from vendors with very small representation were
rejected, as harmonization of these data could be
problematic. The chosen approach included the
harmonization of radiomics features with Combat
(Orlhac et al., 2022) method. Specifically, the steps
followed were:
Harmonisation of data from same vendor in the
two databases (batch per database), which
Towards Lung Cancer Staging via ultipositional Radiomics and Machine Learning
319

incorporated most samples coming from the
two databases.
Harmonisation with the remaining data from
other vendors in the two databases (batch per
vendor)
In each step, the Combat pipeline was applied to
the feature set, with batches defined as above, and the
type of volume (e.g. tumour, left lobe, right lobe) as a
confounder. Any non-harmonized features that
presented statistically significant differences between
batches after harmonization were removed, to avoid
any bias related to batch effects.
2.2.3 Feature Extraction
Based on the radiomics of the tumour and those of the
two lung lobes, new features were extracted, to
express the tumour in contrast to background, and the
differences between the two lobes. More specifically,
the feature vectors Tu, LVR, RVR, defined in section
2.2.1, were employed to calculate the normalized
tumour radiomics TuNo, which expresses the tumour
radiomics features Tu divided by the average between
the left and right volume radiomics features (LVR,
RVR). This is expected to normalize the tumour
radiomics values (tumour values with respect to
background values), decrease the inter-subject
variability, and improve the harmonization effort
(Escudero Sanchez et al, 2021). TuNo features were
calculated as in Eq 1.
TuNo =2* Tu/(LVR+RVR) (1)
In addition, the inter-lobe relative difference VRD
was calculated between the radiomics features
vectors RVR and LVR as:
VRD=2*
|
−
|
/(LVR+RVR)
(2)
The VRD feature vector is expected to introduce
information about the environment around the
tumour. We chose to use the whole lobe volumes
instead of a region around the tumour border, to
increase simplicity and support automated pipelines,
rather than options that involve human annotation.
Eventually, the feature vector set available for
feature selection includes the Tu, TuNo and VRD
features, i.e. the tumour features, the normalized
tumour features and the inter-lobe relative
differences.
2.3 Cancer Staging Models
The feature selection and classification model
methodology are described below. One important
point introduced in this work is the need to address
the problem of availability of a large number of
features, also correlated, in a dataset with comparable
dimension. To improve robustness, the procedure is
repeated multiple times. In each time, a different
training and external testing dataset are split, and
average behaviour among repetitions is eventually
considered.
2.3.1 Feature Selection
The challenge in this feature selection was the high
number of features, which are to some extent
correlated.
We considered as pre-processing steps: a)
removing linearly correlated features, b) removing
non statistically significant features based on
kruskall-wallis test (KW) with threshold 0.05/N,
(N=number of features).
Following, for the selection of the most
informative features, we considered three methods,
namely Recursive Feature Elimination (RFE), Boruta
method and SCAD-L2 method (Zeng and Xie, 2014).
Using the above methods, we introduced an
iterative procedure (100 iterations), which included in
each step the following actions:
Formation of a new Training/testing set split
(80%)
In the training set, application of the pre-
processing step for the removal from the
feature list of statistically unsignificant and
correlated features.
Data Augmentation via SMOTE (Chawla et al,
2002) in the training set to balance the classes
and increase the data size
Feature selection with one of the above
methods (RFE, Boruta, SCAD+L2).
Based on the result of the repeated feature selection
procedure, we introduced a voting mechanism to
filter-in the features that were consistently selected in
at least 50% of the iterations. These constitute our
final feature list.
2.3.2 Training Ml Models
These final feature sets were used as inputs in model
training. The classification models employed in this
work were: a) SVM with linear kernel, b) Random
Forest, c) generalized linear model via penalized
maximum likelihood (R package ‘glmnet’)
(Friedman, 2010), d) Stacked Autoencoder Deep
Neural Network (R package ‘deepnet’), e) a majority
voting model, f) an ensemble model based on
generalized linear model (glm) of the above
pretrained models. The train/test split was again
BIOSIGNALS 2023 - 16th International Conference on Bio-inspired Systems and Signal Processing
320
repeated 100 times, and in each repetition, the
following steps took place:
Train/test set split (80%),
Training data Augmentation via SMOTE,
Classification models with internal 5-fold
cross-validation and hyperparameter
optimization,
Test performance metrics in each repetition.
The average test set performance metrics among
the 100 repetitions was calculated and used for further
model comparison.
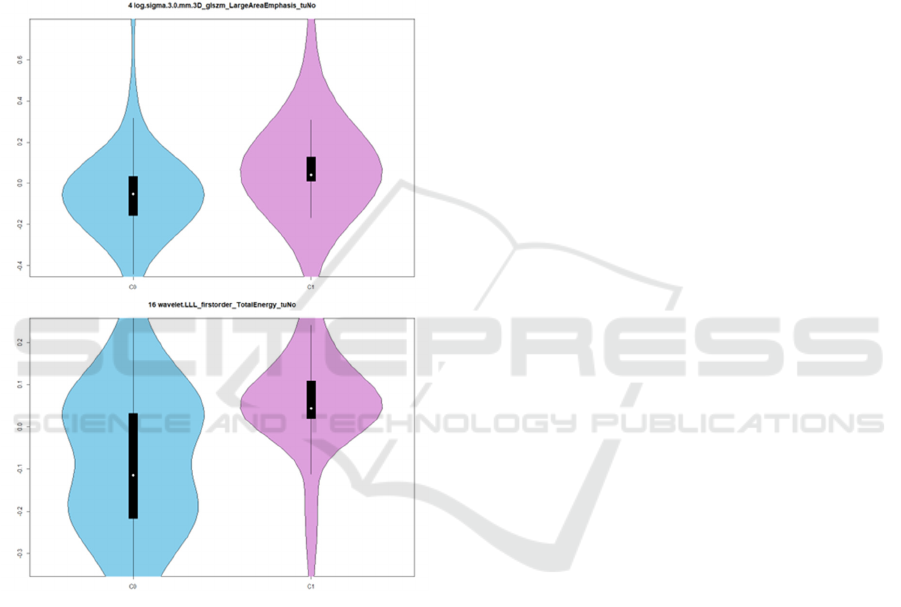
Figure 2: For two TuNo features (log sigma 3.0mm glszm
Large Area Emphasis and wavelet LLL first order Total
Energy), the distribution of values in the two classification
groups, taking into account the whole dataset. "log sigma
3” refers to features calculated after Laplacian filtering with
sigma=3, wavelet LLL refers to low-pass filtering in all
directions.
3 RESULTS
3.1 Selected Features
The procedure started with a large number of features.
The harmonization procedure rejected not well
harmonized features, to avoid the introduction of
unwanted batch bias. Following, after the generation
of the TuNo and VRD features based on tumour and
lung volumes, the number of Tu, TuNo, VRD features
entering the feature selection pipeline was 1418.
Effort was paid to end-up with a smaller number of
important features for model training.
In each feature selection cycle, the pre-processing
step (cross-correlation and KW test) rejected several
features and resulted in a range of around 400
statistically significant features, which constituted the
pool of features for feature selection by RFE or
Boruta or Scad+V2.
Following, based on the intermediate feature
selection sets, i.e. the features selected by each of the
three mechanisms in each of the 100 training set
repetitions described above, the consensus features
for each feature selection method was produced,
including the tumour (Tu), tumour normalized
(TuNo) and relative volume differences (VRD) types
of features. In RFE, 15 features were selected, 9 of
which were TuNo features, and 6 VRD features. The
majority (9/15) was wavelet features, and the rest
were log (based on the Laplacian filtered image). In
Boruta, 368 features were selected, 117/ 177 /74 in
Tu, TuNo and VRD types, respectively. The features
originated from original, log filtered and wavelet-
based images. The SCAD+L2 method resulted in 187
features, with only a small number of features coming
from original images, and 32/117 /38 in Tu, TuNo and
VRD types. Figure 2 depicts the distribution of values
per class for two features.
Overall, these are texture features in their
majority. Most of them belong to the normalized
tumour feature type (TuNo), and some more in the
relative volume difference type (VRD), will only a
few selected features from the initial tumour
radiomics (Tu). This supports the choice for the
“meta-features” introduced in this work. All relative
difference texture features show higher relative
difference in wavelet HHH texture feature values in
C0 than C1, i.e. higher relative difference in the two
lobes in the less metastatic stages. Most tumour
normalized texture values are lower in C0, showing a
clear difference between the tumour and background
in the less severe stages.
3.2 Classification Results
Table I presents test set performance metrics, as
median and quartiles of the test set performance
metrics, repeated 100 times with different train/test
set split. The median precision ranges between 75-
80%, which suggests that when C1 (more severe
class) is predicted, it is in general true, and the False
Towards Lung Cancer Staging via ultipositional Radiomics and Machine Learning
321
Positive is small. The recall is slightly lower (71-
79%), which suggests that there are a few False
Negatives, i.e. some C1 that are not identified, an
issue that needs improvement. The best precision-
recall case is found in the
SCAD+L2-RD method, with
both having values above 77%. It is worth noting that,
as identified by (Webb et al, 1993) and (Wu et al,
2020), an interrater variability exists in the domain
and the clinical staging accuracy and concordance
with pathological values also can improve. The
average balanced accuracy, and its standard
deviations for all classification schemes are presented
in Table II. It can be seen that RF classifier overall
outperforms other schemes.
Table 1: Average Performance Metrics (Median and 1
st
-3
rd
Quartile) in the Test Set. C1: Positive Class.
Sen=Sensitivity, Spec=Specificity, Prec=Precision,
Rec=Recall, BA = Balanced Accuracy. Ens=ensemble
classifier.
Boruta RFE SCAD+L2
Perf RF Ens RF Ens RF Ens
Sen
78.72
70.218
2.98
76.6
71.818
1.38
74.47
70.217
8.72
71.28
65.967
4.47
78.72
72.348
0.85
78.72
72.348
2.98
Spec
71.79
66.677
6.92
69.23
64.107
4.36
78.21
71.798
2.05
76.92
74.368
2.05
74.36
69.237
6.92
71.79
66.677
6.92
Prec
76.47
74.007
9.17
75
71.967
8.05
79.49
76.68
83.72
79.07
76.098
2.61
77.55
75.518
0.85
76.7
73.758
0.12
Rec
78.72
70.218
2.98
76.6
71.818
1.38
74.47
70.217
8.72
71.28
65.967
4.47
78.72
72.348
0.85
78.72
72.348
2.98
F1
77.42
73.458
0.00
76.68
73.287
8.79
76.57
73.338
0.85
74.6
70.817
8.36
77.49
74.148
0.85
77.49
74.167
9.60
BA
74.6
71.96
76.81
72.79
71.16
75.48
75.27
72.078
0.17
73.6
70.687
7.63
75.37
72.977
8.89
74.71
71.637
8.09
The most important feature for the random forest
classification was in the TuNo type, and belonged to
the log filtered image features, expressing texture as
‘glszm Large Area High Gray Level Emphasis’. This
is a measure of the distribution of large area size
zones, with a greater value indicative of more larger
size zones and more coarse textures. In the TuNo
normalised version, a lower value in C0 class would
mean (as depicted in Fig 1), potentially relating also
to the size of the tumour. The most important features
per feature selection method are listed in the
supplementary section.
4 CONCLUSIONS
In the current study, a data-driven approach is
presented towards the development of a classification
model for lung cancer staging.
Radiomic features, applied on CT images during
initial diagnosis, from the tumour volume and the
lung lobe volumes, were selected following three
feature selection methods. These were combined and
used as input in a machine learning model. Most
features selected from each of the three feature
selection methods (RFE, Boruta, SCAD+L2) belong
to the Tumour normalized (TuNo) and relative
volume differences (VRD) types of features, which
shows the virtue of this multipositional radiomics
approach. This can be related to the findings of
(Escudero Sanchez et al, 2021) with respect to
increased robustness of texture features after
normalisation with normal tissue, although in our
case the tissue comes from the tumour organ
environment and cannot be classified as perfectly
healthy. The less severe class (C0) shows higher
relative difference in wavelet texture values among
the two lobes, and lower normalised tumour textural
characteristics. However, as mentioned by
(Demircioğlu, 2022), one cannot conclude with a
minimal number of radiomics as digital biomarkers,
because “Feature relevance in radiomics strongly
depends on the model used” and “Considering
features selected by a single model is misleading”.
Therefore, a more comprehensive approach will be
employed to conclude with the most important
features from multiple models as candidate
biomarkers. With a balanced accuracy of 75 % and a
F1-score 77.5%, the results are quite promising,
although there is still room for improvement.
Although the sample size of the combined dataset
was larger than the ones analysed in similar studies,
we are positive that a larger sample would be
preferable. Thus, we aim to retrain the model with
data from other available open datasets, but also data
collected as part of the INCISIVE project. As a result,
also given the expected heterogeneity of the data
collected from different clinical sites, special
attention will be paid to the improvement of
harmonization techniques, both regarding the raw
imaging data but also the harmonization of radiomic
features.
The novelty of this work compared to other
efforts, lies in the combined use of a unified dataset
from two sources, a set of enhanced features based on
the relative differences of the lungs' and tumour's
radiomic features and a repetitive data split/testing to
eliminate possible variation in the predictive
BIOSIGNALS 2023 - 16th International Conference on Bio-inspired Systems and Signal Processing
322
performance of the model. We strongly believe that
there is room for improvement, therefore we plan to
enrich the dataset by including clinical data, and
features that relate to TNM logic as well as combine
clinical and pathological staging features. Upon
availability of a larger dataset, additional
classification algorithms will be investigated as to
whether they improve the classification results,
before moving to a finer multiclass classification
scheme. Finally, the incorporation of a fairness and
an explainability component is among the necessary
future steps, to ensure better credibility of the
proposed system, and facilitate its validation from a
clinical perspective (or health expert’s) as well as its
deployment in a clinical environment.
Table 2: Average Performance Metrics for all
model combinations. In bold the best performances.
BA = Balanced Accuracy.
Feature set Model Mean
BA
Std BA
RFE Linear SVM 73.78 3.81
RF 76.03 5.11
Dnn 62.22 5.98
Glmnet 73.82 4.08
Majority
ensemble 73.62 4.28
glm ensemble 74.43 5.13
Boruta Linear SVM 66.03 5.53
RF 74.26 5.03
Dnn 68.16 6.14
Glmnet 67.77 5.73
Majority
ensemble 70.80 4.68
glm ensemble 72.61 4.64
SCAD+L2 Linear SVM 68.84 4.60
RF 75.34 4.70
Dnn 69.39 6.00
Glmnet 70.64 4.81
Majority
ensemble 73.18 4.86
glm ensemble 74.78 4.41
ACKNOWLEDGEMENTS
This work was partly funded by EU H2020 project
INCISIVE under grant agreement No 952179.
Thanks to the INCISIVE consortium and especially
the clinical experts for highlighting important lung
cancer clinical challenges as targets for AI research.
REFERENCES
Aerts, H. J. W. L., Velazquez, E. R., Leijenaar, R. T. H.,
Parmar, C., Grossmann, P., Carvalho, S., Bussink, J.,
Monshouwer, R., Haibe-Kains, B., Rietveld, D.,
Hoebers, F., Rietbergen, M. M., Leemans, C. R.,
Dekker, A., Quackenbush, J., Gillies, R. J., & Lambin,
P. (2014). Decoding tumour phenotype by noninvasive
imaging using a quantitative radiomics approach.
Nature Communications, 5(1), 4006.
https://doi.org/10.1038/ncomms5006
Amin, M. B., Greene, F. L., Edge, S. B., Compton, C. C.,
Gershenwald, J. E., Brookland, R. K., Meyer, L., Gress,
D. M., Byrd, D. R., & Winchester, D. P. (2017). The
Eighth Edition AJCC Cancer Staging Manual:
Continuing to build a bridge from a population-based to
a more “personalized” approach to cancer staging: The
Eighth Edition AJCC Cancer Staging Manual. CA: A
Cancer Journal for Clinicians, 67(2), 93–99.
https://doi.org/10.3322/caac.21388
Anagnostopoulos, A. K., Gaitanis, A., Gkiozos, I.,
Athanasiadis, E. I., Chatziioannou, S. N., Syrigos, K.
N., Thanos, D., Chatziioannou, A. N., & Papanikolaou,
N. (2022). Radiomics/radiogenomics in lung cancer:
Basic principles and initial clinical results. Cancers,
14(7). https://doi.org/10.3390/cancers14071657
Bakr, S., Gevaert, O., Echegaray, S., Ayers, K., Zhou, M.,
Shafiq, M., Zheng, H., Benson, J. A., Zhang, W.,
Leung, A. N. C., Kadoch, M., Hoang, C. D., Shrager,
J., Quon, A., Rubin, D. L., Plevritis, S. K., & Napel, S.
(2018). A radiogenomic dataset of non-small cell lung
cancer. Scientific Data, 5(1), 180202.
https://doi.org/10.1038/sdata.2018.202
Chawla, N. V., Bowyer, K. W., Hall, L. O., & Kegelmeyer,
W. P. (2002). SMOTE: Synthetic minority over-
sampling technique. The Journal of Artificial
Intelligence Research, 16, 321–357.
https://doi.org/10.1613/jair.953
Demircioğlu, A. (2022). Evaluation of the dependence of
radiomic features on the machine learning model.
Insights into Imaging, 13(1), 28. https://doi.org/
10.1186/s13244-022-01170-2
Escudero Sanchez, L., Rundo, L., Gill, A. B., Hoare, M.,
Mendes Serrao, E., & Sala, E. (2021). Robustness of
radiomic features in CT images with different slice
thickness, comparing liver tumour and muscle.
Scientific Reports, 11(1), 8262. https://doi.org/
10.1038/s41598-021-87598-w
Towards Lung Cancer Staging via ultipositional Radiomics and Machine Learning
323

Friedman J, Hastie T, Tibshirani R (2010). Regularization
Paths for Generalized Linear Models via Coordinate
Descent. Journal of Statistical Software, 33(1), 1-22.
URL https://www.jstatsoft.org/v33/i01/
Hofmanninger, J., Prayer, F., Pan, J., Röhrich, S., Prosch,
H., & Langs, G. (2020). Automatic lung segmentation
in routine imaging is primarily a data diversity problem,
not a methodology problem. European Radiology
Experimental, 4(1), 50. https://doi.org/10.1186/s41747-
020-00173-2
Kasinathan, G., & Jayakumar, S. (2022). Cloud-based lung
tumor detection and stage classification using deep
learning techniques. BioMed Research International,
2022, 4185835. https://doi.org/10.1155/2022/4185835
Mali SA, Ibrahim A, Woodruff HC, Andrearczyk V, Müller
H, Primakov S, Salahuddin Z, Chatterjee A, Lambin P.
(2021) Making Radiomics More Reproducible across
Scanner and Imaging Protocol Variations: A Review of
Harmonization Methods. Journal of Personalized
Medicine; 11(9):842.
https://doi.org/10.3390/jpm11090842
Orlhac, F., Eertink, J. J., Cottereau, A.-S., Zijlstra, J. M.,
Thieblemont, C., Meignan, M., Boellaard, R., & Buvat,
I. (2022). A guide to ComBat harmonization of imaging
biomarkers in multicenter studies. Journal of Nuclear
Medicine: Official Publication, Society of Nuclear
Medicine, 63(2), 172–179. https://doi.org/10.2967/
jnumed.121.262464
Rami-Porta, R., Crowley, J. J., & Goldstraw, P. (2009). The
revised TNM staging system for lung cancer. Annals of
Thoracic and Cardiovascular Surgery: Official Journal
of the Association of Thoracic and Cardiovascular
Surgeons of Asia, 15(1), 4–9.
Raz, D. J., Zell, J. A., Ou, S.-H. I., Gandara, D. R., Anton-
Culver, H., & Jablons, D. M. (2007). Natural history of
stage I non-small cell lung cancer: implications for
early detection. Chest, 132(1), 193–199.
https://doi.org/10.1378/chest.06-3096
Siegel, R. L., Miller, K. D., Fuchs, H. E., & Jemal, A.
(2022). Cancer statistics, 2022. CA: A Cancer Journal
for Clinicians, 72(1), 7–33. https://doi.org/10.3322/
caac.21708
Thandra, K. C., Barsouk, A., Saginala, K., Aluru, J. S., &
Barsouk, A. (2021). Epidemiology of lung cancer.
Contemporary Oncology (Poznan, Poland), 25(1), 45–
52. https://doi.org/10.5114/wo.2021.103829
Ubaldi, L., Valenti, V., Borgese, R. F., Collura, G.,
Fantacci, M. E., Ferrera, G., Iacoviello, G., Abbate, B.
F., Laruina, F., Tripoli, A., Retico, A., & Marrale, M.
(2021). Strategies to develop radiomics and machine
learning models for lung cancer stage and histology
prediction using small data samples. Physica Medica:
PM: An International Journal Devoted to the
Applications of Physics to Medicine and Biology:
Official Journal of the Italian Association of
Biomedical Physics (AIFB)
, 90, 13–22.
https://doi.org/10.1016/j.ejmp.2021.08.015
van Griethuysen, J. J. M., Fedorov, A., Parmar, C., Hosny,
A., Aucoin, N., Narayan, V., Beets-Tan, R. G. H.,
Fillion-Robin, J.-C., Pieper, S., & Aerts, H. J. W. L.
(2017). Computational radiomics system to decode the
radiographic phenotype. Cancer Research, 77(21),
e104–e107. https://doi.org/10.1158/0008-5472.can-17-
0339
Webb, W. R., Sarin, M., Zerhouni, E. A., Heelan, R. T.,
Glazer, G. M., & Gatsonis, C. (1993). Interobserver
variability in CT and MR staging of lung cancer.
Journal of Computer Assisted Tomography, 17(6),
841–846. https://doi.org/10.1097/00004728-19931100
0-00001
Wu, D. Y., Spangler, A. E., Vo, D. T., de Hoyos, A., &
Seiler, S. J. (2020). Simplified, standardized methods to
assess the accuracy of clinical cancer staging. Cancer
Treatment and Research Communications, 25(100253),
100253. https://doi.org/10.1016/j.ctarc.2020.100253
Yu, L., Tao, G., Zhu, L., Wang, G., Li, Z., Ye, J., & Chen,
Q. (2019). Prediction of pathologic stage in non-small
cell lung cancer using machine learning algorithm
based on CT image feature analysis. BMC Cancer,
19(1), 464. https://doi.org/10.1186/s12885-019-5646-9
Zeng, L., & Xie, J. (2014). Group variable selection via
SCAD-L2. Statistics, 48(1), 49–66. https://doi.org/
10.1080/02331888.2012.719513
BIOSIGNALS 2023 - 16th International Conference on Bio-inspired Systems and Signal Processing
324
