
Patterns in Pupillary Diameter Variation While Reading Portuguese
Language Texts
Jo
˜
ao Vitor Macedo Romera
a
, Rafael Nobre Orsi
b
and Carlos Eduardo Thomaz
c
Departamento de Engenharia El
´
etrica, Centro Universit
´
ario FEI, Avenida Humberto de Alencar Castelo Branco, Brazil
Keywords:
Pupil, Cognition, Meares-Irlen Syndrom, Signal Processing.
Abstract:
This work investigates patterns of pupil diameter variation during text reading based on the effects of Meares-
Irlen Syndrome (MIS) using eye tracking information to estimate the mental workload required. The results
show that there is an increase in the mental workload at times when the texts presented had greater intensity
of visual distortion and that it is possible to linearly classify the data by multivariate statistical techniques,
disclosing experimentally the implicit difficulty in such reading context.
1 INTRODUCTION
An ability to read involves countless cognitive pro-
cesses, from the acquisition of visual information by
the eyes to the cognitive processing of information
by the brain (Orsi et al., 2019). However, an abil-
ity to read is only executed efficiently if all cognitive
processes function properly. If there are failures in
any process, the subject may present difficulties when
performing the reading task, as is the case of Meares-
Irlen Syndrome (MIS) (Irlen, 1990), a sensory defi-
ciency that affects the acquisition of visual informa-
tion, resulting in low reading performance because of
visual distortions, reflecting in problems in the learn-
ing process, especially during the childhood.
With the advance of science and technology, it has
become possible to analyze and model the processes
required for the execution of the reading task, en-
abling deeper analyses of how it works, revealing pos-
sible anomalies in the functioning of some of those
processes for those individuals who present difficul-
ties in reading. A novel and recent analysis that can
be considered is the pupil diameter analysis, an invol-
untary signe which directly reflects the mental effort
demanded during the execution of any task.
The present work focuses on analyzing the pupil
diameter variation during the reading of texts that
simulate the visual effects of MIS, investigating the
relationship between pupil diameter and the quality of
a
https://orcid.org/0000-0002-9331-8880
b
https://orcid.org/0000-0003-4719-0131
c
https://orcid.org/0000-0001-5566-1963
the information presented in the text, in order to esti-
mate the mental effort required in reading tasks for
those with MIS.
2 FUNDAMENTAL CONCEPTS
This section presents the fundamental concepts for
understanding the effects caused by MIS that inspired
the experiment and the analysis of mental effort by
measuring pupil diameter.
2.1 Meares-Irlen Syndrom (MIS)
MIS is described as a disorder that affects the per-
ception of visual stimuli and causes scene distor-
tion, affecting mainly the ability to read, which be-
comes slow and discontinuous (Irlen, 1990). The in-
dividuals who suffer most from these consequences
are mainly children who are during the learning pro-
cess, reflecting low school performance and difficul-
ties in interpersonal relationships (Soares and Gon-
tijo, 2016). Besides social issues, people with this
syndrome also report eye irritation, hypersensitivity
to light, headaches, and visual stress (Irlen, 1990).
It is estimated that 45% of people with reading dif-
ficulties have a positive diagnosis for the syndrome,
so it is often confused with other deficits that influ-
ence reading ability, such as Dyslexia and ADHD.
(Bicalho et al., 2015).Because of this, the identifica-
tion of the syndrome becomes a difficult task, mainly
because it is still identified through psychological
Romera, J., Orsi, R. and Thomaz, C.
Patterns in Pupillary Diameter Variation While Reading Portuguese Language Texts.
DOI: 10.5220/0011781300003411
In Proceedings of the 12th International Conference on Pattern Recognition Applications and Methods (ICPRAM 2023), pages 509-516
ISBN: 978-989-758-626-2; ISSN: 2184-4313
Copyright
c
2023 by SCITEPRESS – Science and Technology Publications, Lda. Under CC license (CC BY-NC-ND 4.0)
509

procedures, such as comprehension and efficiency in
reading text, which considers very simplistic quanti-
tative metrics like the count of words read per minute
(Irlen, 1990).
There are still few studies that identify the dis-
criminating characteristics present in the ocular signs
of people with the syndrome (Romera et al., 2019)
(Guimar
˜
aes et al., 2020) (de Faria, 2011). However,
recent approaches that explore eye-tracking tools are
presenting new findings on the behavior of individuals
with the syndrome, making it possible to identify pat-
terns from data such as eye movements, regressions,
saccades and pupil diameter changes (Romera et al.,
2019).
2.2 Mental Effort and Pupillary
Measurement
The human eye is composed of several parts that, by
means of visible light, capture the visual informa-
tion present in the environment. One of these parts
is the pupil, which is an orifice through which light
enters and which has a diameter that can be regulated
by two iris muscles: the sphincter muscle, which is
innervated by the parasympathetic part of the ANS
(Autonomic Nervous System) and is responsible for
pupil constriction, and the dilator muscle, which is
innervated by the sympathetic part of the ANS and
is responsible for pupil dilation (Marieb and Hoehn,
2007). The constriction and dilation are caused by
two factors: (1) to control the luminosity that enters
the eye, protecting the photoreceptor cells present in
the retina, which are responsible for sending informa-
tion by means of electrical impulses to the brain via
the optic nerves and, (2) by an involuntary reflex of
the ANS during the transition between states of at-
tention and rest that regulate the amount of informa-
tion captured by the eyes (Beatty et al., 2000)(Senior
et al., 2010)(Bremner, 2012). For the second case,
the pupil diameter signals can become a signal that
indicates the individual’s mental states, reflecting the
mental effort required to perform some task. In the
case of increased mental effort, the pupil reveals the
state of attention, receiving the ANS sympathetic sig-
nal for pupil dilation, acquiring a larger amount of vi-
sual information while performing the task, whereas
in the case of decreased cognitive effort, the pupil re-
veals the state of rest and energy saving, receiving a
parasympathetic signal for pupil constriction, acquir-
ing a smaller amount of visual information, as shown
in Figure 1 (Orsi et al., 2019).
Figure 1: Iris muscles. Adapted from (Marieb and Keller,
2011).
3 METHODS
This section describes the set of materials and meth-
ods used to perform the experiment and to process the
pupil signal, divided into 7 subsections: visual stim-
ulus; reading experiment; signal acquisition, signal
preprocessing, image preprocessing, frequency do-
main analisys and pattern recognition.
3.1 Visual Stimulus
From reports of individuals with the syndrome, the
most common visual distortions during the reading of
static texts are blurry and washout (Irlen, 2005). The
initial phase of the experiment consisted in generating
videos simulating these effects, to be later presented
to volunteers on a computer screen equipped with an
eye-tracking device. To perform this step, a code was
developed in the R language, using the image process-
ing library ”Magick” that generated a dynamic anima-
tion in .avi format that distorted cyclically from the
insertion of a text as input, intensifying and smooth-
ing within periods of time. The texts selected were
children’s stories with a low level of complexity so
that there would be no bias in less skilled individuals
or those with little grammatical knowledge.
The results were two videos, each simulating a
different visual distortion (blurry and washout) that
a voluntary person can perceive when reading a static
text, as presented in Figures 2 and 3.
The intensity of the effects was defined with a dis-
tortion parameter, ranging from 0 to 1, where 0 is the
scale with no visual distortion and 1 is the maximum
visual distortion.
3.2 Reading Experiment
The experiment included 70 participants, 30 men and
40 women, all healthy and cognitively able. In ad-
ICPRAM 2023 - 12th International Conference on Pattern Recognition Applications and Methods
510
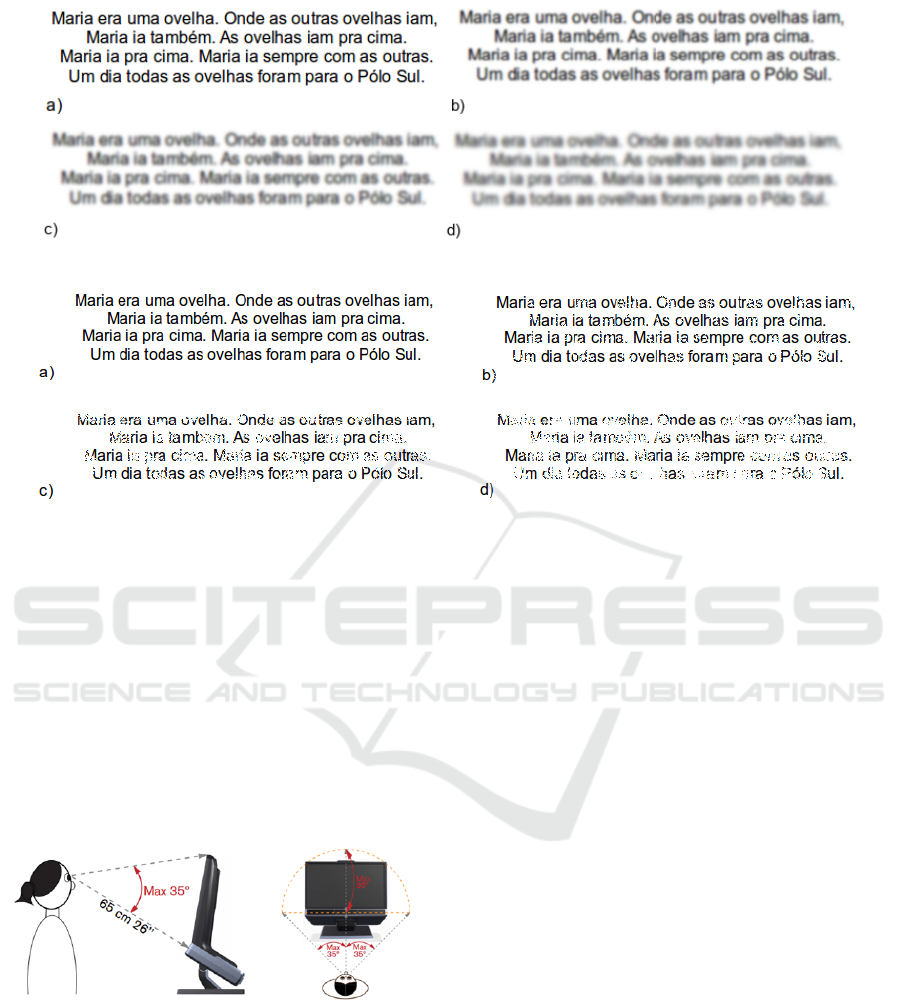
Figure 2: Coded Blurry effect.
Figure 3: Coded Washout effect.
dition, the sample had a mean age of 17.89 years
and a standard deviation of 7.95 years. The sample
went through a filtering stage, selecting only adoles-
cent participants, aged between twelve and eighteen
years old (Federal, 1990), resulting in a sample with
50 signals with a mean age of 16.9 years and a stan-
dard deviation of 6.82 years.
The initial phase of the experiment consisted of
settling the participant in, instructions for performing
the steps of the experiment, and calibration of the eye-
tracking equipment (Tobii TX 300), as presented in
Figure 4.
Figure 4: Calibration example of eye-tracking equipment
(Orsi et al., 2019).
The experiment had 3 stages, and in each stage
a text containing a visual effect was presented, fol-
lowed by an inferential question to make sure that the
volunteer really read the text. In the first stage the
text without visual distortion was always presented
so that the natural reading pattern of each volunteer
could be identified. Then the other texts were pre-
sented with the simulated distortion effects. The texts
had a predefined display time, 32 seconds for the text
without any effect, 32 seconds for the text with blurry
effect (oscillating every 8 seconds), and 36 seconds
for the text with washout effect (oscillating every 9
seconds). The display periods were defined based on
the average reading time of each text obtained empir-
ically, through tests performed in the laboratory. The
questions referring to the text had a free time for an-
swering, and they were asked to be answered verbally.
As soon as the volunteer verbalized the answer, an in-
structor wrote down the answer and asked the partici-
pant to press any key on the keyboard in front of him
to begin the next step of the experiment.
3.3 Signal Acquisition
The signal acquisition was performed indoors with ar-
tificially controlled lighting within the optimum spec-
ifications between 300 and 1000 lux (Bergstrom and
Schall, 2014). The equipment used was the Tobii
TX300 eye-tracker along with a notebook computer
with a Core i7 processor and 16 Gb of RAM and Win-
dows 7 operating system.
3.4 Signal Preprocessing
After the acquisition step, all signals are exported
individually from Tobii Studio, which is the official
software of the eye tracking equipment used. Then a
Patterns in Pupillary Diameter Variation While Reading Portuguese Language Texts
511
code developed in Python programming language is
used to extract the pupil diameter measurements of
each participant during the reading of each text, gen-
erating 3 signals for each participant, resulting in a
total of 150 pupil signals, being 50 signals for each
effect (Neutral, Blurry and Washout). Considering
that during the reading experiment the participants
blinked, the signal is preprocessed by means of lin-
ear interpolation and, after the interpolation step, the
signals are smoothed using the Savitzky-Golay filter
of order 2 with window size 200 (Savitzky and Go-
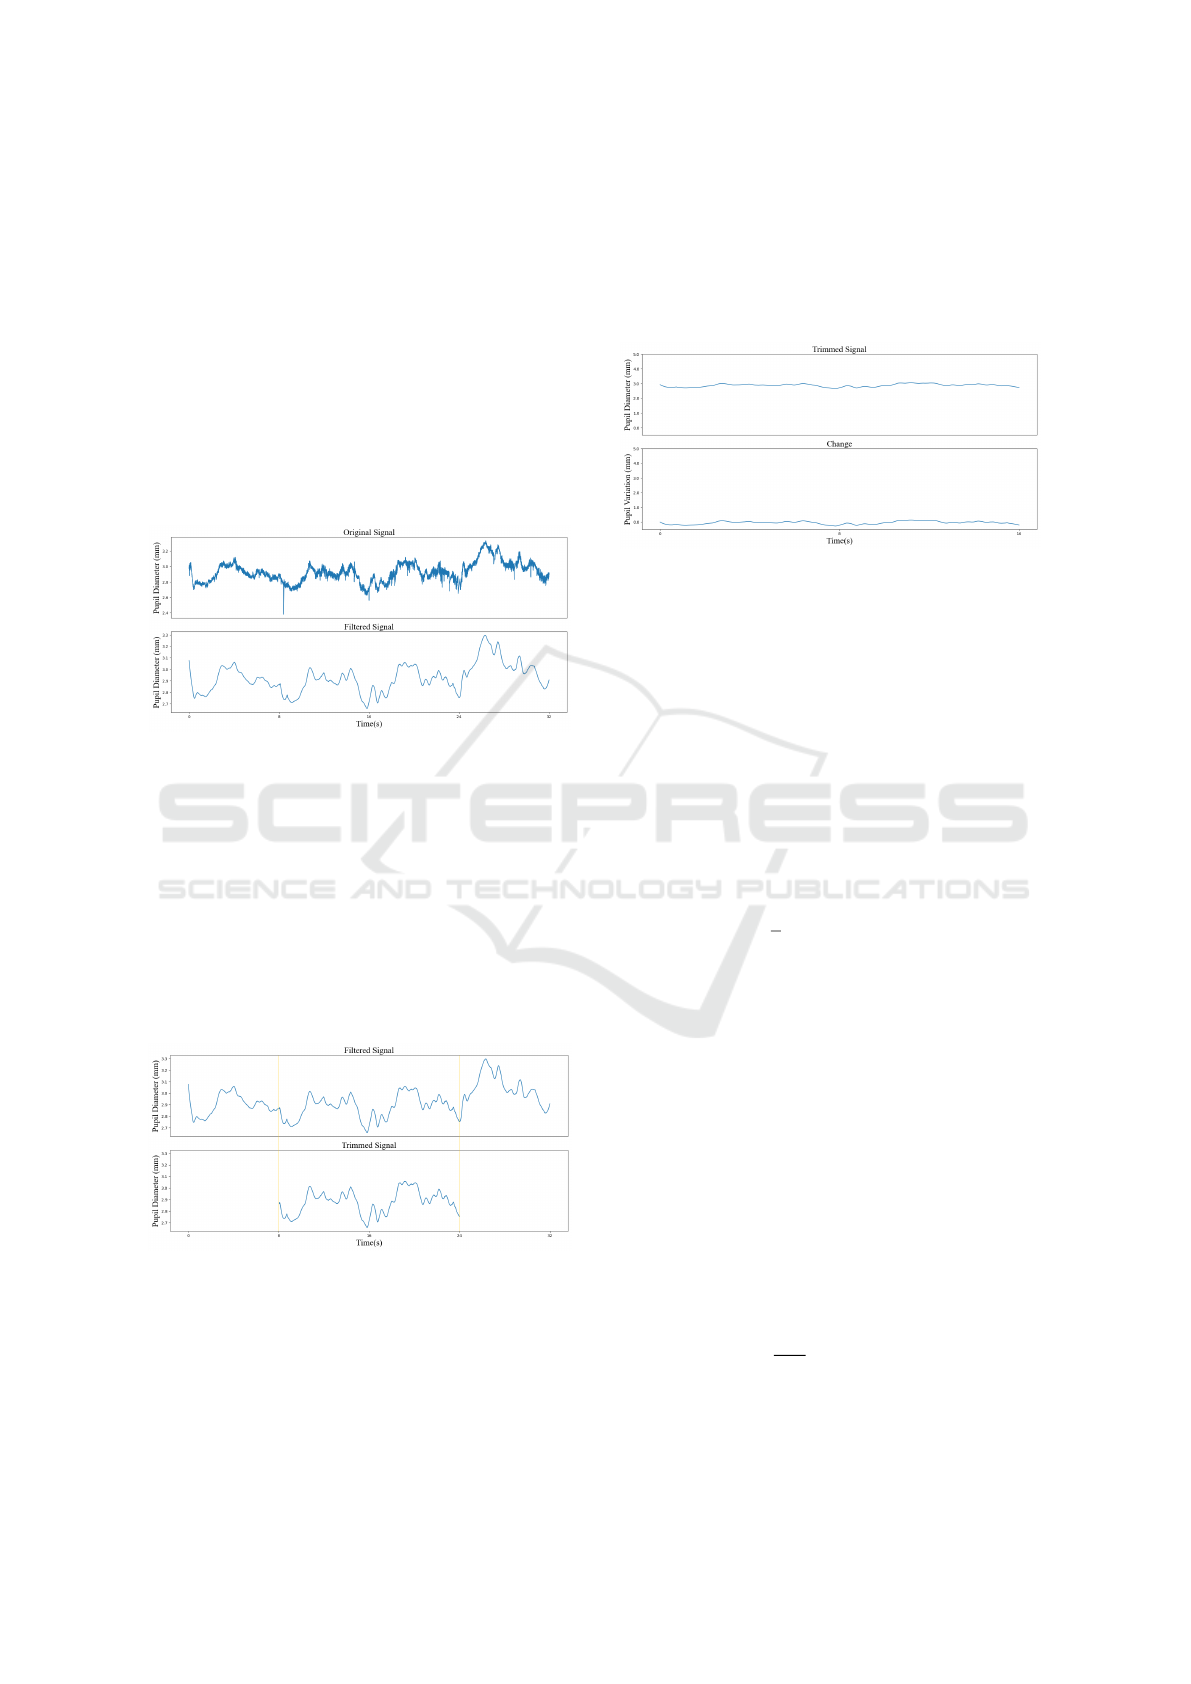
lay, 1964). Figure 5 shows the original signal from a
participant captured by the eye tracker and the filtered
signal, as an example.
Figure 5: Comparison of original and filtered signals.
After the filtering stage, the signals go through a
cut-off stage, removing the periods of the first and
last cycles, resulting in signals of 16 seconds for the
”Neutral” and ”Blurry” effects and 18 seconds for the
”Washout” effect. This cut-off is due to the pupil con-
striction effect at the beginning of each text reading,
originated by the contrast change on the eye tracker
screen, and by the noise present at the end of each
signal, originated by participants who finished read-
ing before the text presentation period was over. Fig-
ure 6 shows the result of this step.
Figure 6: Comparison of filtered and trimmed signals.
The proposed pupil variation analysis was per-
formed by averaging all signals of each stage of the
experiment (Neutral, Blurry and Washout) to identify
patterns in pupil diameter during the oscillations of
the effects. For this, another data processing step was
performed to obtain the normalized signal that con-
siders the change in pupil size from the first measure-
ment of the first sample, so that the natural pupil size
variables of each participant were excluded, subtract-
ing the value of the first acquisition from the rest of
each signal, obtaining a signal that always starts at
zero, as shown in Figure 7.
Figure 7: Change comparison.
3.5 Image Preprocessing
In addition to obtaining the change, the variance of
the Laplacian of each frame of the videos generated
with the visual distortions was calculated, so that they
could be compared with the averages of the signals
of each effect. Considering the frame image as I, of
dimensions m and n, the method consists in applying
the second derivative to detect negative edges in the
image passing at high frequencies. The Laplacian op-
erator can be approximated using the following mask
(Pech-Pacheco et al., 2000):
L =
1
6
0 −1 0
−1 4 −1
0 −1 0
(1)
Then the sum of all absolute values is calculated,
to group the data at each point:
LAP(I) =
M
∑
m
N
∑
n
|L(m, n)| (2)
where L(m, n) is the convolution of the frame image,
using the mask L.
Then the variance of the absolute values is calcu-
lated, as shown below:
LAPVAR(I) =
M
∑
m
N
∑
n
[|L(m, n)| −
¯
L]
2
(3)
where the mean is given by:
¯
L =
1
NM
M
∑
m
N
∑
n
|L(m, n)| (4)
The values were related to the distortion variable
presented earlier to control the intensity of the effects,
ICPRAM 2023 - 12th International Conference on Pattern Recognition Applications and Methods
512
being adapted to ”1” (maximum value, text with the
most visual distortion) and ”0” (minimum value, text
without any visual distortion). The values obtained
in each frame were also organized graphically, so that
the cycles of distortions could be observed. In ad-
dition, the frames acquisitions during the experiment
were transformed to the time scale.
Finally, the obtained signal also goes through a
cutoff step, removing the periods of the first and last
cycles, resulting in 16 second signals for the ”Neu-
tral” and ”Blurry” effects and 18 seconds for the
”Washout” effect, just as in the pupil signal prepro-
cessing step.
3.6 Frequency Domain Analysis
From the data obtained in subsection 3.4 (Signal Pre-
processing), the pupillary signals are separated by vi-
sual effect category, originating 3 groups, each with
50 signals, representing the signals acquired in the
texts with ”Neutral”, ”Blurry” and ”Washout” effects,
respectively. From these groups, the signals are orga-
nized into three matrices, where each row represents
an individual signal and each column an eye tracker
acquisition. From these matrices, each column is av-
eraged, storing each average value in an index of a
vector of the same dimension as the preprocessed sig-
nals. The result is three vectors that contain the av-
erage of the signals in each group, enabling graphical
analysis.
From the average signals of each group and the
signals of the visual effects cycles obtained in subsec-
tion 3.5 (Image Preprocessing), the frequency domain
analysis of the signals is performed, by applying the
Fast Fourier Transform (FFT), a fast algorithm for op-
timization of the Discrete Fourier Transform (DFT), a
tool that performs the frequency analysis for discrete
signals, to obtain the frequency spectra. The defini-
tion of the DFT is presented in the following equa-
tion:
X(m) =
N-1
∑
n=0
x(n)e
i2πnm
N
(5)
where x(n) constitutes the set of points representing
the signal in time and N is the number of sampled
points. Moreover, m is given by:
m = 0, 1, 2, 3, ..., N − 1 (6)
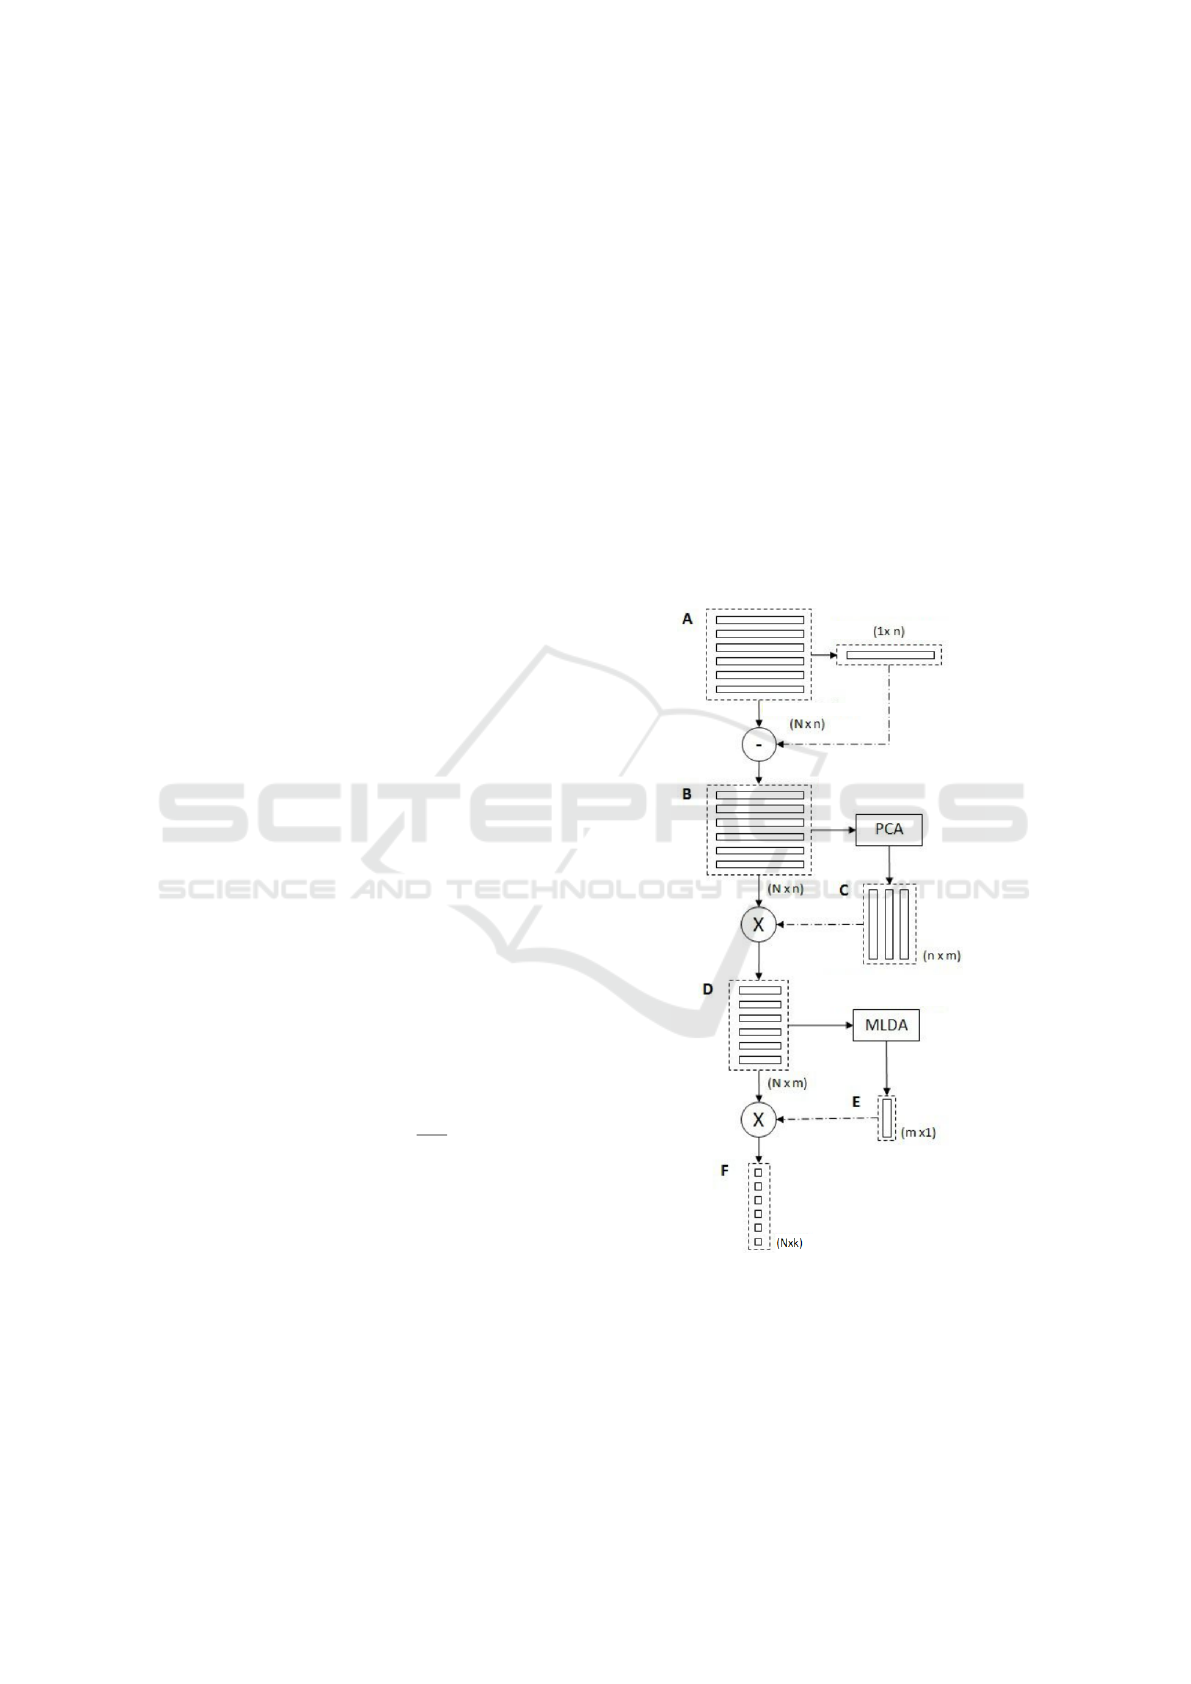
3.7 Pattern Recognition
In the pattern recognition step, a multivariate statisti-
cal technique consisting of reducing the dimensional-
ity of the data (PCA) (Abdi and Williams, 2010) and
applying Maximum Uncertainty Linear Discriminant
Analysis (MLDA) (Thomaz et al., 2007) is imple-
mented to extract the discriminant information from
the pupillary signals.
Initially, the data are organized in a matrix of di-
mension Nxn, in which N represents the total num-
ber of pupillary signals, having dimension 150 and
n represents the size of pupillary signals, having di-
mension 4800 (the signal of the ”Washout” group is
compressed). It is then averaged and subtracted from
all values, resulting in a matrix with zero average sig-
nal. Next, the PCA technique is applied to reduce
the dimensionality of the data, obtaining the principal
components matrix nxm. This matrix is used as input
to calculate the discriminant eigenvectors of MLDA,
obtaining a Nxk matrix with the most discriminant
characteristics of each of the N input signals. This
technique is presented in the diagram of Figure 8.
Figure 8: PCA + MLDA diagram.
4 RESULTS
The results of the comparison between the averages
of the visual signals and cycles for each step of the
Patterns in Pupillary Diameter Variation While Reading Portuguese Language Texts
513
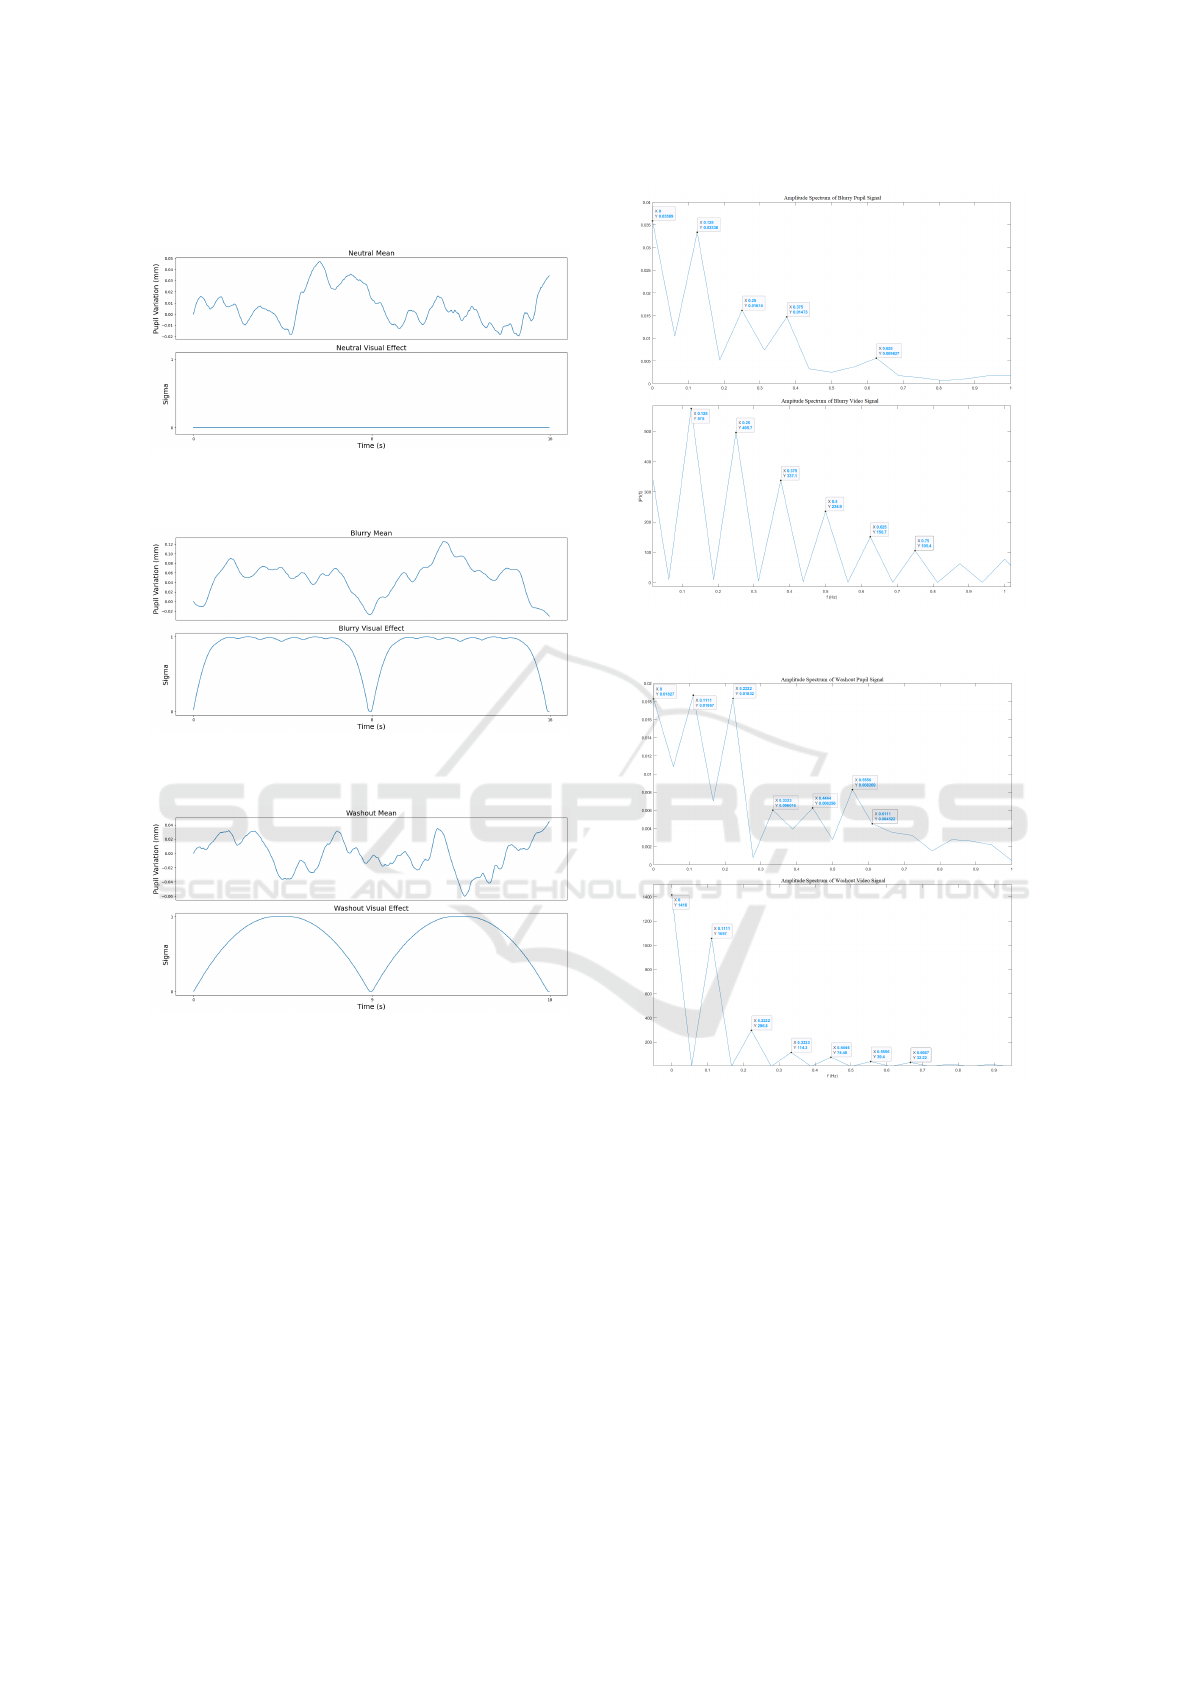
experiment are presented in Figures 9, 10 and 11 be-
low.
Figure 9: Comparison of Neutral mean signal and Neutral
visual effect.
Figure 10: Comparison of Blurry mean signal and Blurry
visual effect.
Figure 11: Comparison of Washout mean signal and
Washout visual effect.
The results of the frequency analyses of the aver-
ages of the ”Blurry” and ”Washout” signals and the
visual cycle signals of the respective effects are pre-
sented in Figures 12 and 13. The frequency domain
analysis of the ”Neutral” effect has no comparison
because no distortions were present in the presented
text.
The values noted in the spectrum represent the fre-
quency of the harmonic components (X) and ampli-
tude of the same components (Y).
Table 1 show the correlation between the average
signals.
The results of the statistical pattern recognition
step, using PCA and MLDA are presented below in
2D and 1D geometric forms (scatter) in Figures 14
Figure 12: Frequency domain analysis for Blurry pupil sig-
nal and Blurry visual effect.
Figure 13: Frequency domain analysis for Washout pupil
signal and Washout visual effect.
and 15. Figure 16 shows the confusion matrix be-
tween the classes, in which they are represented by:
Neutral (1), Blurry (2) and Washout (3).
The overall accuracy of the classification using the
methods described in subsection 3.7 showed an aver-
age accuracy of 66.67%.
5 DISCUSSION
As presented in Figures 9, 10 and 11, it is possible to
note that for the Neutral effect, there were no cyclical
ICPRAM 2023 - 12th International Conference on Pattern Recognition Applications and Methods
514
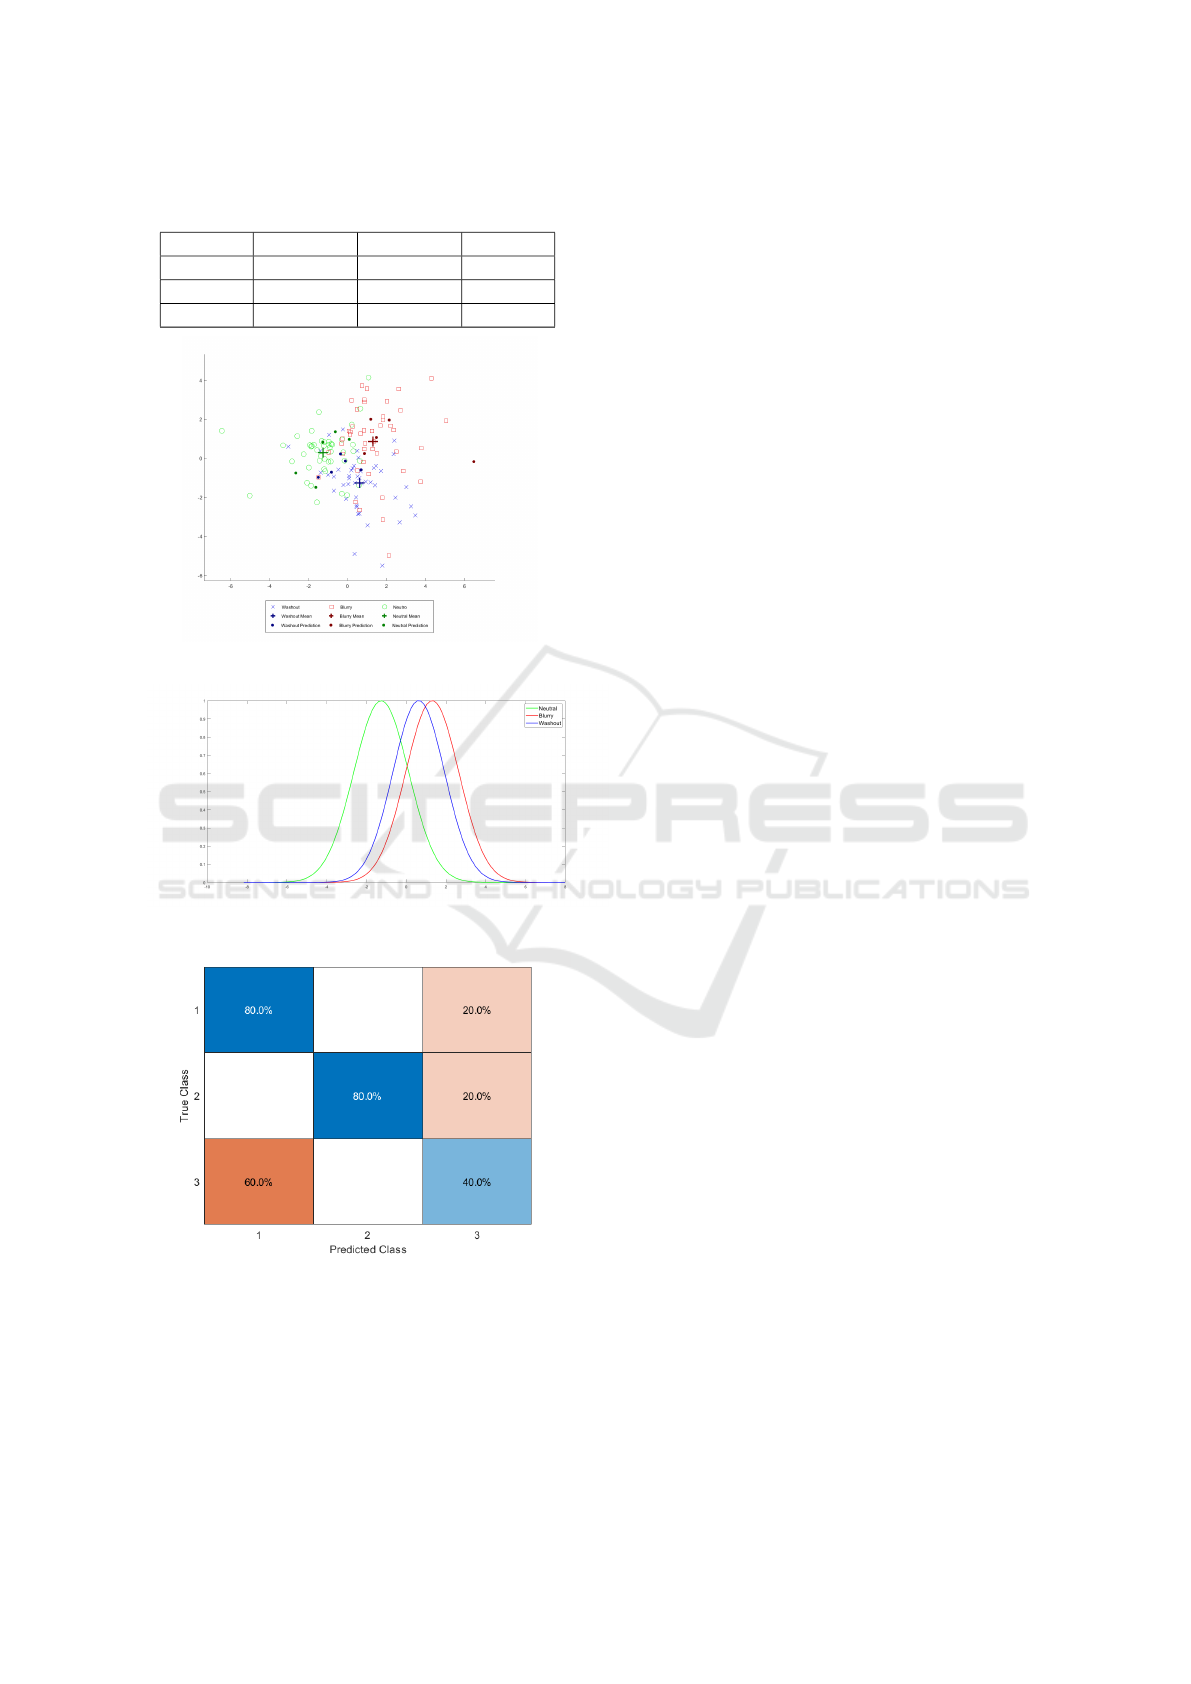
Table 1: Correlation between the average signals.
Neutral Blurry Washout
Neutral 1 3.8e-2018 0
Blurry 3.8e-2018 1 0
Washout 0 0 1
Figure 14: Dispersion relations for the three classes.
Figure 15: Dispersion curves.
Figure 16: Confusion Matrix.
variations during the reading of the text. However, for
the Blurry and Washout effects, it is possible to notice
a cyclical behavior of the pupil diameter, varying in
relation to the intensity of each effect.
This relationship can also be observed in the spec-
tra of the signals, shown in Figures 12 and 13. The
pupil signals present fundamental harmonics with the
same value, defining exactly the oscillation cycle of
the visual effects. Furthermore, it is possible that the
harmonics needed to reconstruct the signal coincide,
varying only in amplitude.
For the Blurry effect, the increase in pupil diam-
eter is due to increased difficulty in reading the text,
which, when it reaches its maximum value, still al-
lows reading, but with much greater difficulty, indi-
cating increased attention and consequently increased
mental effort required to complete the task (Hess and
Polt, 1960) (Kahneman and Beatty, 1966) (Schluroff,
1982). For the Washout effect, the reduction in pupil
diameter is due to the impossibility of reading at the
moment when the text reaches its maximum value,
indicating a state of rest and, consequently, a reduc-
tion in the mental effort required during these periods
(Kahneman et al., 1967).
In the pattern recognition results, presented in Fig-
ures 14 and 15, the method did not show high classi-
fication accuracy, however, from Figure 15 it is pos-
sible to observe that the dispersion curve of the sig-
nals of the ”Neutral” class stands out from the disper-
sion curves of the other classes, concluding that the
pupillary signal during the reading of a text with vi-
sual effects has discriminating characteristics of the
pupillary signals during the reading of texts without
any effects.
In future work, it is intended to compare with
other methods given that the present work was a first
analysis of pattern identification in the context of
pupil variation in MIS.
ACKNOWLEDGEMENTS
The authors would like to acknowledge the support of
CAPES (funding code 001). Additionally, the authors
would like to thank all the volunteers participating in
the experiment.
REFERENCES
Abdi, H. and Williams, L. J. (2010). Principal component
analysis. Wiley interdisciplinary reviews: computa-
tional statistics, 2(4):433–459.
Beatty, J., Lucero-Wagoner, B., et al. (2000). The pupillary
system. Handbook of psychophysiology, 2(142-162).
Bergstrom, J. R. and Schall, A. (2014). Eye tracking in user
experience design. Elsevier.
Bicalho, L. F., de ALMEIDA, M. Z. T., Guimaraes, M. R.,
Silva, J. R. G., and Fully, F. (2015). S
´
ındrome de irlen:
Um olhar atendo sobre o funcionamento cerebral du-
Patterns in Pupillary Diameter Variation While Reading Portuguese Language Texts
515

rante a leitur. Acta Biomedica Brasiliensia, 6(1):35–
44.
Bremner, F. D. (2012). Pupillometric evaluation of the dy-
namics of the pupillary response to a brief light stim-
ulus in healthy subjects. Investigative ophthalmology
& visual science, 53(11):7343–7347.
de Faria, L. N. (2011). Frequ
ˆ
encia da s
´
ındrome de meares-
irlen entre alunos com dificuldades de leitura obser-
vadas no contexto escolar.
Federal, G. (1990). Estatuto da crianc¸a e do adolescente.
Lei federal, 8.
Guimar
˜
aes, M. R., Vilhena, D. d. A., Loew, S. J., and
Guimar
˜
aes, R. Q. (2020). Spectral overlays for read-
ing difficulties: oculomotor function and reading ef-
ficiency among children and adolescents with visual
stress. Perceptual and Motor Skills, 127(2):490–509.
Hess, E. H. and Polt, J. M. (1960). Pupil size as re-
lated to interest value of visual stimuli. Science,
132(3423):349–350.
Irlen, H. (2005). Reading by the colors: Overcoming
dyslexia and other reading disabilities through the
Irlen method. Penguin.
Irlen, H. L. (1990). Method and apparatus of treatment of
symptoms of the irlen syndrom. US Patent 4,961,640.
Kahneman, D. and Beatty, J. (1966). Pupil diameter and
load on memory. Science, 154(3756):1583–1585.
Kahneman, D., Beatty, J., and Pollack, I. (1967). Perceptual
deficit during a mental task. Science, 157(3785):218–
219.
Marieb, E. N. and Hoehn, K. (2007). Human anatomy &
physiology. Pearson education.
Marieb, E. N. and Keller, S. (2011). Essentials of Human
Anatomy and Physiology: Books a la Carte Edition.
Benjamin-Cummings.
Orsi, R. N., Fabbro, D. A. D., and Thomaz, C. E. (2019).
Eye-tracking data analysis during cognitive task. In
Latin American Workshop on Computational Neuro-
science, pages 200–219. Springer.
Pech-Pacheco, J. L., Crist
´
obal, G., Chamorro-Martinez, J.,
and Fern
´
andez-Valdivia, J. (2000). Diatom autofocus-
ing in brightfield microscopy: a comparative study. In
Proceedings 15th International Conference on Pattern
Recognition. ICPR-2000, volume 3, pages 314–317.
IEEE.
Romera, J. V. M., Orsi, R. N., Maia, R. F., and Thomaz,
C. E. (2019). Visual patterns in reading tasks: an eye-
tracking analysis of meares-irlen syndrome simulation
effects. In Anais do XV Workshop de Vis
˜
ao Computa-
cional, pages 131–136. SBC.
Savitzky, A. and Golay, M. J. (1964). Smoothing and dif-
ferentiation of data by simplified least squares proce-
dures. Analytical chemistry, 36(8):1627–1639.
Schluroff, M. (1982). Pupil responses to grammatical com-
plexity of sentences. Brain and language, 17(1):133–
145.
Senior, K. R. et al. (2010). The eye: the physiology of hu-
man perception. The Rosen Publishing Group, Inc.
Soares, F. A. and Gontijo, L. S. (2016). Production of
knowledge: genetic basis, biochemical and immuno-
logical of meares-irlen syndrome. Revista Brasileira
de Oftalmologia, 75:412–415.
Thomaz, C. E., Boardman, J. P., Counsell, S., Hill, D. L.,
Hajnal, J. V., Edwards, A. D., Rutherford, M. A.,
Gillies, D. F., and Rueckert, D. (2007). A multi-
variate statistical analysis of the developing human
brain in preterm infants. Image and Vision Comput-
ing, 25(6):981–994.
ICPRAM 2023 - 12th International Conference on Pattern Recognition Applications and Methods
516
