
Multichannel Analysis in Weed Detection
Hericles Felipe Ferraz
1 a
, Jocival Dantas Dias Junior
3
, Andr
´
e Ricardo Backes
2
,
Daniel Duarte Abdala
3 b
and Mauricio Cunha Escarpinati
3 c
1
Faculty of Mechanical Engeneering, Uberl
ˆ
andia Federal University, Uberl
ˆ
andia, Brazil
2
Department of Computing, Federal University of S
˜
ao Carlos, S
˜
ao Carlos-SP, 13565-905, Brazil
3
Faculty of Computing, Federal University of Uberl
ˆ
andia, Uberl
ˆ
andia, Brazil
Keywords:
Precision Agriculture, Weed Detection, Color Spaces, Deep Learning, Remote Sensing.
Abstract:
In this paper a new classification scheme is investigated aiming to improve the current classification models
used in weed detection based on UAV imaging data. The premise is that the investigation regarding the
relevance of a given color space channel regarding its classification power of important features could lead
to a better selection of training data. Consequently it could culminate on a superior classification result. An
hybrid image is constructed using only the channels which least overlapping regarding their contribution to
represent the weed and soil data. It is then fed to a deep neural net in which a process of transfer learning
takes place incorporating the previously trained knowledge with the new data provided by the hybrid images.
Three publicly available datasets were used both in training and testing. Preliminary results seems to indicate
the feasibility of the proposed methodology.
1 INTRODUCTION
Agriculture represents by all accounts a relevant por-
tion of Brazilian economy. According to CEPEA
2020 data it represented 26.6% of the country’s GDP.
It is also a growing economical activity showing 6.1%
growth from 2019 to 2020. Brazil figures as the third
largest country in food production been the first in
soy bean coffee and sugar cane production (Nachiluk,
2022). There are a number of reasons for those figures
such as the farming land available, climate and soil
fertility. Another contributing factor for the Brazilian
aggro business success could be the early and ever in-
creasing adoption of Precision Agriculture - PA. Offi-
cial data regarding the usage of PA technologies in
Brazil are scarce despite efforts in regulating such
as the creation of ”Comiss
˜
ao Brasileira de Agricul-
tura de Precis
˜
ao - CBAP” or Brazilian Commission
for Precision Agriculture a consulting group reporting
directly to the Federal Agricultural Ministry and the
Brazilian Association of Precision Agriculture Ser-
vice Providers (Molin, 2017). However, most data re-
garding the adaption of PA in Brazil still stems from
a
https://orcid.org/0000-0003-4299-8553
b
https://orcid.org/0000-0002-4647-8689
c
https://orcid.org/0000-0002-3792-056X
AP equipment companies.
The most recent data available points out to vari-
able adoption levels for distinct PA methods. Geo-
referencing in sowing and harvesting are among the
most widespread technology been quickly caught up
by soil testing for automated variable soil fertilization
based on grid maps. PA techniques focusing of weed
and invasive plants detection are still largely uncov-
ered. According to (de Carvalho, 2013) weed and in-
vasive plants are regarded as ”any plant that grows
spontaneously in a crop field causing losses to the
farming activity.”. They can be very prejudicial to the
overall crop yield since they would naturally compete
for the soil nutrients, water and sunlight. Addition-
ally they can be vectors for invading plagues as well
as disease spreading agents. Weed invasion usually
are prejudicial to harvesting operations negatively im-
pacting the crop quality an yield. Weed and invasive
plants are usually managed by means of herbicides
since they are relatively inexpensive and presents a
speedy application process compared to the manual
weed removal. In fact, in large fields the manual ap-
proach is virtually impossible (Bucci et al., 2018). Al-
though cheap and quick, the indiscriminate herbicide
application presents by itself a number of troubling
environmental problems. It can damage the intended
crop, can pose risks for pollinating agents, infiltrate
Ferraz, H., Dias Junior, J., Backes, A., Abdala, D. and Escarpinati, M.
Multichannel Analysis in Weed Detection.
DOI: 10.5220/0011780900003417
In Proceedings of the 18th International Joint Conference on Computer Vision, Imaging and Computer Graphics Theory and Applications (VISIGRAPP 2023) - Volume 4: VISAPP, pages
419-426
ISBN: 978-989-758-634-7; ISSN: 2184-4321
Copyright
c
2023 by SCITEPRESS – Science and Technology Publications, Lda. Under CC license (CC BY-NC-ND 4.0)
419

water tables and even poison fauna and humans.
A feasible way to mitigate the herbicide conse-
quences is to restrict its application to specific field
regions in which the are prevalence of weed instead
of a uniform approach aiming the entire field. Smart
herbicide usage is obviously preferable since it mit-
igates its harmful impact. A secondary advantage
would be the cost savings deriving of the smaller her-
bicides quantities that would have to be acquired and
managed. In order to enable the smart herbicide man-
agement a number of aiding PA technologies are re-
quired.
This work aims to investigate the influence of dis-
tinct color spaces used in various imaging sensors as
raw data to be fed into intelligent weed detection sys-
tems. Ten color spaces (RGB, HED, HSV, LAB, RG-
BCIE, XYP, YCBCR, YDBCRm YIQ, YPBPR and
YUV) are investigated. Distinct color spaces not nec-
essarily encode the same bands in the color spec-
tra. Consequently there is the possibility that spe-
cific color bands could highlight important features
pertaining the problem in question. The identifica-
tion of an adequate color space can impact consider-
ably the success to be achieved by a given classifica-
tion method. It is believed that such influence merits
a more thorough investigation. The premise is that
the investigation regarding the relevance of a given
color space channel regarding its classification power
of important features could lead to a better selection
of training data. Consequently it could culminate on
a superior classification result.
Preliminary evaluation had shown distinct chan-
nels deriving from different color spaces contribute
asymmetrically to the overall classification process.
Consequently this study focus on combining channels
from distinct color spaces in order to maximize the
discriminating power of the weed classifier. The ex-
periments were carried out using two publicly avail-
able annotated datasets.
The remainder of this document is organized as
follows: Section 2 Presents the theoretical back-
ground covering a brief review of the color spaces,
and the classification model devised to process the in-
put data. Section 3 discusses the methods in which
the general methods workflow is presented followed
by a detailed description of the color channel selec-
tion process. This section closes with the presentation
of the experimental dataset. Section 4 presents the de-
vised experiments and discusses the obtained results.
Finally this work closes with conclusions and a pos-
sible description of the road ahead.
2 THEORETICAL BACKGROUND
One of the current PA research interest is to find meth-
ods to accurately detect weed and infesting plants.
There are a number of different approaches been in-
vestigated.
Survey invasive plants in crop fields has increas-
ingly been carried out be means of imaging using
UAV - Unmanned Aerial Vehicles. It is a low cost
high resolution technique allowing the usage of dis-
tinct imaging sensors. UAVs can capture high res-
olution images using virtually any imaging sensor
able to be mounted on the vehicles frame. The most
common sensors used refers to the visible spectra us-
ing RBG sensors, infrared, multi-spectral and hyper-
spectral sensors (Yao et al., 2019). Sensors based
of refractance spectroscopy work based of the elec-
tromagnetic radiation reflection on different surfaces.
Those are the sensors which capture most information
about the crop since they sense the physicochemical
properties of the field been imaged including chemi-
cal and biochemical properties. Unfortunately multi
and hyper-spectral sensors are out of reach for a con-
siderable portion of small and medium size farmers
given their elevated costs compared to simpler visi-
ble spectra sensors (Jafarbiglu and Pourreza, 2022).
Therefore most UAV crop surveys are carried out us-
ing cheaper readily available RGB band sensors.
With the emergence of deep learning by late
2010’s new decision models are been tested in PA.
Current work has shown satisfactory an above aver-
age. In special, weed and invasive plants detection has
shown considerable performance. Most work done so
far focus on UAV RGB sensed data given the reason
aforementioned (Hasan et al., 2021). Early efforts uti-
lize vegetation index computation as a pre-processing
step in order to enhance some visual features as pre-
sented in (Osorio et al., 2020) in which the NDVI in-
dex was chosen. In (Milioto et al., 2018) various veg-
etation indexes computed using RGB data are com-
pared in order to assess their influence in predictive
models. To the best of our knowledge there are no
work investigating the possibility of combining dis-
tinct sensors bands as input data to deep learning base
classification models.
2.1 Color Spaces
Image pixel color perceived by the human eye are
nothing more than a specific spectral potency distri-
bution. Color is a uniquely useful feature to discrimi-
nate image data (Packyanathan et al., 2015). A color
space is a numerical system usually represented as a
3D or 4D matrix. According to (Hastings and Rubin,
VISAPP 2023 - 18th International Conference on Computer Vision Theory and Applications
420
2012) there are a number of color spaces available
tailored for specific applications. YCbCr and HSV
were devised for skin detection (Shaik et al., 2015),
CIELab and CIEluv (Mahy et al., 1991) were effec-
tive in image segmentation, and HED and LAB in
medical imaging.
It is possible to map a color space to another (Bi
and Cao, 2021). However the mapping is not always
perfect since a given color spaces focus on distinct
ranges of the electromagnetic spectra. This is the
main reason imaging sensors usually choose a given
color space that best represents the imaging range
provided by the sensor. There are additionally cur-
rent work that seems to demonstrate that a color space
change can impact positively the classification model
performance. As an example (Fu et al., 2019) shows
improved results in retina image classification by sim-
ply changing the color space used.
2.2 Classification Model
The classification model used in this work was chosen
given the actual success of deep neural nets in classi-
fication problems in special on computer vision appli-
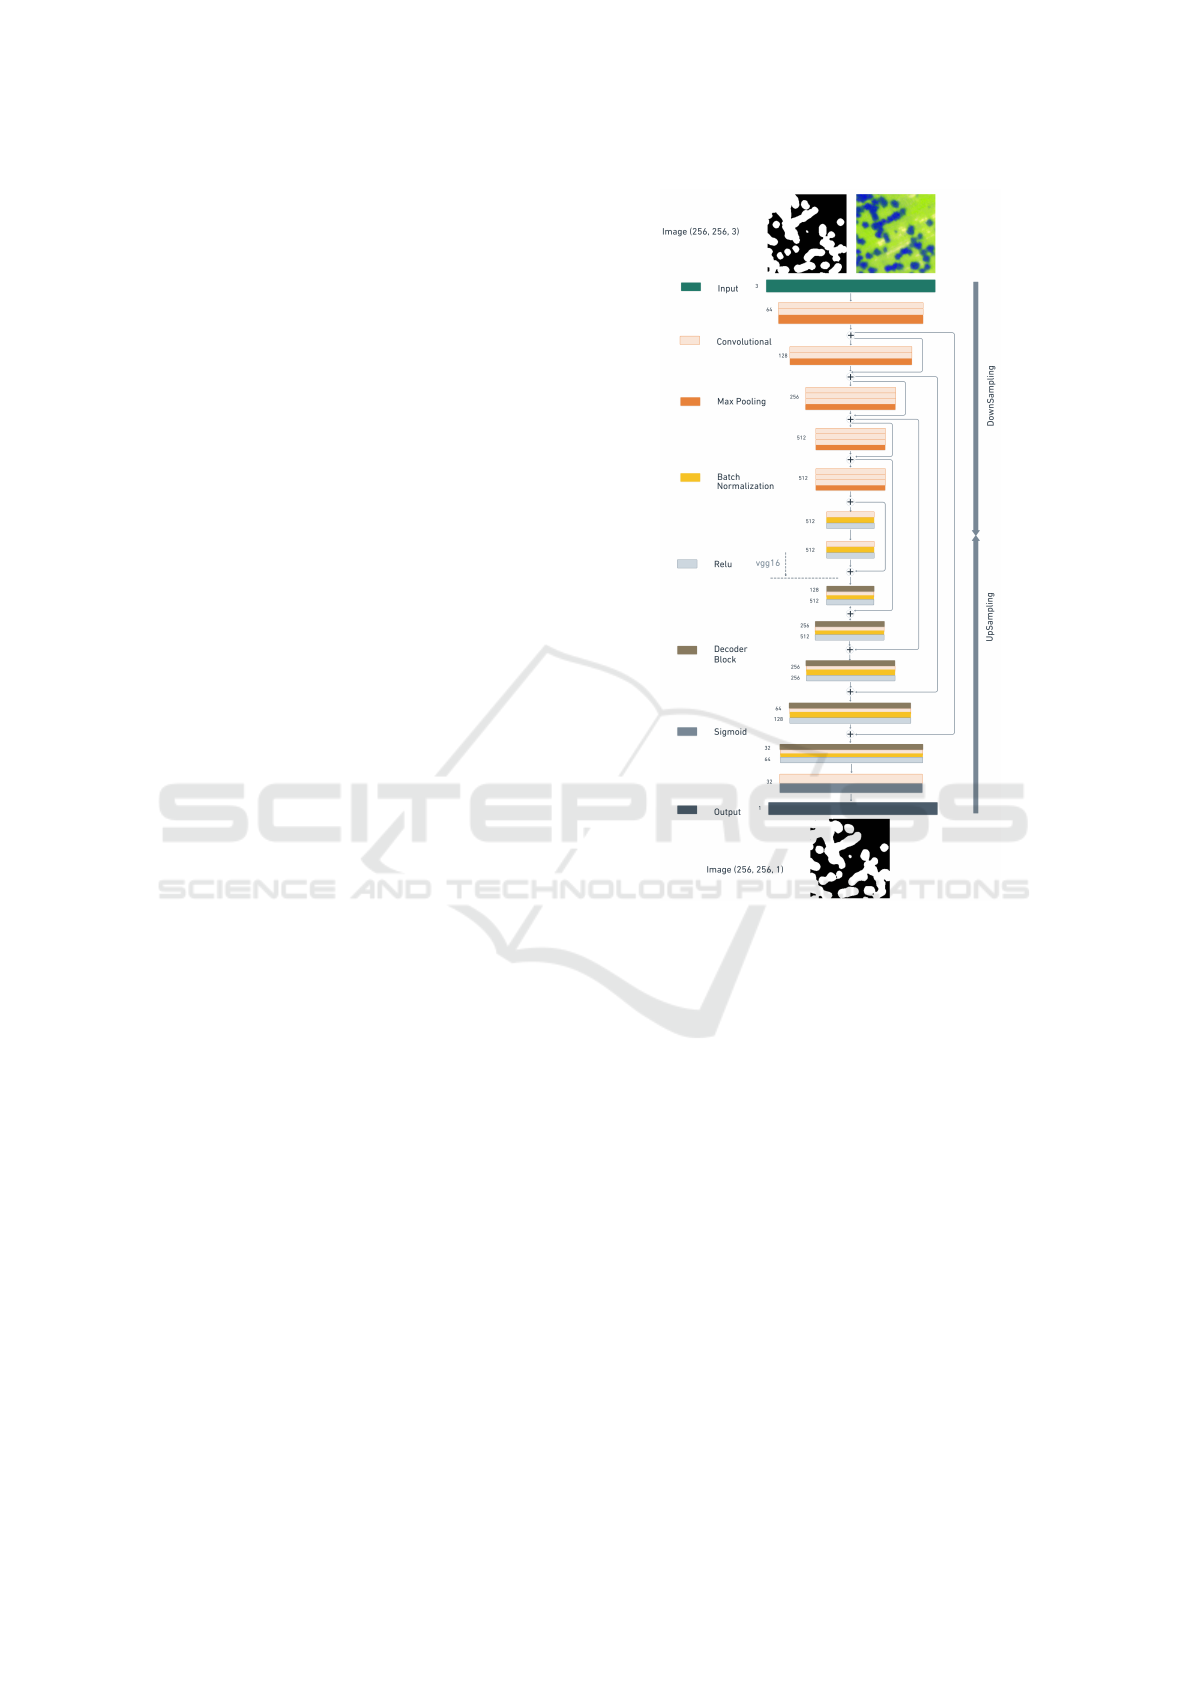
cations. The proposed net can be seen in Figure 1. By
following the diagram the proposed net can be easily
reproduced. This net was realized using the Tensor
Flow framework.
This net is a composition of LinkNet (Chaurasia
and Culurciello, 2017) and vgg16 (Elharrouss et al.,
2022). The net model is composed as a pre-trained
vgg16 as encoder layer (nets upper half) in place of
LinkNets downsampling. This choice was made seek-
ing to take advantage of vgg16 good convolutional ar-
chitecture in order to emphasize the input image fea-
tures by means of their convolutional layers. As it
is usual, after the convolution a maxpulling layer is
necessary as shown in Figure 1. The lines positioned
along the diagram depict the information flow along
the net architecture. Each layers is linked in sequence
to the next layer (from up to bottom). There are also
direct connections among the autoencoders meaning
that encoders and decoders are all connected. Such
connection confer to this net the status of a FCNN -
Fully Convolutional Neural Network. The diagrams
bottom half represents the UpSampling meaning that
for each convolution layer there are a corresponding
batch normalization followed by a RELU layer. The
encoder is responsible for condense the input layers.
The attained effect is to compact incrementally the in-
put data. The decoder does exactly the opposite in-
flating the data in order to produce an output image of
desirable dimensions. This step is necessary in order
to confer to this net the ability of output data similar
Figure 1: Deep Neural Net architecture. The upper half
(downSampling) is basically vgg16 merged inside LinkNet.
to the input data.
3 METHODOLOGY
The proposed method is depicted in Figure 2. Ini-
tially the selected datasets is pre-processed in order
to convert the input data to the appropriated color
spaces (Ansari and Singh, 2022). The dataset images
were fed to step 1, in which the color space conver-
sion takes place. The conversion is necessary because
not all color spaces considered are provided directly
by the selected datasets. Additionally SC and SC2
provides only RGB data. SC provides some addi-
tional channels but still insufficient to compose di-
rectly all color spaces. Once the conversion is over the
overlapping analysis takes place in step 2. It utilizes
the groundtruth to create two images. One composed
only by the pixels pertaining to weed data, and a sec-
ond one representing only soil data. The color distri-
Multichannel Analysis in Weed Detection
421
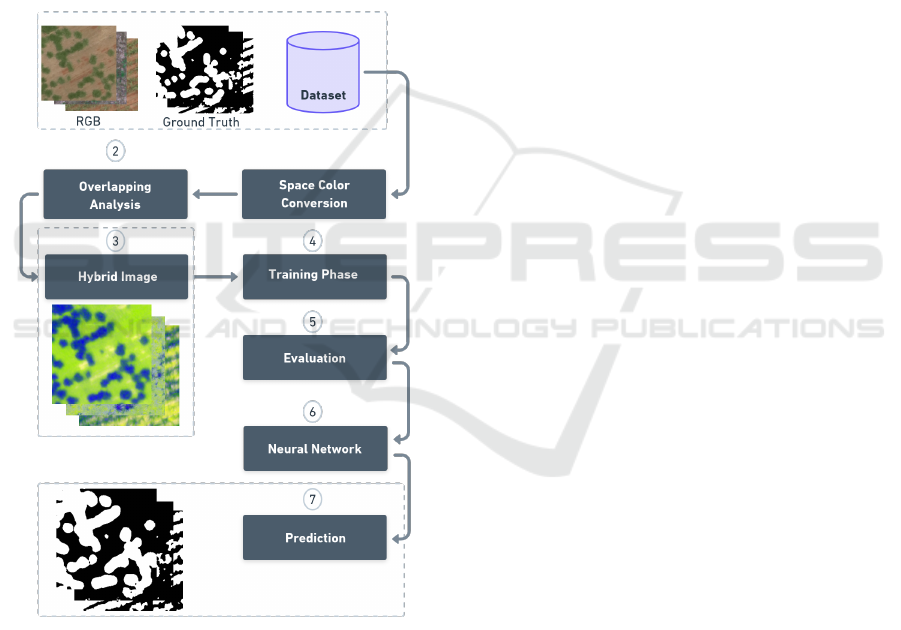
bution of both images is compared in order to mea-
sure the percentage of overlapping seeking to identify
which channels should be selected. The overlapping
analysis is somehow the most complex process in all
model, therefore it will be discussed in details in sub-
section 3.1. once the desirable channels are selected
they are combined in a new hybrid image on step 3
in order to produce the training data to be fed to the
classification model. The training phase takes place
in step 4 in which a pre-trained deep neural net com-
posed by linknet and vgg16 is further trained to incor-
porate the new knowledge. In step 5 the trained net is
used in order to evaluate its classification power. Step
6 represented the trained net that can be used in step
7 to predict which portions of the input data are weed
or soil.
Figure 2: General Workflow: Source Images and firstly con-
verted to distinct color spaces followed by a superposition
channel analysis. Hybrid images are generated using the
most significant channels and fed to the training phase. Dur-
ing the training phase a process of transfer learning takes
place culminating in a new net of weights adequate to the
weed detection problem.
Figure 3 depicts the process of hybrid image gen-
eration. In order to provide a suitable input to the
training and classification the selected channels must
be merged. The selected method is somehow simple.
An RGB template is used as a placeholder for the se-
lected channels from various color spaces. Each of
the three selected channels are mapped to the R, G
and B channels respectively. This is necessary given
the fact the classifier expects a three channel image as
input as well as it provides a suitable way to visualize
the composed image.
3.1 Channel Selection
The selection of the most representative channels in
different color spaces was performed based on the fol-
lowing premise: ”Good channels to feed the classi-
fication model are the ones which present the least
overlapping of weed and soil”. Those two objects
of interest present distinct colors. Additionally the
dataset groundtruth provide pixelwise annotation on
them. Figure 3 highlights the overall process.
The first step comprises the input images segmen-
tation into soil and weed data.The segmentation is
straightforward. Guided by the groundtruth the input
image is separated in two new images. One pertain-
ing only pixels annotated as weed data and the second
composed by the remainder soil.
For each original input image twenty new images
are produced since ten color spaces were considered
and for each color spaces two new images are pro-
duced. The color spaces considered in this work are
the following: RGB, HED, HSV, LAB, RGBCIE,
XYZ, YCBCR, YDBCR, YIQ, YPBPR, and YUV.
For each image the range ([min, max]) is computed
on each channel on both the weed and soil images.
Based on the range values the interval overlapping is
computed and expressed in percentage values. Table 1
presents the overlapping data computed for the entire
Beet dataset. Considering e.g. the lab color space. It
shows that channel 1 overlaps in 54.13%. This means
that channel 1 was used to represent both soil and
weed data and therefore could not be considered good
information to discriminate them. The desirable case
would be to find a channel that was used to represent
weed but not soil and vice versa.
A hard threshold α is set to 5% meaning that a
given channel is selected if its overlapping score is α
or less. All channels stemming from all color spaces
are ranked and the three with smallest scores are se-
lected to compose the hybrid image which will be the
input data to be fed to the classifier.
3.2 Experimental Dataset
In order to evaluate the methodology proposed in this
work a number of publicly available datasets were
VISAPP 2023 - 18th International Conference on Computer Vision Theory and Applications
422
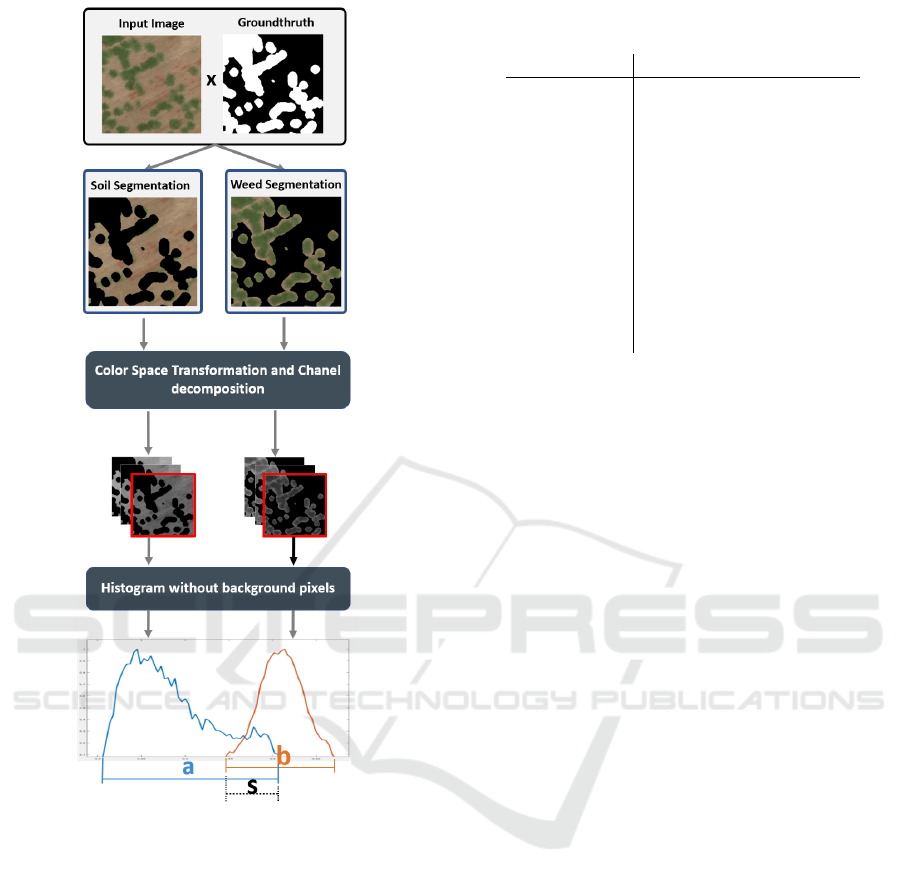
Figure 3: Channel selection process. An input image is pro-
cessed based on groudtruth data in order to separate soil and
weed data. Afterwards those images are processed in or-
der to convert them in ten distinct color spaces. The color
spaces channels are decomposed and compared in order to
verify their soil/weed overlapping. Then three least over-
lapped channels among all color spaces are selected as in-
put data to be fed into the classifier.
surveyed to ensure the reproducibility of the pro-
posed method. They were surveyed seeking annotated
data showing weed and invasive plants. The selected
datasets are the following:
(B) Beet - A publicly available dataset provided
by (Sa et al., 2018) was chosen since it presents inva-
sive plants. The predominant culture is beet and the
data was collected by an UAV using a multi-spectral
camera (RedEdge) in Germany.
(SC and SC2) Sugar-cane - In (Monteiro and
von Wangenheim, 2019) and (Pereira Junior and von
Table 1: Beet dataset overlapping rate considering all ten
color spaces.
Color Space Overlapping (%)
ch 1 ch 2 ch 3
rgb 5,06 100,00 33,18
hed 0,00 0,00 56,52
hsv 100,00 51,58 35,23
lab 54,13 0,00 13,17
rgbcie 9,90 100,00 35,85
xyz 30,48 100,00 36,57
ycbcr 42,62 31,22 0,00
ydbdr 42,62 31,25 0,00
yiq 42,62 0,00 0,00
ypbpr 42,62 31,22 0,00
yuv 42,62 31,22 0,00
Wangenheim, 2019) two datasets were made avail-
able depicting sugar-cane cultures along with invasive
plants. Those images were captured using an standard
RGB camera mounted on an UAV. The images were
manually annotated providing a suitable groundtruth.
4 EXPERIMENTS AND RESULTS
Section 3 describes how the hybrid images were cre-
ated. The entirety of the datasets were processed in
such way. It is then divided in training and testing
sets. A process of transfer learning takes place in or-
der to incorporate the knowledge provided by the new
data in the neural net also described in Section 3. Af-
terwards the testing set is fed to the classifier and pre-
diction images are achieved.
Figure 4 shows a representative sample set of 30
testing images drawn from the Beet dataset. Presented
results are given in terms of VI - Variation of Informa-
tion (Meil
˘
a, 2003) and f-measure or dice (Pandit et al.,
2011) indexes. Regarding the VI values close to zero
should be regarded as good scores indicating little to
no variation in comparison to the groundtruth data.
Values close to 1.0 represent high variation and con-
sequently an undesirable performance. The f-measure
is also set in the [0, 1.0] interval but with reverse inter-
pretation. The first measure is information theoretical
and the second one is pair counting based. As one can
see by inspecting the data the overall performance is
good. For most data the VI index scores around and
bellow 0.2 and the f-measure index above and beyond
0.8. Notable exceptions do occur, in special in the
cases of sample data 14, 15, and 28. A closer in-
spection of the processed data is in order to try and
understand such anomalies.
Figure 5 present a sample set comprised of data
drawn from cases 14, 15, 11, 12, 20 and 21 respec-
Multichannel Analysis in Weed Detection
423
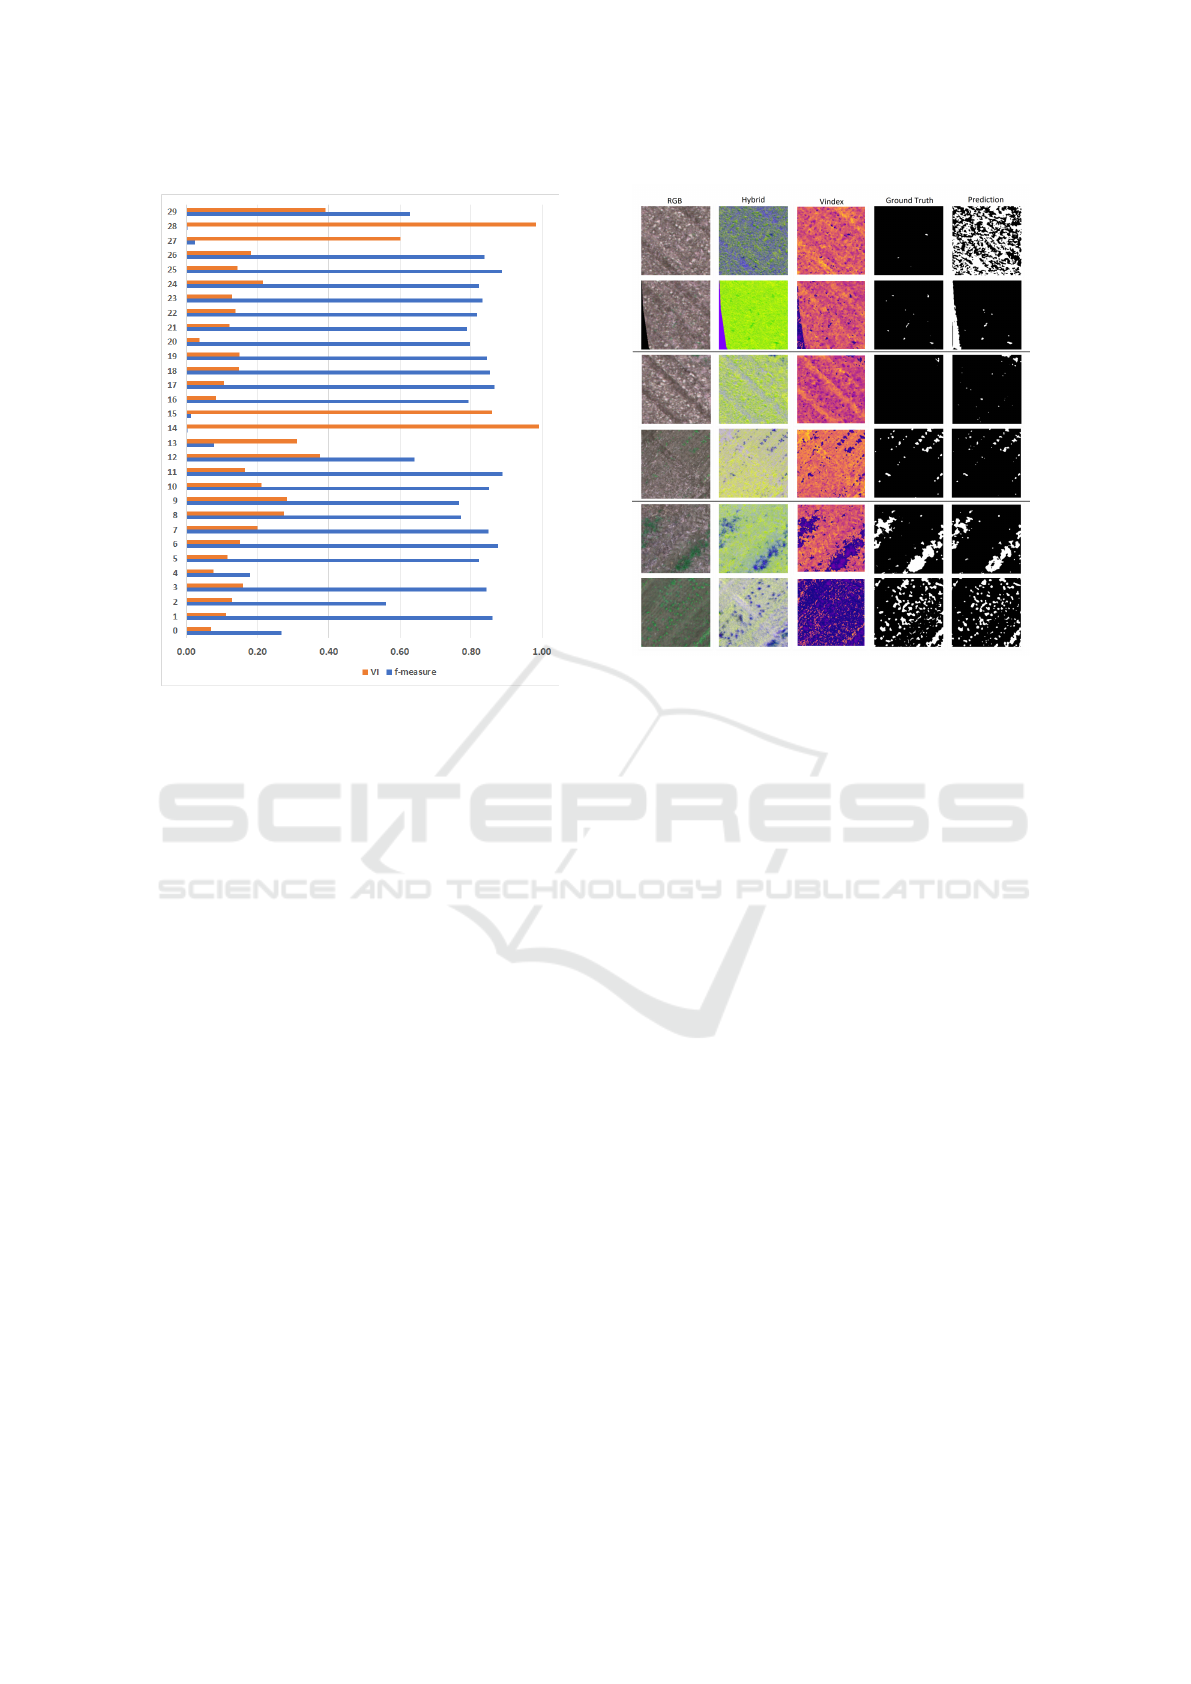
Figure 4: VI and F-measure results for a sample of 30 im-
ages drawn from the Beet dataset.
tively representing an undesirable, intermediate and
usual or desirable results. They are organized in five
columns. The first column a RGB representation of
the original image. Column 2 is the processed hy-
brid image. Column 3 is an image processed using
the vegetation index (Erunova et al., 2021). Column
4 gives the dataset provided groundtruth and finally
column 5 depicts the prediction provided by the pro-
posed method.
The first two rows representing cases 14 and 15
are samples in which the prediction diverged consid-
erably from the provided groundtruth. By direct vi-
sual inspection one can see that the groundtruth which
was generated by human experts does not necessar-
ily highlights all samples of weed present in the im-
age. This assertion is corroborated by the fact the
much of the weed data present in this image is con-
siderably small and hard to be accurately captured
by mid altitude images such as the ones generated
by a UAV mounted camera. However if one directs
his attention to the image provided in the third col-
umn representing the vegetation index it is possible
to see that the hybrid and prediction images tend to
agree much more with the prediction in comparison
to the provided groundtruth. This is due the fact the
ground truth was generated by visual inspection and
annotated manually by a human expect. It stands to
reason that very small patches of weed which would
be represented by sometimes one or even less pixels
(in which case the weed data would be spread frac-
Figure 5: Sample dataset highlighting images generated
during the process described in this method.
tionally among neighboring pixels) would be neglect
to be annotated. Another factor that could have im-
pacted negatively the ground truth generation process
would be the fact in those particular images the soil is
covered by dead matter usually stems from previous
crops which will partially cover the weeds and further
impending its visual identification.
Rows three and four refers to cases 11 and 12
in which the overall performance of the proposed
method achieved a median result. By direct visual in-
spection one can conclude that hybrid, vegetation in-
dex and groundtruth tend to agree among themselves
considerably more. However the effects of weed cov-
ering by dead matter and small weed patches could
still be present.
Finally rows 5 and 6 referring to cases 20 and 21
which achieved above 0.8 f-measure and bellow 0.2
VI represent the most recurrent cases in which the
weed patches are well defined and therefore could be
annotated very precisely on the groundtruth. Vegeta-
tion index seems to agree almost perfectly with the
annotated data which further corroborates the predic-
tion achieved.
5 CONCLUSIONS
This paper presented a work in progress pertaining to
a broader project aiming to devise a feasible method
to identify and highlight patches of week in crop
fields. Although very encouraging the results pre-
VISAPP 2023 - 18th International Conference on Computer Vision Theory and Applications
424

sented are only preliminary. The idea of cherry pick-
ing the most adequate channels among different color
spaces seems to indicate that this approach can lead to
superior results. However a number of further steps
needs to be taken in order to ensure the reproducibil-
ity and levels of accuracy could be ensured. The most
immediate problem is regarding the data. As one can
see in the results section it was identified that there
is a good change the annotation process available in
the used datasets are not necessarily precise leading to
miss-classification. In order to address this issue we
are currently working on a huge multi-spectral dataset
featuring invasive plants. The aforementioned dataset
is been manually annotated by a pool of specialists
and it will be made publicly available as soon as it
is complete and validated. A further development to
ensure the accuracy of the produced groundtruth is to
provide the expects with vegetation index images in
order to aid and further guide them during the anno-
tation process.
ACKNOWLEDGEMENTS
The authors would like to thank the company Sen-
six Inovac¸
˜
oes em Drones Ltda (http://sensix.com.br)
for providing the images used in the tests. Andr
´
e R.
Backes gratefully acknowledges the financial support
of CNPq (National Council for Scientific and Techno-
logical Development, Brazil) (Grant #307100/2021-
9). This study was financed in part by the
Coordenac¸
˜
ao de Aperfeic¸oamento de Pessoal de
N
´
ıvel Superior - Brazil (CAPES) - Finance Code 001.
REFERENCES
Ansari, A. M. and Singh, D. K. (2022). Significance of
color spaces and their selection for image processing:
A survey. Recent Advances in Computer Science and
Communications (Formerly: Recent Patents on Com-
puter Science), 15(7):946–956.
Bi, Z. and Cao, P. (2021). Color space conversion algorithm
and comparison study. Journal of Physics: Confer-
ence Series, 1976(1):012008.
Bucci, G., Bentivoglio, D., and Finco, A. (2018). Pre-
cision agriculture as a driver for sustainable farming
systems: state of art in literature and research. Cali-
tatea, 19(S1):114–121.
Chaurasia, A. and Culurciello, E. (2017). Linknet: Exploit-
ing encoder representations for efficient semantic seg-
mentation. In 2017 IEEE Visual Communications and
Image Processing (VCIP), pages 1–4.
de Carvalho, L. B. (2013). Plantas Daninhas, volume 1. 1st
edition.
Elharrouss, O., Akbari, Y., Almaadeed, N., and Al-
Maadeed, S. (2022). Backbones-review: Feature
extraction networks for deep learning and deep re-
inforcement learning approaches. arXiv preprint
arXiv:2206.08016.
Erunova, M. G., Pisman, T. I., and Shevyrnogov, A. P.
(2021). The technology for detecting weeds in agri-
cultural crops based on vegetation index vari (plan-
etscope). Journal of Siberian Federal University. En-
gineering & Technologies, 14(3):347–353.
Fu, H., Wang, B., Shen, J., Cui, S., Xu, Y., Liu, J., and Shao,
L. (2019). Evaluation of Retinal Image Quality As-
sessment Networks in Different Color-Spaces, pages
48–56.
Hasan, A. S. M. M., Sohel, F., Diepeveen, D., Laga, H., and
Jones, M. G. (2021). A survey of deep learning tech-
niques for weed detection from images. Computers
and Electronics in Agriculture, 184:106067.
Hastings, G. D. and Rubin, A. (2012). Color spaces - a
review of historic and modern colour models. African
Vision and Eye Health, 71(3).
Jafarbiglu, H. and Pourreza, A. (2022). A comprehensive
review of remote sensing platforms, sensors, and ap-
plications in nut crops. Computers and Electronics in
Agriculture, 197:106844.
Mahy, M., Van Mellaert, B., Van Eycken, L., and Oost-
erlinck, A. (1991). The influence of uniform color
spaces on color image-processing-a comparative-
study of cielab, cieluv, and atd. Journal of imaging
technology, 17(5):232–243.
Meil
˘
a, M. (2003). Comparing clusterings by the variation of
information. In Learning theory and kernel machines,
pages 173–187. Springer.
Milioto, A., Lottes, P., and Stachniss, C. (2018). Real-time
semantic segmentation of crop and weed for precision
agriculture robots leveraging background knowledge
in cnns. In 2018 IEEE International Conference on
Robotics and Automation (ICRA), pages 2229–2235.
Molin, J. P. (2017). Agricultura de precis
˜
ao: N
´
umeros do
mercado brasileiro. Technical report, USP.
Monteiro, A. and von Wangenheim, A. (2019). Orthomo-
saic dataset of rgb aerial images for weed mapping.
http://www.lapix.ufsc.br/weed-mapping-sugar-cane.
Nachiluk, K. (2022). Alta na prodduc¸
˜
ao e exportac¸
˜
oes de
ac¸ucar marcam a safra 2020/21 de cana. an
´
alises e in-
dicadores o agroneg
´
ocio. Electronically. v. 16 n. 16.
Osorio, K., Puerto, A., Pedraza, C., Jamaica, D., and
Rodr
´
ıguez, L. (2020). A deep learning approach for
weed detection in lettuce crops using multispectral
images. AgriEngineering, 2(3):471–488.
Packyanathan, G., Veeraraghavalu, R., B.S, S., Kalist, V.,
and Basha, S. (2015). Satellite image segmentation
based on ycbcr color space. Indian Journal of Science
and Technology, 8:35.
Pandit, S., Gupta, S., et al. (2011). A comparative study
on distance measuring approaches for clustering. In-
ternational journal of research in computer science,
2(1):29–31.
Pereira Junior, P. and von Wangenheim, A. (2019). Or-
thomosaic dataset of rgb aerial images for crop rows
Multichannel Analysis in Weed Detection
425

detection. http://www.lapix.ufsc.br/weed-mapping-
sugar-cane.
Sa, I., Popovi
´
c, M., Khanna, R., Chen, Z., Lottes, P.,
Liebisch, F., Nieto, J., Stachniss, C., Walter, A., and
Siegwart, R. (2018). Weedmap: A large-scale seman-
tic weed mapping framework using aerial multispec-
tral imaging and deep neural network for precision
farming. Remote Sensing, 10(9).
Shaik, K. B., Ganesan, P., Kalist, V., Sathish, B., and
Jenitha, J. M. M. (2015). Comparative study of skin
color detection and segmentation in hsv and ycbcr
color space. Procedia Computer Science, 57:41–
48. 3rd International Conference on Recent Trends
in Computing 2015 (ICRTC-2015).
Yao, H., Qin, R., and Chen, X. (2019). Unmanned aerial ve-
hicle for remote sensing applications—a review. Re-
mote Sensing, 11(12).
VISAPP 2023 - 18th International Conference on Computer Vision Theory and Applications
426
