
MOT: A Multi-Omics Transformer for Multiclass Classification Tumour
Types Predictions
Mazid Abiodoun Osseni
1 a
, Prudencio Tossou
2 b
, Franc¸ois Laviolette
1 c
and Jacques Corbeil
1,3 d
1
GRAAL, Institute Intelligence and Data, Department of Computer Science and Software Engineering, Universit
´
e Laval,
Quebec, QC, Canada
2
Valence AI Discovery, Montr
´
eal, QC, Canada
3
Department of Molecular Medicine, Universit
´
e Laval, Quebec, QC, Canada
Keywords:
Multiclass Classification, Cancer, Multi-Omics Analysis, Transformer Model, Precision Medicine.
Abstract:
Motivation: Breakthroughs in high-throughput technologies and machine learning methods have enabled the
shift towards multi-omics modelling as the preferred means to understand the mechanisms underlying biolog-
ical processes. Machine learning enables and improves complex disease prognosis in clinical settings. How-
ever, most multi-omic studies primarily use transcriptomics and epigenomics due to their over-representation
in databases and their early technical maturity compared to others omics. For complex phenotypes and mecha-
nisms, not leveraging all the omics despite their varying degree of availability can lead to a failure to understand
the underlying biological mechanisms and leads to less robust classifications and predictions.
Results: We proposed MOT (Multi-Omic Transformer), a deep learning based model using the transformer
architecture, that discriminates complex phenotypes (herein cancer types) based on five omics data types:
transcriptomics (mRNA and miRNA), epigenomics (DNA methylation), copy number variations (CNVs), and
proteomics. This model achieves an F1-score of 98.37% among 33 tumour types on a test set without missing
omics views and an F1-score of 96.74% on a test set with missing omics views. It also identifies the required
omic type for the best prediction for each phenotype and therefore could guide clinical decision-making when
acquiring data to confirm a diagnostic. The newly introduced model can integrate and analyze five or more
omics data types even with missing omics views and can also identify the essential omics data for the tumour
multiclass classification tasks. It confirms the importance of each omic view. Combined, omics views allow a
better differentiation rate between most cancer diseases. Our study emphasized the importance of multi-omic
data to obtain a better multiclass cancer classification.
Availability and implementation: MOT source code is available at https://github.com/dizam92/multiomic
predictions.
1 INTRODUCTION
The development of high-throughput techniques, such
as next-generation sequencing and mass spectometry,
have generated a wide variety of omics datasets: ge-
nomics, transcriptomics, proteomics, metabolomics,
lipidomics, among others. This reveals different bi-
ological facets of the clinical samples that open up
new perspectives within the framework of personal-
ized medicine. Although the majority of past stud-
ies ((Reel et al., 2021), (Mamoshina et al., 2018),
a
https://orcid.org/0000-0001-7358-7402
b
https://orcid.org/0000-0002-9841-9867
c
https://orcid.org/0000-0002-9973-2740
d
https://orcid.org/0000-0002-1937-2512
(Sonsare and Gunavathi, 2019), (Dias-Audibert et al.,
2020)) use a single omic data type, with a sig-
nificant emphasis on genomics, transcriptomics and
proteomics, there is currently a switch towards
multi-omics studies. The objective is to provide a
deeper and better understanding of patients’ inter-
nal states, enabling accurate clinical decision-making
((Bersanelli et al., 2016), (Kim and Tagkopoulos,
2018)). The positive impact of these multi-omics
studies using machine learning techniques can al-
ready be seen in several indication areas: Cen-
tral Nervous Systems ((Young et al., 2013), (Gar-
ali et al., 2018)), oncology ((Borad and LoRusso,
2017), (Chaudhary et al., 2018), (Kothari et al.,
2020), (Osseni et al., 2021)), cardiovascular diseases
252
Osseni, M., Tossou, P., Laviolette, F. and Corbeil, J.
MOT: A Multi-Omics Transformer for Multiclass Classification Tumour Types Predictions.
DOI: 10.5220/0011780100003414
In Proceedings of the 16th International Joint Conference on Biomedical Engineer ing Systems and Technologies (BIOSTEC 2023) - Volume 3: BIOINFORMATICS, pages 252-261
ISBN: 978-989-758-631-6; ISSN: 2184-4305
Copyright
c
2023 by SCITEPRESS – Science and Technology Publications, Lda. Under CC license (CC BY-NC-ND 4.0)

(Weng et al., 2017) single-cell analysis in humans
((Cao et al., 2020), (Ma et al., 2020), (Zuo et al.,
2021)). A typical multi-omics study only uses the
transcriptomic data (mRNA and miRNA) and the
epigenomics data (DNA methylation also known as
CpG sites). However, there is a multitude of other
omics data types that must be taken into consideration
for a complete assessment of a patient internal state.
Many reasons are often invoked for not considering
other omics: heterogeneity (Bersanelli et al., 2016),
missing values, outliers and data imbalances (Haas
et al., 2017). But the most important is the under-
representation of certain omics types in databases due
to limited effort to acquire this type of data, costs as-
sociated with their acquisition and the technical de-
cisions made by laboratory groups. Lately, several
studies ((Arnedos et al., 2015), (Lipinski et al., 2016),
(Yu et al., 2017)) are studying cancer diseases under
the prism of personalised medicine. These studies are
trying to unveil the varying sources responsible for the
cancer disease at a micro level i.e. for each patients.
The varying sources imply that the different omics
available may have various impacts on each cancer
patients.
To exploit all these data, the development of com-
putational methods has accelerated. The rapid growth
and success of machine learning and deep learning
models have led to an exponential increase of appli-
cations models to biological problems including the
cancer diseases classification task. For instance, a
traditional auto-encoder (Bengio, 2009) was used to
embed some multi-omics data (mRNA, miRNA and
DNA methylation) into a 100-dimensional space to
identify multi-omics features linked to the differen-
tial survival of patients with liver cancer (Chaudhary
et al., 2018). Xu et al. (Xu et al., 2019), introduced
HI-DFN Forest, a framework built for the cancer sub-
type classification task. The framework includes a
multi-omics data integration step based on hierarchi-
cal stacked auto-encoders (Masci et al., 2011) used
to learn an embedded representation from each omics
data (mRNA, miRNA and DNA methylation). The
learned representations are then used to classify pa-
tients into three different cancer subtypes: invasive
breast carcinoma (BRCA), glioblastoma multiform
(GBM) and ovarian cancer (OV). Targeting a differ-
ent perspective on the multi-omics data usage, Li et
al. (Li et al., 2019) addressed the task of predicting
the proteome from the transcriptome. To achieve this
task, Li et al. (Li et al., 2019) built three models:
a generic model to learn the innate correlation be-
tween mRNA and protein level, a random-forest clas-
sifier to capture how the interaction of the genes in a
network control the protein level and finally a trans-
tissue model, which captures the shared functional
networks across BRCA and OV cancers. It should
be noted that most of these studies used only one
omic view to tackle the cancer identification or clas-
sification task. As for pan-cancer with multi-omics
data, (Poirion et al., 2021) introduced DeepProg, a
semi-supervised hybrid machine-learning framework
made essentially of an auto-encoder for each omics
data type to create latent-space features which are
then combined later to predict patient survival sub-
types using a support vector machine (SVM). Deep-
Prog is applied on two omics views (mRNA and DNA
methylation) for 32 cancer types from the TCGA por-
tal (https://www.cancer.gov/tcga). OmiVAE, (Zhang
et al., 2019) on the other hand, is a variational auto-
encoder based model (Kingma and Welling, 2013),
used to encode different omics datasets (mRNA and
DNA methylation) into a low-dimensional embedding
on top of which a fully connected block is applied to
the classification of the 33 tumours from UCSC Xena
data portal (Goldman et al., 2020). These models are
limited in the number of omics and which ones, they
can integrate successfully.
To respond to the lack of existing model inte-
grating and processing many different omics views
with missing views for samples, we introduce MOT,
a multi-omic transformer architecture. Initially in-
troduced to solve Sequence to Sequence (Seq2Seq)
translation problems, the transformer model (Vaswani
et al., 2017) is widely applied to various domains
and is increasingly becoming one of the most fre-
quently used deep learning models. This model in-
cludes two main parts: an encoder and a decoder com-
posed of modules (multi-heads attention mechanisms
and feed forward layers). The modules can be stacked
on top of each other multiple times. The popular-
ity of the transformer architecture lies in the attention
heads mechanism that offers a level of interpretabil-
ity of the model’s decision process. We perform a
data augmentation step in the learning phase to ob-
tain a robust MOT model handling missing omics data
type. Data augmentation encompasses techniques
used to increase the amount of data by adding al-
tered copies of already existing data or newly created
synthetic data from existing data. The impact of this
method is well demonstrated in the literature ((Perez
and Wang, 2017), (Ayan and
¨
Unver, 2018), (Oviedo
et al., 2019)). Here, new examples were created from
the original samples by randomly generating alternate
subsets of omics data type available for the examples.
We compared the MOT performance to some base-
lines algorithms. To our knowledge, this is the first
model that integrates and processes up to five omics
data types regardless of their availability and offers a
MOT: A Multi-Omics Transformer for Multiclass Classification Tumour Types Predictions
253

macro level of interpretability for each phenotype for
the pan-cancer multiclass classification task.
2 MATERIAL AND METHODS
2.1 Datasets and Preprocessing
2.1.1 Datasets
The TCGA pan-cancer dataset is available on the
UCSC Xena data portal. There are 33 tumour types
in the dataset. Five types of omics data, mRNA
(RNA-Seq gene expression), miRNA, DNA methy-
lation, copy number variation (CNVs) and protein,
were used in this study. Among them, three (mRNA,
DNA methylation, CNVs) are datasets of high-
dimensional space. The gene expression (mRNA)
profile of each sample comprises 20532 identifiers re-
ferring to corresponding genes. A log2 transforma-
tion (log2(norm value+1)) was applied on the original
count resulting in an mRNA version called the batch
effects normalized mRNA. The Illumina Infinium Hu-
man Methylation BeadChip (450K) arrays provide
DNA methylation profiles with 485,578 probes. The
Beta value of each probe represents the methylation
ratio of the corresponding CpG site. The CNVs pro-
file of each sample comprises of 24776 identifiers
which are estimated values from the ones measured
experimentally. The estimated values are -2, -1, 0,
1, 2, which represent respectively homozygous dele-
tion, single copy deletion, normal diploid copies, low-
level copy number amplification, or high-level copy
number amplification. As for the miRNA profile,
it is comprised of 743 identifiers. The values of
the miRNA dataset were also log2-transformed. Fi-
nally, the protein expression dataset is comprised of
210 identifiers. All the omics datasets were down-
loaded from the UCSC Xena data portal on Septem-
ber 1st, 2021. As most omics datasets, the dataset is
imbalanced: there is a discrepancy in the availabil-
ity of samples for each tumour type. It is a well-
documented problem (Haas et al., 2017) specific to
this kind of dataset. To illustrate this, the authors re-
fer readers to figure 3 in supplementary data which
present the number of samples available for each of
the 33 tumours in the dataset. The imbalance is easily
observable as as we have more than 1200 samples for
breast cancer and fewer than 50 samples for cholan-
giocarcinoma (bile duct cancer). Table 4 in supple-
mentary data presents all the 33 cancer types with
their abbreviations.
2.1.2 Preprocessing
A feature selection step was performed on the omics
datasets with a high-dimensional space to compre-
hensively integrate all of the omic dataset. The
targeted omics datasets are the mRNA, the DNA
methylation and the CNVs. The dimension reduc-
tion step, a standard step in multi-omics data pro-
cessing, is well documented in many studies. For
example, Wu and al. (Wu et al., 2019) presented
many feature selections and techniques adapted to
multi-omics problems. Here, we apply the median
absolute deviation (MAD = median(|X
i
−
˜
X|) with
˜
X = median(X)) which is a robust measure of the
variability of a univariate sample of quantitative data.
The MAD was applied to the mRNA and the DNA
methylation datasets. Regarding the CNVs dataset,
it contains categorical values [(-2, -1, 0, 1, 2)]. Thus,
another feature selection method was applied, the mu-
tual info classif, available on sickit-learn (Buitinck
et al., 2013), which estimates the mutual informa-
tion for a discrete target variable. Mutual information
(MI) between two random variables is a non-negative
value, which measures the dependency between the
variables. It is equal to zero if and only if two random
variables are independent, and higher values mean
higher dependency. Since it can be used for univariate
features selection, we believed it was the most suit-
able for the CNVs dataset. From each applied method
on the targeted omics dataset, we selected 2000 fea-
tures per omics type. It should be recalled that the
miRNA and proteomics dataset were used directly
without a feature selection step. After the dimension
reduction step, the omics dataset were integrated us-
ing the parallel integration method (Wu et al., 2019)
which consists of putting together all the omics avail-
able together to obtain a matrix with n rows (the sam-
ples) and m column (the omics features). There is no
consensus on the integration method in the studies but
Wu and al. (Wu et al., 2019) presented an excellent
review of all the main techniques used. As for the
data augmentation step, new samples were built by
randomly selecting a subset of the omics views ini-
tially available for the sample. Thereby for each pa-
tient from the original dataset built earlier, a combina-
tion between 1 and 4 views is randomly selected and
replaced with 0. Amongst the five omics datasets tar-
geted, a sample must have at least one of those omics
data available to be considered in the final dataset.
2.2 MOT: A Transformer Model
The transformer model is constituted of encoders and
decoders and is built around the attention mechanism.
BIOINFORMATICS 2023 - 14th International Conference on Bioinformatics Models, Methods and Algorithms
254
Each encoder includes two principal layers: a self-
attention layer and a feed-forward layer. Before feed-
ing the input data to the encoder, the input is passed
through the embedding layer which is a simple linear
neuronal network. Let X ∈ R
T ×D
m
an input data con-
sisting of T tokens in D
m
dimensions. Similar to the
NLP framework where each token t represents a word
in a sentence, the token here represents the numerical
value of the multi-omic data concerned. Let’s denote
Q ∈ R
T ×d
k
, the matrix containing all query vectors of
all the omic datasets, K ∈ R
T ×d
k
, the matrix of keys
and V ∈ R
T ×d
v
, the matrix of all values. The query
represents a feature vector that describes what we are
looking for in the sequence. The key is also a feature
vector which roughly describes what the element is
“offering”, or when it might be important. The value
is also a feature vector which is the one we want to
average over. T is the length of the sequence, d
k
is
the hidden dimension of the keys and d
v
the hidden
dimension of the values. Thus the self attention value
is obtained by:
Attention(Q, K, V) = so f tmax
QK
T
√
d
k
×V (1)
The multi-head attention is the integration of multi-
ple single self-attention mechanism to focus simulta-
neously on different aspects of the inputs. Literally
it represents a concatenation of single head attention
mechanism. The initial inputs to the multi-head atten-
tion are split into h parts, each having queries, keys,
and values. The multi-head attention is computed as
follows:
Multihead(Q, K, V)) = Concat(head
1
, ..., head
h
)W
0
where head
i
= Attention(QW
Q
i
, KW
K
i
, VW
V
i
) (2)
with W
Q
1...h
∈ R
D
m
×d
k
; W
K
1...h
∈ R
D
m
×d
k
; W
V
1...h
∈
R
D
m
×d
v
and W
O
∈ R
h·d
k
×d
out
. The attention weights
are then sent to the decoder block which objective is
to retrieve information from the encoded representa-
tion. The architecture is quite similar to the encoder,
except that the decoder contains two multi-head at-
tention submodules instead of one in each identical
repeating module. In the original transformer model,
due to the intrinsic nature of the self-attention opera-
tion which is permutation invariant, it was important
to use proper positional encoding to provide order in-
formation to the model. Therefore, a positional en-
coding step P ∈ R
T ×D
m
was added after the embed-
ding step. Here, in our multi-omic task, the order of
the inputs is not important since there is no relation
between the features. Therefore, our multi-head at-
tention layers do not include the positional encoding
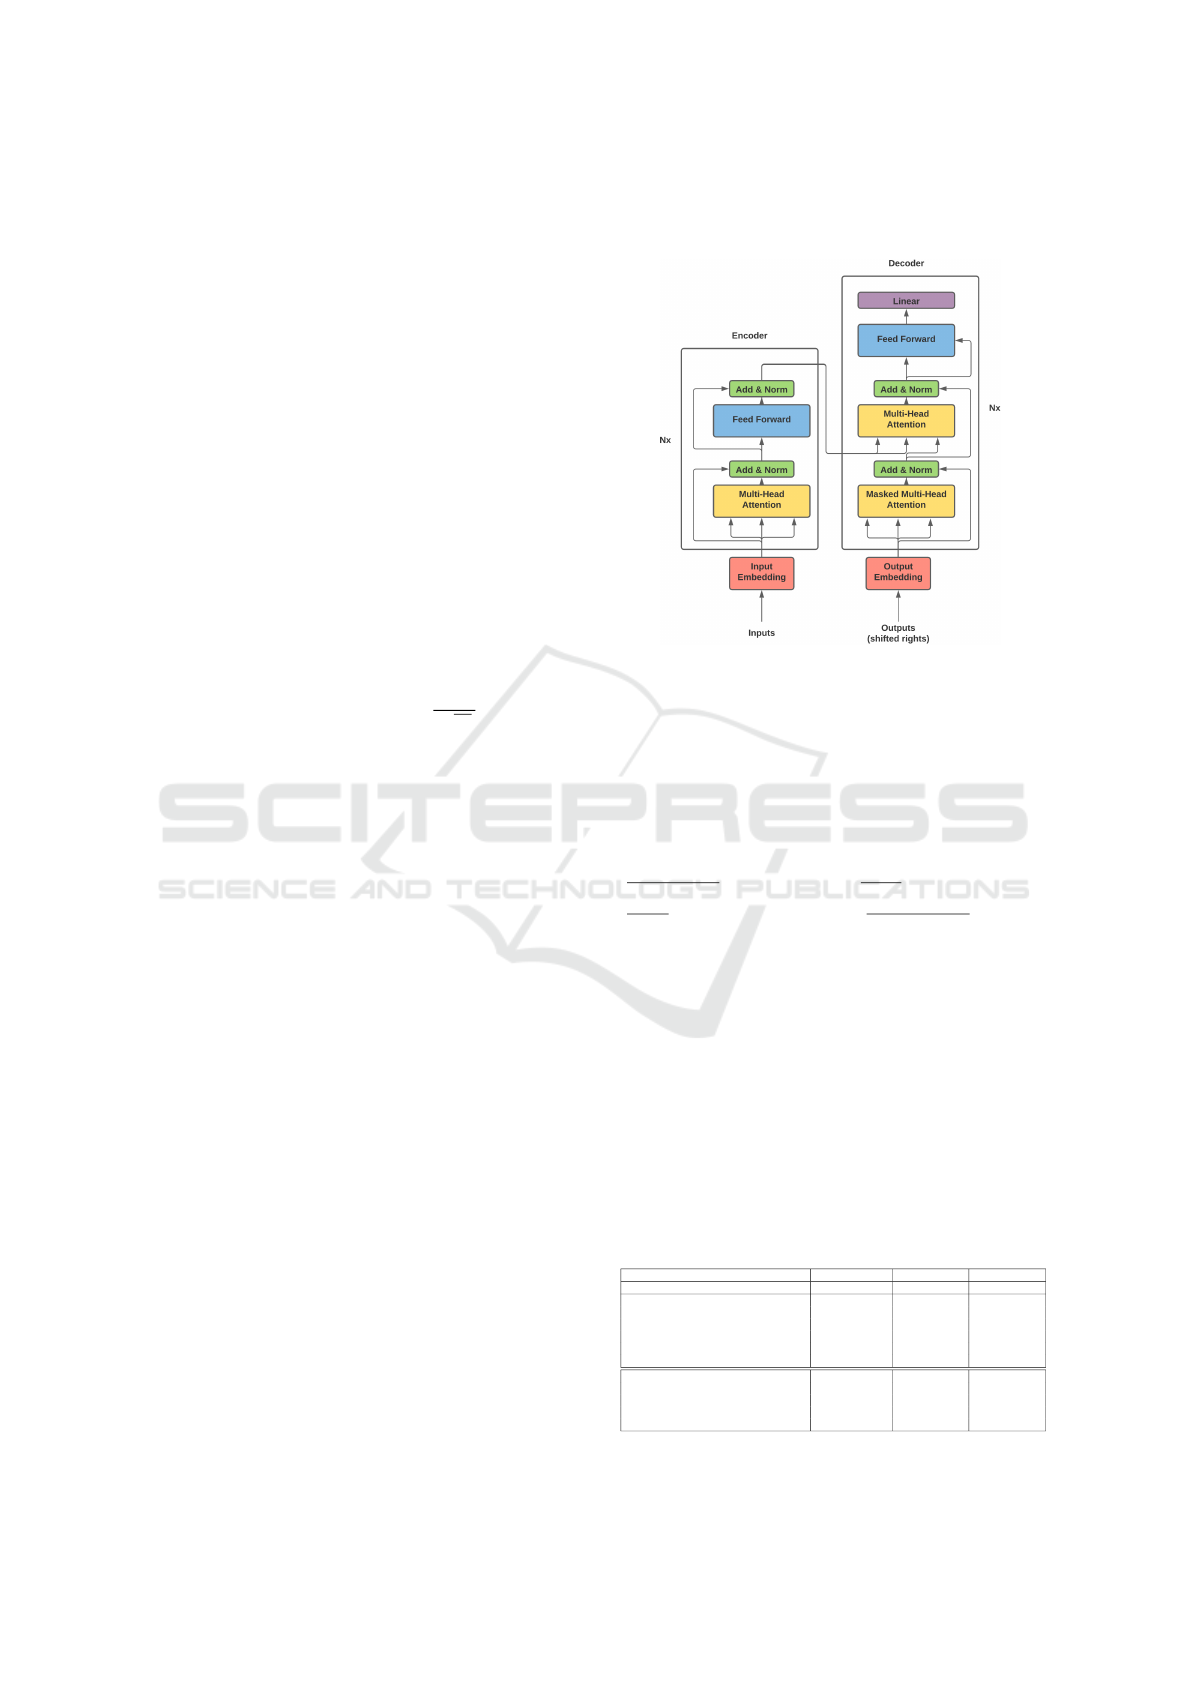
module. Figure 1 illustrates the MOT model which
is the original model introduced by Vaswani et al.
(Vaswani et al., 2017) without the positional encod-
ing step.
Figure 1: The MOT Model Architecture and Components.
3 RESULTS
3.1 Evaluation of Models Performance
To assess the performance of the models, we used
the traditional classification metrics: the accuracy
(
t p+tn
t p+ f p+tn+ f n
), the Recall (
t p
t p+ f n
), the Precision
(
t p
t p+ f p
) and the F1 score (2 ·
precision·recall
precision+recall
). Since
the dataset is imbalanced (see figure 3 in supplemen-
tary data), the F1 score is the metric used to asses the
models performance. The MOT model is trained and
evaluated on three partitions: a training set (70% of
the dataset), a validation set (10% of the dataset) and
a testing set (20% of the dataset). Table 1 provides
a summary of the distribution of the examples in the
dataset after the splitting before the data augmentation
step.
Table 1: Statistics distribution of the samples in the splitting
of the dataset. The first part of the table give the statistic
distribution of the missing omics views in the different part
of the dataset. The second part shows the repartition of the
different type of missing views.
Train Valid Test
Train size: 8820 Valid size: 981 Test size: 2451
Samples with at least ONE missing views 4595(52.10%) 472(48.11%) 1260(51.41%)
Samples with ONE missing views 2681(30.4%) 278(28.34%) 733(29.91%)
Samples with TWO missing views 760(8.62%) 75(7.65%) 222(9.06%)
Samples with THREE missing views 549(6.22%) 52(5.30%) 159(6.49%)
Samples with FOUR missing views 605(6.86%) 67(6.83%) 146(5.96%)
Samples without missing views 4225(47.90%) 509(51.88%) 1191(48.6%)
Samples with missing CpG sites 1904 205 541
Samples with missing miRNA 1086 107 279
Samples with missing RNA 923 93 222
Samples with missing CNV 1021 100 294
Samples with missing Protein 3334 347 902
MOT: A Multi-Omics Transformer for Multiclass Classification Tumour Types Predictions
255

The MOT model metric scores are presented in
the table 2 alongside with metric scores from Omi-
VAE (Zhang et al., 2019), OmiEmbed (Zhang et al.,
2021), XOmiVAE (Withnell et al., 2021) and Gen-
eTransfomer (Khan and Lee, 2021). OmiEmbed is
an extension of OmiVAE that integrated a multi-task
aspect to the original model previously introduced.
It targets simultaneously three tasks: the classifi-
cation of the tumour types (which is the main fo-
cus of this work), the regression (the age prediction
and other clinical features) and the survival predic-
tion. XOmiVAE is another extension of OmiVAE. It
is an activation level-based interpretable deep learn-
ing models explaining novel clusters generated by
VAE. GeneTransformer model is a transformer-based
model combining a One-dimensional Convolutional-
Neural Network (1D-CNN) and a transformer en-
coder block to extract features from 1D vectorized
gene expression levels from TCGA samples. Thus
it applies a DNN comprised of FCC to achieve the
multi-classification task. Although the inputs of these
models are not the same as the MOT model, since
they all share the same prediction task i.e. the multi-
classification of the 33 cancers of TCGA, we compare
them. Indeed, OmiVAE, OmiEmbed and XOmiVAE
used only 3 omics (miRNA, mRNA, and DNA methy-
lation) without any missing omics views and Gene-
Transformer only one omic view (mRNA). Thus to
make a fair comparison with MOT model, we evaluate
the MOT model on 4 different tests set configuration:
(1) on the samples with the 5 omics containing miss-
ing omics views, (2) only on the samples with the 3
omics (miRNA, mRNA, and DNA methylation) with-
out missing omics views, (3) only the samples with
only the mRNA omic and (4) on the samples with the
5 omics data without missing omics views. All re-
sults other than MOT are reported directly from their
original article.
There are interesting observations to be drawn
from the results presented at table 2. The comparison
of the MOT model vs. the models OmiVAE, OmiEm-
bed and XOmiVAE shows that the MOT performs as
well as those models and sometimes depending of
the metrics even better. Indeed, MOT(2) achieves a
F1 score of 97.33% which is slightly less than the
OmiVAE (97.5%). But, MOT(2) (97.33%) performs
better than OmiEmbed (96.83%) and outperformed
XOmiVAE (90%). In the other comparison case be-
tween MOT and GeneTransformer, MOT achieved a
better performance than GeneTransformer. MOT(3)
has 96.54% of F1-score while GeneTransformer has
95.64%. We also evaluate the performance of the
MOT model based on the availability of all the omics
views in the samples. MOT(4) achieves a F1-score
Table 2: Performance metrics of the models. MOT is evalu-
ated on the following settings: (1) on the samples with the 5
omics containing missing omics views, (2) only on the sam-
ples with the 3 omics (miRNA, mRNA, and DNA methy-
lation) without missing omics views, (3) only the samples
with the mRNA omic and (4) on the samples with the 5
omics data without missing omics views. The metrics per-
formance results of OmiVAE, OmiEmbed, XOmiVAE and
GeneTransformer are reported directly from their respective
papers. ’-’ means that metrics was not reported in their orig-
inal papers.
acc prec rec f1 score
OmiVAE 97.49 - - 97.5
OmiEmbed 97.71 - - 96.83
XOmiVAE - - - 90
GeneTransformer(8-Head) - 96.02 95.61 95.64
MOT(1) 96.74 96.97 96.74 96.74
MOT(2) 97.30 97.48 97.30 97.33
MOT(3) 96.5 96.75 96.5 96.54
MOT(4) 98.4 98.50 98.4 98.37
of 98.37% which is better than MOT(1) F1-score of
96.74%. This was the expected result, as most of the
models tend to perform better when all the data are
available. Table 5, in supplementary data, presents the
classification report obtained with scikit-learn. Other
than Rectum Adenocarcinoma (READ) cancer, MOT
performs well on all remaining cancer. In table 7 in
supplementary data, we also present the classification
report for the experiment with all the views available
for each sample.
3.2 Macro Interpretability
In the previous section, we demonstrated the model’s
ability to predict accurately the various cancer types.
Here, we further investigate the model ability to pro-
vide a level of interpretability. The aim of this anal-
ysis is to find which are the most important omics
views and their individual impact on the model de-
cision. In order to do this, an analysis of the multi-
heads attention layers of the transformer model was
performed. The goal is to investigate for each tumour
the most impacting omics views on the decision out-
put of the MOT model for this particular tumour. To
do so, all the weights of all the layers are combined
from each attention head. The weights are summed,
the average is calculated, and a reduction is performed
to obtain 5*5 arrays for each cancer sample. Then,
these arrays are used to obtain heat maps of the inter-
actions between all the omics views. We extract the
omics views from those heat maps with the highest
attention weights implying the most impact for each
cancer. Table 3 presents the finding. Most of the at-
tention weights are on the combination of the mRNA,
the miRNA and the DNA methylation omics views.
This is observed in 21 cancer cases. The second most
BIOINFORMATICS 2023 - 14th International Conference on Bioinformatics Models, Methods and Algorithms
256

observation is the focus of the attention weights on the
combination of mRNA and DNA Methylation which
occurs 4 times. In only two cases, we have an at-
tention focus on 4 views: the Glioblastoma multi-
form (GBM) and Brain Lower Grade Glioma (LGG)
cancers for which the model focus on the combina-
tion of mRNA, miRNA, DNA methylation and pro-
tein. The important information from this analysis
is that the MOT model uses information from mul-
tiple omics views (mostly 3) instead of just focusing
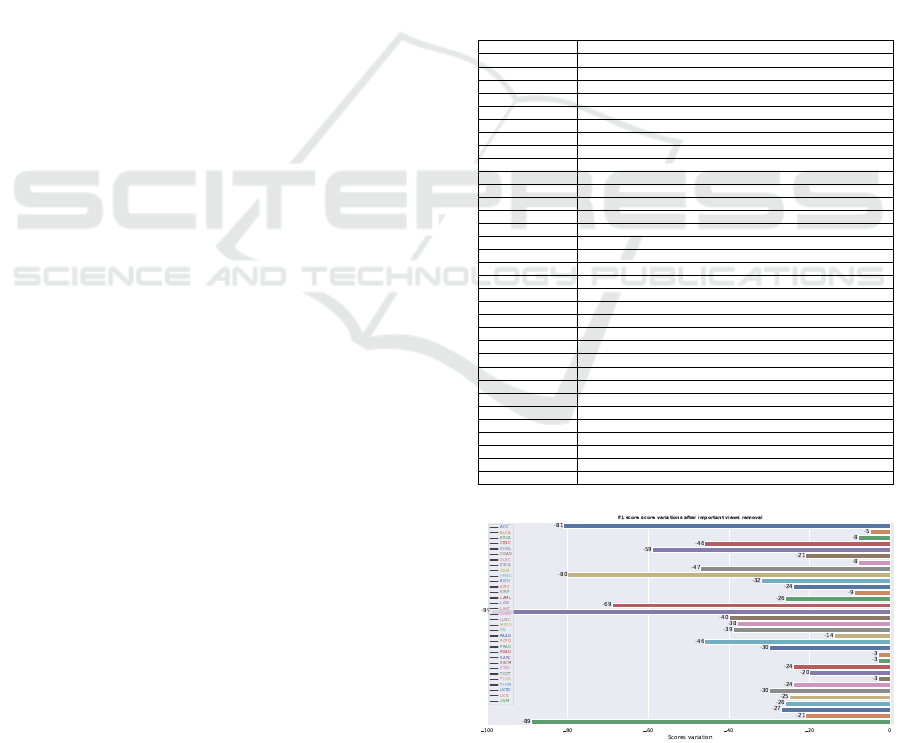
on a single one. Moreover, to analyze the impact of
the omics views with the highest attention scores, for
each cancer, the views identified in the table 3 are re-
moved from the test set for each cancer, and MOT is
re-evaluated. In figure 2 we illustrate the variation of
the f1 scores. There is a degradation for all of the
tumours when these omics are turned off. This ob-
servation supports the importance of these particular
omics for the tumours.
Table 3: Omics views with the highest attention weights for
each cancer.
Cancers CNVs DNA methylation miRNA mRNA protein
ACC X X
BLCA X X
BRCA X X
CESC X X X
CHOL X X X
COAD X X
DLBC X X X
ESCA X X X
GBM X X X X
HNSC X X X
KICH X X X
KIRC X X
KIRP X X X
LAML X X X
LGG X X X X
LIHC X X X
LUAD X X X
LUSC X X X
MESO X X X
OV X X X
PAAD X X X
PCPG X X
PRAD X X
READ X X
SARC X X X
SKCM X X
STAD X X X
TGCT X X X
THCA X X X
THYM X X X
UCEC X X X
UCS X X X
UVM X X X
4 DISCUSSION AND
CONCLUSIONS
This paper introduces MOT: a multi-omics trans-
former for multiclass classification tumour types pre-
dictions. The model is based on a deep learning
architecture, the transformer architecture with atten-
tion heads mechanisms (Vaswani et al., 2017). The
scarcity of certain omics data makes multi-omic stud-
ies difficult and prevents using the full range of omics.
Nevertheless, from the UCSC Xena data portal, five
omics data type (CNVs, DNA-methylation, miRNA,
mRNA and proteins) were extracted to build a multi-
omics dataset. These omics data each have vari-
ous feature space sizes ranging from a vast feature
space (396066 original features for DNA methyla-
tion) to a relatively small feature space (259 origi-
nal features for protein). This variation requires a
quasi-mandatory preprocessing step to integrate the
data correctly. These steps consist of a dataset dimen-
sion reduction via a feature selection and padding the
missing views. The padding was done by replacing
the values per 0, a bit drastic but our initial choice.
After the preprocessing steps, the MOT model was
trained and evaluated on the multi-omics dataset. The
hyper-parameter optimization, a crucial step in ma-
chine learning problems, was done with Optuna (Ak-
iba et al., 2019), an open-source hyper-parameter op-
timization framework to automate hyper-parameter
search. Through the training phase, a data augmenta-
tion step was performed. This step allows to diversify
the type and the number of examples seen during the
training phase with the primary purpose of increas-
ing the model robustness. From the basic experiment
scheme (i.e. train-test-validation scheme) the MOT
model obtains a F1-score of 96.74% (see MOT(1) in
table 2). Compared to other models presented in the
table 2, the MOT model is not technically the best
model. However, it does not use the same input data
although they all have the same prediction task. In
order to have a fair comparison of the MOT model,
multiple evaluations were performed. We assessed
the MOT performance on different test set: (2) only
on the samples with the 3 omics (miRNA, mRNA,
and DNA methylation) without missing omics views,
(3) only the samples with the mRNA omic and (4)
on the samples with the 5 omics data without missing
omics views. The first evaluation on the samples with
only 3 omics is to compare the model to the OmiVAE,
OmiEmbed and XOmiVAE models. The performance
reported in the table 2 demonstrate that MOT((2)) are
about the same or even better depending on the met-
rics. The second evaluation on the samples with the
mRNA omic is to compare MOT to the GeneTrans-
former model. In this case, we can observe that the
MOT performs better than the GeneTransformer. In
this case, our model benefits from the contribution of
the different omics views during the training phase.
The last experiment was to show the performance of
MOT: A Multi-Omics Transformer for Multiclass Classification Tumour Types Predictions
257

the model in the best-case scenario i.e. on the samples
with the 5 omics data without missing omics views. In
this case, the MOT model outperformed all the other
experiments cases and other models with an F1-score
of 98.37%. This demonstrates the excellent predic-
tion capability of the MOT model under ideal con-
ditions. It also emphasises the importance of using
multi-omics data. To our knowledge, this is the first
model able to integrate up to five omics views and be
as efficient on the multiclass classification prediction
task. The parameters of the best model obtained are
presented in the table 7 in supplementary data.
The internal structure of the model, i.e. the atten-
tion mechanism heads, gives the MOT model a dis-
tinctive edge worth exploiting. The attention weights
can help discover the most impactful views in the
model decision process in general and for each can-
cer types. This identification will help the clinical
decision-making process to better allocate resources
to acquire certain specific omics views for certain tu-
mour types. Table 3 shows the results of the analy-
sis of the heatmaps of the attention weights. From
this table we can draw the conclusion that the mRNA
omic view is important for the prediction task no mat-
ter the tumour types. This omic view is followed by
the DNA methylation which is the second omic view
most weighted by the model and generally in combi-
nation with the mRNA omic view. This is followed
by the miRNA omics views which is the 3rd most
activated omic view. Another important observation
from the table 3 is that at least 2 omics views are nec-
essary for the prediction task and most of the time
all the 3 principal omics (mRNA, DNA methylation
and miRNA) are used. For only two tumours, GBM
and LGG, the MOT model uses the protein omic view.
This can be explained by the fact that this is the less
developed omic view since not enough features are
available and produced for this omic view. The lack
of representation and probably the misrepresentation
could lead the proteomic view to be less important
in the decision-making process. The only case where
the MOT model uses the CNVs omic view is for the
Ovarian serous cystadenocarcinoma (OV) cancer. To
corroborate these findings, we elected to test the MOT
model on a subset: the same test set at least sam-
ples wise but without the most impactful views de-
termined by the model for each cancer and presented
in the table 3. The goal is to demonstrate the impact
of those views on performance degradation. Mixed
results are obtained (see figure 2). As expected, all
the performance decreases when the most impactful
omics views per cancer are removed from the test set.
The multi-omic transformer model introduced here
covers many important areas of multi-omics studies.
Although cancer has historically been viewed as a dis-
order of proliferation, recent evidence has suggested
that it should also be considered, in part, a metabolic
disease ((Beger, 2013),(Coller, 2014),(Seyfried et al.,
2014),(Lima et al., 2016)). Thus, we wonder if the
mRNA importance observed here is not due to an
over-representation. To ensure a better understand-
ing of the complex phenomena which is cancer, the
possible next steps of this model is to integrate the
metabolomic view into the fold. This would imply a
different integration process and a more comprehen-
sive picture of the cancer disease.
5 AVAILABILITY OF DATA AND
MATERIALS
The datasets generated and/or analysed during the
current study are available in the Xena Data portal
repository, cohort: TCGA Pan-Cancer (PANCAN):
https://pancanatlas.xenahubs.net. The CNVs data re-
trieved are available in the Synapse database, acces-
sion number: syn5011220.1. The DNA methylation
data retrieved are available in the Synapse database,
accession number: syn4557906.9. The mRNA data
retrieved are available in the Synapse database, ac-
cession number: syn4976369.3. The miRNA data
retrieved are available in the Synapse database, ac-
cession numbers: syn6171109 and syn7201053. The
proteins data retrieved are available in the Synapse
database, accession number: syn4216793.3. The
code is available at: https://github.com/dizam92/
multiomic predictions.
6 COMPETING INTERESTS
The authors declare that they have no competing in-
terests.
7 FUNDING
NSERC Intact Financial Corporation Industrial Re-
search Chair in Machine Learning for Insurance.
8 AUTHORS’ CONTRIBUTIONS
MAO and PT conceived the experiment(s). MAO
conducted the experiment(s). MAO, PT, JC and FL
analyzed the results, and wrote the manuscript. All
BIOINFORMATICS 2023 - 14th International Conference on Bioinformatics Models, Methods and Algorithms
258

authors reviewed the manuscript. All authors read and
approved the final manuscript.
ACKNOWLEDGEMENTS
A special thanks to Rogia Kpanou for her inputs in
this work. We also acknowledge the support of Com-
pute Canada for providing additional computational
support and also Dr Jacques Corbeil’s Canada Re-
search Chair in Medical Genomics.
REFERENCES
Akiba, T., Sano, S., Yanase, T., Ohta, T., and Koyama, M.
(2019). Optuna: A next-generation hyperparameter
optimization framework. In Proceedings of the 25rd
ACM SIGKDD International Conference on Knowl-
edge Discovery and Data Mining.
Arnedos, M., Vicier, C., Loi, S., Lefebvre, C., Michiels,
S., Bonnefoi, H., and Andre, F. (2015). Precision
medicine for metastatic breast cancer—limitations
and solutions. Nature reviews Clinical oncology,
12(12):693–704.
Ayan, E. and
¨
Unver, H. M. (2018). Data augmentation
importance for classification of skin lesions via deep
learning. In 2018 Electric Electronics, Computer
Science, Biomedical Engineerings’ Meeting (EBBT),
pages 1–4. IEEE.
Beger, R. D. (2013). A review of applications of
metabolomics in cancer. Metabolites, 3(3):552–574.
Bengio, Y. (2009). Learning deep architectures for AI. Now
Publishers Inc.
Bersanelli, M., Mosca, E., Remondini, D., Giampieri,
E., Sala, C., Castellani, G., and Milanesi, L.
(2016). Methods for the integration of multi-omics
data: mathematical aspects. BMC bioinformatics,
17(2):167–177.
Borad, M. J. and LoRusso, P. M. (2017). Twenty-first cen-
tury precision medicine in oncology: genomic profil-
ing in patients with cancer. In Mayo Clinic Proceed-
ings, volume 92, pages 1583–1591. Elsevier.
Buitinck, L., Louppe, G., Blondel, M., Pedregosa, F.,
Mueller, A., Grisel, O., Niculae, V., Prettenhofer, P.,
Gramfort, A., Grobler, J., Layton, R., VanderPlas, J.,
Joly, A., Holt, B., and Varoquaux, G. (2013). API de-
sign for machine learning software: experiences from
the scikit-learn project. In ECML PKDD Workshop:
Languages for Data Mining and Machine Learning,
pages 108–122.
Cao, K., Bai, X., Hong, Y., and Wan, L. (2020).
Unsupervised topological alignment for single-cell
multi-omics integration. Bioinformatics, 36(Supple-
ment 1):i48–i56.
Chaudhary, K., Poirion, O. B., Lu, L., and Garmire, L. X.
(2018). Deep learning–based multi-omics integration
robustly predicts survival in liver cancer. Clinical
Cancer Research, 24(6):1248–1259.
Coller, H. A. (2014). Is cancer a metabolic disease? The
American Journal of Pathology, 184(1):4–17.
Dias-Audibert, F. L., Navarro, L. C., de Oliveira, D. N., De-
lafiori, J., Melo, C. F. O. R., Guerreiro, T. M., Rosa,
F. T., Petenuci, D. L., Watanabe, M. A. E., Velloso,
L. A., et al. (2020). Combining machine learning
and metabolomics to identify weight gain biomarkers.
Frontiers in bioengineering and biotechnology, 8:6.
Garali, I., Adanyeguh, I. M., Ichou, F., Perlbarg, V., Seyer,
A., Colsch, B., Moszer, I., Guillemot, V., Durr, A.,
Mochel, F., et al. (2018). A strategy for multimodal
data integration: application to biomarkers identifica-
tion in spinocerebellar ataxia. Briefings in bioinfor-
matics, 19(6):1356–1369.
Goldman, M. J., Craft, B., Hastie, M., Repe
ˇ
cka, K., Mc-
Dade, F., Kamath, A., Banerjee, A., Luo, Y., Rogers,
D., Brooks, A. N., et al. (2020). Visualizing and in-
terpreting cancer genomics data via the xena platform.
Nature biotechnology, 38(6):675–678.
Haas, R., Zelezniak, A., Iacovacci, J., Kamrad, S.,
Townsend, S., and Ralser, M. (2017). Designing and
interpreting ‘multi-omic’experiments that may change
our understanding of biology. Current Opinion in Sys-
tems Biology, 6:37–45.
Khan, A. and Lee, B. (2021). Gene transformer: Transform-
ers for the gene expression-based classification of lung
cancer subtypes. arXiv preprint arXiv:2108.11833.
Kim, M. and Tagkopoulos, I. (2018). Data integration
and predictive modeling methods for multi-omics
datasets. Molecular omics, 14(1):8–25.
Kingma, D. P. and Welling, M. (2013). Auto-encoding vari-
ational bayes. arXiv preprint arXiv:1312.6114.
Kothari, C., Osseni, M. A., Agbo, L., Ouellette, G.,
D
´
eraspe, M., Laviolette, F., Corbeil, J., Lambert, J.-P.,
Diorio, C., and Durocher, F. (2020). Machine learning
analysis identifies genes differentiating triple negative
breast cancers. Scientific reports, 10(1):1–15.
Li, H., Siddiqui, O., Zhang, H., and Guan, Y. (2019).
Joint learning improves protein abundance prediction
in cancers. BMC biology, 17(1):1–14.
Lima, A. R., de Lourdes Bastos, M., Carvalho, M., and
de Pinho, P. G. (2016). Biomarker discovery in hu-
man prostate cancer: an update in metabolomics stud-
ies. Translational oncology, 9(4):357–370.
Lipinski, K. A., Barber, L. J., Davies, M. N., Ashenden,
M., Sottoriva, A., and Gerlinger, M. (2016). Cancer
evolution and the limits of predictability in precision
cancer medicine. Trends in cancer, 2(1):49–63.
Ma, A., McDermaid, A., Xu, J., Chang, Y., and Ma, Q.
(2020). Integrative methods and practical challenges
for single-cell multi-omics. Trends in Biotechnology.
Mamoshina, P., Volosnikova, M., Ozerov, I. V., Putin, E.,
Skibina, E., Cortese, F., and Zhavoronkov, A. (2018).
Machine learning on human muscle transcriptomic
data for biomarker discovery and tissue-specific drug
target identification. Frontiers in genetics, 9:242.
Masci, J., Meier, U., Cires¸an, D., and Schmidhuber, J.
(2011). Stacked convolutional auto-encoders for hi-
MOT: A Multi-Omics Transformer for Multiclass Classification Tumour Types Predictions
259
erarchical feature extraction. In International con-
ference on artificial neural networks, pages 52–59.
Springer.
Osseni, M. A., Tossou, P., Corbeil, J., and Laviolette,
F. (2021). Applying pyscmgroup to breast cancer
biomarkers discovery. In BIOINFORMATICS, pages
72–82.
Oviedo, F., Ren, Z., Sun, S., Settens, C., Liu, Z., Hartono,
N. T. P., Ramasamy, S., DeCost, B. L., Tian, S. I.,
Romano, G., et al. (2019). Fast and interpretable clas-
sification of small x-ray diffraction datasets using data
augmentation and deep neural networks. npj Compu-
tational Materials, 5(1):1–9.
Perez, L. and Wang, J. (2017). The effectiveness of data
augmentation in image classification using deep learn-
ing. arXiv preprint arXiv:1712.04621.
Poirion, O. B., Jing, Z., Chaudhary, K., Huang, S., and
Garmire, L. X. (2021). Deepprog: an ensemble of
deep-learning and machine-learning models for prog-
nosis prediction using multi-omics data. Genome
medicine, 13(1):1–15.
Reel, P. S., Reel, S., Pearson, E., Trucco, E., and Jeffer-
son, E. (2021). Using machine learning approaches
for multi-omics data analysis: A review. Biotechnol-
ogy Advances, page 107739.
Seyfried, T. N., Flores, R. E., Poff, A. M., and D’Agostino,
D. P. (2014). Cancer as a metabolic disease: im-
plications for novel therapeutics. Carcinogenesis,
35(3):515–527.
Sonsare, P. M. and Gunavathi, C. (2019). Investigation of
machine learning techniques on proteomics: A com-
prehensive survey. Progress in biophysics and molec-
ular biology, 149:54–69.
Vaswani, A., Shazeer, N., Parmar, N., Uszkoreit, J., Jones,
L., Gomez, A. N., Kaiser, Ł., and Polosukhin, I.
(2017). Attention is all you need. In Advances in
neural information processing systems, pages 5998–
6008.
Weng, S. F., Reps, J., Kai, J., Garibaldi, J. M., and Qureshi,
N. (2017). Can machine-learning improve cardiovas-
cular risk prediction using routine clinical data? PloS
one, 12(4):e0174944.
Withnell, E., Zhang, X., Sun, K., and Guo, Y. (2021). Xomi-
vae: an interpretable deep learning model for can-
cer classification using high-dimensional omics data.
Briefings in bioinformatics, 22(6):bbab315.
Wu, C., Zhou, F., Ren, J., Li, X., Jiang, Y., and Ma, S.
(2019). A selective review of multi-level omics data
integration using variable selection. High-throughput,
8(1):4.
Xu, J., Wu, P., Chen, Y., Meng, Q., Dawood, H., and Da-
wood, H. (2019). A hierarchical integration deep flex-
ible neural forest framework for cancer subtype classi-
fication by integrating multi-omics data. BMC bioin-
formatics, 20(1):1–11.
Young, J., Modat, M., Cardoso, M. J., Mendelson, A., Cash,
D., Ourselin, S., Initiative, A. D. N., et al. (2013). Ac-
curate multimodal probabilistic prediction of conver-
sion to alzheimer’s disease in patients with mild cog-
nitive impairment. NeuroImage: Clinical, 2:735–745.
Yu, L., Li, K., and Zhang, X. (2017). Next-generation
metabolomics in lung cancer diagnosis, treatment
and precision medicine: mini review. Oncotarget,
8(70):115774.
Zhang, X., Xing, Y., Sun, K., and Guo, Y. (2021). Omiem-
bed: a unified multi-task deep learning framework for
multi-omics data. Cancers, 13(12):3047.
Zhang, X., Zhang, J., Sun, K., Yang, X., Dai, C., and Guo,
Y. (2019). Integrated multi-omics analysis using vari-
ational autoencoders: Application to pan-cancer clas-
sification. In 2019 IEEE International Conference on
Bioinformatics and Biomedicine (BIBM), pages 765–
769. IEEE.
Zuo, C., Dai, H., and Chen, L. (2021). Deep cross-omics
cycle attention model for joint analysis of single-cell
multi-omics data. Bioinformatics.
APPENDIX
Table 4: Study Abbreviations.
Study Abbreviation Study Name
ACC Adrenocortical carcinoma
BLCA Bladder Urothelial Carcinoma
BRCA Breast invasive carcinoma
CESC Cervical squamous cell carcinoma and endocervical adenocarcinoma
CHOL Cholangiocarcinoma
COAD Colon adenocarcinoma
DLBC Lymphoid Neoplasm Diffuse Large B-cell Lymphoma
ESCA Esophageal carcinoma
GBM Glioblastoma multiforme
HNSC Head and Neck squamous cell carcinoma
KICH Kidney Chromophobe
KIRC Kidney renal clear cell carcinoma
KIRP Kidney renal papillary cell carcinoma
LAML Acute Myeloid Leukemia
LGG Brain Lower Grade Glioma
LIHC Liver hepatocellular carcinoma
LUAD Lung adenocarcinoma
LUSC Lung squamous cell carcinoma
MESO Mesothelioma
OV Ovarian serous cystadenocarcinoma
PAAD Pancreatic adenocarcinoma
PCPG Pheochromocytoma and Paraganglioma
PRAD Prostate adenocarcinoma
READ Rectum adenocarcinoma
SARC Sarcoma
SKCM Skin Cutaneous Melanoma
STAD Stomach adenocarcinoma
TGCT Testicular Germ Cell Tumors
THYM Thymoma
THCA Thyroid carcinoma
UCEC Uterine Corpus Endometrial Carcinoma
UCS Uterine Carcinosarcoma
UVM Uveal Melanoma
Figure 2: Metric evaluation of the MOT model for each can-
cer with each of views with the highest attention removed
from the test set.
BIOINFORMATICS 2023 - 14th International Conference on Bioinformatics Models, Methods and Algorithms
260
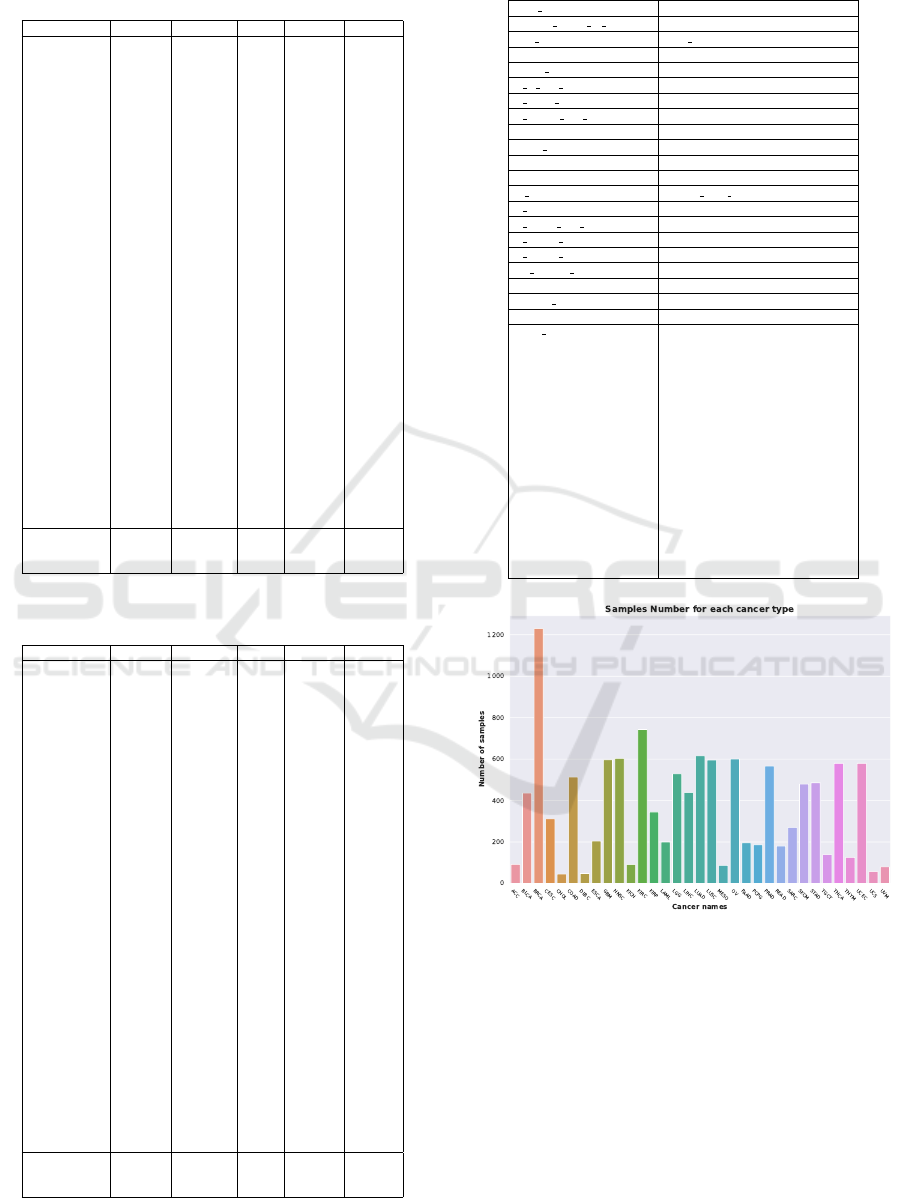
Table 5: Classification performance of the MOT on each
cancer label.
Cancers precision recall f1-score support
ACC 0.96 0.92 0.94 24
BLCA 0.96 0.99 0.97 89
BRCA 1.00 1.00 1.00 255
CESC 0.96 0.91 0.93 55
CHOL 1.00 0.86 0.92 7
COAD 0.94 0.85 0.89 118
DLBC 1.00 1.00 1.00 7
ESCA 0.94 1.00 0.97 34
GBM 0.98 0.92 0.95 132
HNSC 1.00 0.98 0.99 111
KICH 0.96 1.00 0.98 22
KIRC 0.99 0.97 0.98 145
KIRP 0.93 0.97 0.95 71
LAML 0.89 0.97 0.93 40
LGG 0.98 1.00 0.99 105
LIHC 0.99 1.00 0.99 86
LUAD 0.95 0.95 0.95 128
LUSC 0.95 0.95 0.95 115
MESO 0.93 1.00 0.96 13
OV 0.95 0.96 0.96 122
PAAD 0.98 1.00 0.99 50
PCPG 1.00 0.97 0.99 37
PRAD 1.00 1.00 1.00 106
READ 0.51 0.75 0.61 24
SARC 0.97 0.98 0.97 58
SKCM 1.00 0.99 0.99 87
STAD 1.00 0.98 0.99 96
TGCT 1.00 1.00 1.00 24
THCA 0.99 1.00 1.00 113
THYM 1.00 1.00 1.00 22
UCEC 0.95 0.98 0.97 129
UCS 0.88 0.88 0.88 8
UVM 1.00 1.00 1.00 18
accuracy 0.97 2451
macro avg 0.96 0.96 0.96 2451
weighted avg 0.97 0.97 0.97 2451
Table 6: Classification performance of the MOT on each
cancer label with all the 5 omics views available.
Cancers precision recall f1-score support
ACC 1.00 1.00 1.00 9
BLCA 0.97 0.99 0.98 72
BRCA 1.00 1.00 1.00 125
CESC 1.00 0.89 0.94 27
CHOL 1.00 0.67 0.80 3
COAD 0.96 0.88 0.92 51
DLBC 1.00 1.00 1.00 6
ESCA 1.00 1.00 1.00 17
GBM
HNSC 1.00 1.00 1.00 60
KICH 1.00 1.00 1.00 15
KIRC 1.00 1.00 1.00 44
KIRP 1.00 1.00 1.00 44
LAML
LGG 1.00 1.00 1.00 82
LIHC 0.97 1.00 0.99 38
LUAD 0.97 0.98 0.98 64
LUSC 0.95 0.95 0.95 40
MESO 1.00 1.00 1.00 9
OV
PAAD 0.96 1.00 0.98 26
PCPG 1.00 0.95 0.97 19
PRAD 1.00 1.00 1.00 57
READ 0.54 0.78 0.64 9
SARC 1.00 1.00 1.00 46
SKCM 1.00 1.00 1.00 59
STAD 1.00 1.00 1.00 48
TGCT 1.00 1.00 1.00 15
THCA 1.00 1.00 1.00 68
THYM 1.00 1.00 1.00 18
UCEC 0.95 0.98 0.97 64
UCS 1.00 0.86 0.92 7
UVM 1.00 1.00 1.00 2
accuracy 0.98 1144
macro avg 0.98 0.96 0.97 1144
weighted avg 0.99 0.98 0.98 1144
Table 7: Best MOT model parameters.
data size 2000
dataset views to consider all
exp type data aug
activation relu
batch size 256
d ff enc dec 2048
d input enc 2000
d model enc dec 512
dropout 0.44374742780410337
early stopping True
loss ce
lr 0.00039893650505836597
lr scheduler cosine with restarts
n epochs 500
n heads enc dec 8
n layers dec 1
n layers enc 6
nb classes dec 33
optimizer Adam
weight decay 0.005744062413504335
seed 42
class weights [4.03557312 ,0.85154295
,0.30184775 ,1.18997669
,8.25050505 ,0.72372851
,7.73484848 ,1.81996435
,0.62294082 ,0.61468995
,4.07992008 ,0.49969411
,1.07615283 ,1.85636364
,0.7018388 ,0.84765463
,0.60271547 ,0.62398778
,4.26750261 ,0.61878788
,1.89424861 ,1.98541565
,0.65595888 ,2.05123054
,1.37001006 ,0.77509964
,0.76393565 ,2.67102681
,0.64012539 ,2.94660895
,0.64012539 ,6.51355662
,4.64090909]
Figure 3: Distribution of the cancer in the dataset.
MOT: A Multi-Omics Transformer for Multiclass Classification Tumour Types Predictions
261
