
Retinal Image Segmentation with Small Datasets
Nchongmaje Ndipenoch, Alina Miron, Zidong Wang and Yongmin Li
Department of Computer Science, Brunel University London, Uxbridge, UB8 3PH, U.K.
Keywords:
Medical Imaging, Retinal Layers and Fluid Segmentation, Deep Learning, Convolutional Neural Network,
Optical Coherence Tomography (OCT).
Abstract:
Many eye diseases like Diabetic Macular Edema (DME), Age-related Macular Degeneration (AMD), and
Glaucoma manifest in the retina, can cause irreversible blindness or severely impair the central version. The
Optical Coherence Tomography (OCT), a 3D scan of the retina with high qualitative information about the
retinal morphology, can be used to diagnose and monitor changes in the retinal anatomy. Many Deep Learning
(DL) methods have shared the success of developing an automated tool to monitor pathological changes in the
retina. However, the success of these methods depends mainly on large datasets. To address the challenge from
very small and limited datasets, we proposed a DL architecture termed CoNet (Coherent Network) for joint
segmentation of layers and fluids in retinal OCT images on very small datasets (less than a hundred training
samples). The proposed model was evaluated on the publicly available Duke DME dataset consisting of 110 B-
Scans from 10 patients suffering from DME. Experimental results show that the proposed model outperformed
both the human experts’ annotation and the current state-of-the-art architectures by a clear margin with a mean
Dice Score of 88% when trained on 55 images without any data augmentation.
1 INTRODUCTION
Diabetic retinopathy (DR), a disease that damages the
blood vessels in the retina, is the most common cause
of blindness among working-aged adults in the United
States (Kles and Anderson, 2007). Among those af-
fected, approximately 21 million people develop dia-
betic macular edema (DME) (Bresnick, 1986). DME
is the accumulation of fluid in the macula that can
damage the blood vessels in the eye due to high blood
sugar over time. The macula is the retina’s centre at
the back of the eye, where vision is the sharpest.
Presently an effective treatment of eye diseases
exists in the form of anti-vascular endothelial growth
factor (anti-VEGF) therapy (Shienbaum et al., 2013).
However, the effectiveness of the treatment depends
on early diagnosis and frequent monitoring of the
progress of the disease. Also, anti-VEGF drugs are
expensive and need to be administered regularly.
Early diagnosis, effective frequent monitoring,
and behavioural advice from ophthalmologists, such
as diets and regular exercises, are key factors in pre-
venting or slowing down the disease’s progress. Still,
as of today, these are mostly done manually, which
is time-consuming, laborious, and prone to errors.
Hence, there is the need to develop an automated tool
to monitor retinal morphology and fluid accumulation
properly.
The Optical Coherence Tomography (OCT), a
high-resolution 3D non-invasive imaging modality of
the retina acquiring a series of cross-sectional slices
(B-scans), provides qualitative information and visu-
alisations of the retinal structure. The development
of an automated method to study the retina anatomy
from OCT B-Scans and hence the evaluation of eye
pathogens like DME will be of high value and impor-
tance.
To address the above problem, we propose a deep
learning based model, termed CoNet (Coherent Net-
work), for simultaneously segmenting layers and fluid
in retinal OCT B-Scans. In contrast to the common
approach of treating retinal layers and fluid regions
separately, CoNet provides an automatic solution for
simultaneously segmenting both.
The rest of the paper is organized as follows. A
brief review of the previous studies is provided in Sec-
tion 2. The description of the proposed method is
put forward in Section 3. The experiments and re-
sult analysis are presented in Section 4. Finally, the
conclusion with our contributions is described in Sec-
tion 5.
Ndipenoch, N., Miron, A., Wang, Z. and Li, Y.
Retinal Image Segmentation with Small Datasets.
DOI: 10.5220/0011779200003414
In Proceedings of the 16th International Joint Conference on Biomedical Engineering Systems and Technologies (BIOSTEC 2023) - Volume 2: BIOIMAGING, pages 129-137
ISBN: 978-989-758-631-6; ISSN: 2184-4305
Copyright
c
2023 by SCITEPRESS – Science and Technology Publications, Lda. Under CC license (CC BY-NC-ND 4.0)
129

2 BACKGROUND
The OCT was developed in the 1990s by (Huang
et al., 1991) but only became commercially available
in 2006. It permits fast image acquisition and suc-
cess in quantitative analysis because of its high qual-
ity and resolution. Some of the earliest segmenta-
tion approaches of retinal images include: segmen-
tation of retinal layers in OCT images using the graph
method (Garvin et al., 2009), segmentation of fluid in
the retina in patients suffering from Macular Edema
(ME) by (Abr
`
amoff et al., 2010), and the segmen-
tation of fluid using the active contours approach by
(Fernandez, 2005).
Other approaches used for the segmentation of
retinal OCT include: The traditional graph-cut meth-
ods by (Salazar-Gonzalez et al., 2014; Salazar-
Gonzalez et al., 2010; Salazar-Gonzalez et al., 2011;
Kaba et al., 2015), the Markov Random Fields by
(Salazar-Gonzalez et al., 2012; Wang et al., 2017),
probabilistic modelling (Kaba et al., 2014; Kaba et al.,
2013), dynamic programming by (Chiu et al., 2015),
level set by (Dodo et al., 2019a; Dodo et al., 2019b)
and a combination of a fuzzy C-means and level set
contour by (Wang et al., 2016).
Recent approaches have shifted to the Deep
Learning methods, some of which will be reviewed
briefly below.
(Fang et al., 2017) presented an approach to seg-
ment nine retinal boundaries from retinal OCT us-
ing a combination of convolutional neural network
(CNN) and graph search. Their approach was tested
on 60 volumes consisting of 2915 B-scans from 20
human eyes suffering with dry AMD. (Fauw et al.,
2018) presented a 3D U-Net (Cicek et al., 2016)
model framework for diagnosis and referral in retinal
disease. Their dataset consisted of 14,884 volumes
from 7,621 patients. The ReLayNet was presented by
(Roy et al., 2017), which is a 2D-like U-Net archi-
tecture to segment layers and fluids in the OCT im-
ages. The method was validated on the Duke DME
dataset (Chiu et al., 2015) which consists of 110 B-
Scans from 10 patients suffering from Diabetic Mac-
ular Edema (DME). Another CNN approach was re-
ported by (Lee et al., 2017) to segment fluid from
1,289 OCT images from patients suffering from Mac-
ular Edema (ME). (Lu et al., 2017) reported a CNN
approach to detect and segment three retinal fluid
types from OCT images and their method was val-
idated on the RETOUCH dataset (Bogunovi
´
c et al.,
2019). A neutrosophic transformation and a graph-
based shortest path to segment fluid in OCT images
was presented in (Rashno et al., 2017). Their method
was also evaluated on the DME dataset. A Deep
Learning approach for simultaneous segmentation of
layers and fluids in retinal OCT B-Scans from patients
suffering from AMD is proposed in (Ndipenoch et al.,
2022). The algorithm consists of the traditional U-Net
with an encoding and a decoding path, skip connec-
tion blocks, squeeze and exiting blocks and an Atrous
Spatial Pyramid Pooling (ASPP) block. The method
is validated on 1136 B-Scans from 24 patients. Other
CNN approaches to segment fluids in retinal OCT
modality includes (Schlegl et al., 2015; Venhuizen
et al., 2018; Gopinath and Sivaswamy, 2018; Girish
et al., 2018).
Previous studies indicate that in this domain U-
Net and CNN are the most popular methods used
but, U-Net tends to outperform CNN, and hence U-
Net is the preferred choice in many applications. An
overview of the related work is summarised in Table 1
below.
Table 1: Overview of the related work with references and
corresponding fluid and disease types.
Reference Class Disease
(Fernandez, 2005) Fluid AMD
(Garvin et al., 2009) Fluid –
(Abr
`
amoff et al., 2010) Fluid ME
(Salazar-Gonzalez et al., 2010) – –
(Salazar-Gonzalez et al., 2012) Optic disc DR
(Salazar-Gonzalez et al., 2014) B. vessel DR
(Chiu et al., 2015) Fluid DME
(Wang et al., 2016) Fluid DME
(Wang et al., 2017) Fluid DME
(Fang et al., 2017) Layers AMD
(Dodo et al., 2019a) Layers –
(Loo et al., 2018) Fluid ME
(Schlegl et al., 2015) Fluid –
(Venhuizen et al., 2018) Fluid AMD
(Gopinath and Sivaswamy, 2018)Fluid DME
(Girish et al., 2018) Fluid ME
(Lu et al., 2017) Fluid ME
(Fauw et al., 2018) Fluid –
(Roy et al., 2017) Fluid DME
(Rashno et al., 2017) Fluid DME
(Ndipenoch et al., 2022) Fluid/LayerAMD
3 METHOD
Deep Learning methods have had success in image
segmentation (pixel-wise classification) but this de-
pends hugely on large datasets. In medical imaging
obtaining a dataset is very challenging and often very
small and limited. We aim to provide a model that
performs very well on very small and limited datasets
BIOIMAGING 2023 - 10th International Conference on Bioimaging
130

of less than a hundred training images.
The proposed CoNet model is based on commonly
used U-Net architecture (Ronneberger et al., 2015)
but adapted to the specific problem of retina image
segmentation on very small datasets. The model
architecture consists of an encoding path, a decod-
ing path, a bottleneck, a classification layer, and an
Atrous Spatial Pyramid Pooling (ASPP) block, as
shown in Figure 1. In this section, we will explain our
method, the changes we made and how it is different
to the U-Net.
3.1 Encoding Path
The encoding path is use to capture local contextual
and spatial information. As we move down the en-
coding or contracting path the feature map is reduced
by half after every convolutional block by a convolu-
tional operation at the downsampling layer. A total of
three convolutional blocks are used and for each block
the convolutional operations are set up in the order of:
(1) convolutional layer which converts all the pixels of
the receptive field into a single value and passes it to
the next operation, (2) ReLU activation, to circumvent
the problem of vanishing gradient, (3) batch normali-
sation layer to prevent over-fitting during training, (4)
convolutional layer, and (5) ReLU activation. For the
convolutional operations a rectangular kernel size of
9 × 3 is used to match the rectangular shape of the
original B-Scans as opposed to the square kernel size
of 3 × 3 used in U-Net, also to ensure that the fea-
ture map before and after the convolutional layer is
the same padding was set to 3 × 1 still to match the
rectangular shape of the original B-Scans and finally
to ensure no overlapping when constructing the fea-
ture map a stride of 1 was used.
3.2 Decoding Path
The decoding path is used to enable precise localiza-
tion of the pixel and as we move up the decoding or
expansive path, before each convolutional block the
size of the feature maps is double by a convolutional
operation at the upsmapling layer. Same as in the en-
coding path a total of three convolutional blocks are
used and set up in the same order as mentioned in 3.1.
In addition to that, the upsampling layer was used to
to double the size of the feature map by capturing spa-
tial information from the previous feature map and
also to ensure that the size of the input image is the
same as the output image, the concatenating layer is
used to concatenate images from the encoder phase to
their corresponding decoder phase.
Because of the very small size of the dataset (only
55 B-Scans for training), we reduce the depth of the
network from 5 convolutional blocks as in the stan-
dard 2D U-Net to 3 in both the encoding and decoding
phase. Furthermore reducing the depth of the network
trains the model faster and uses less memory because
less parameters are used.
3.3 Bottleneck
Between the encoding and decoding paths is a bottle-
neck. The bottleneck serves as a bridge layer between
the encoding or contracting path and the decoding or
expansive path to ensure a smooth transition from one
path to the other. In CoNet, the bottleneck is made up
of a convolutional block that consists of six parts or
layers in the order of convolutional layer, ReLU acti-
vation, batch normalization layer, convolutional layer,
and ReLU activation. These layers were used for the
same reasons as mentioned in section 3.1
3.4 Atrous Spatial Pyramid Pooling
(ASPP)
The ASSP is a technique used to capture global con-
textual information on a multi-scale by applying mul-
tiple parallel filters with different frequencies or di-
lating rates on a given image or feature map (Chen
et al., 2017). To enhance the performance of the
ASSP block, global average pooling is used at the
last feature map to further capture global information.
The output of the parallel filters are concatenated us-
ing a 1 × 1 convolution to get the final results. While
ASSP is designed to capture global information, it is
also computational efficient.
No ASPP block is used in the standard 2D U-Net.
We have used an ASPP block as the input layer of
CoNet, and it consists of 4 parallel filters with a dilat-
ing rate of 6, 12, 18, and 24. To circumvent the prob-
lem of high fluid variability (the fluid class was absent
in some B-Scans for some patients) and an imbalance
dataset we have used the ASPP block in CoNet. The
ASPP block used in CoNet is illustrated in Figure 2.
3.5 Classification Layer
At the classification layer, we have used a convolu-
tional layer with a kernel size of 3, stride of 1 and
padding of 1. The task is to determine which class
out of the ten labelled classes each voxel or pixel of
the final feature map is assigned to. In the 2D U-Net
the same goal was achieved using the SoftMax acti-
vation.
Retinal Image Segmentation with Small Datasets
131
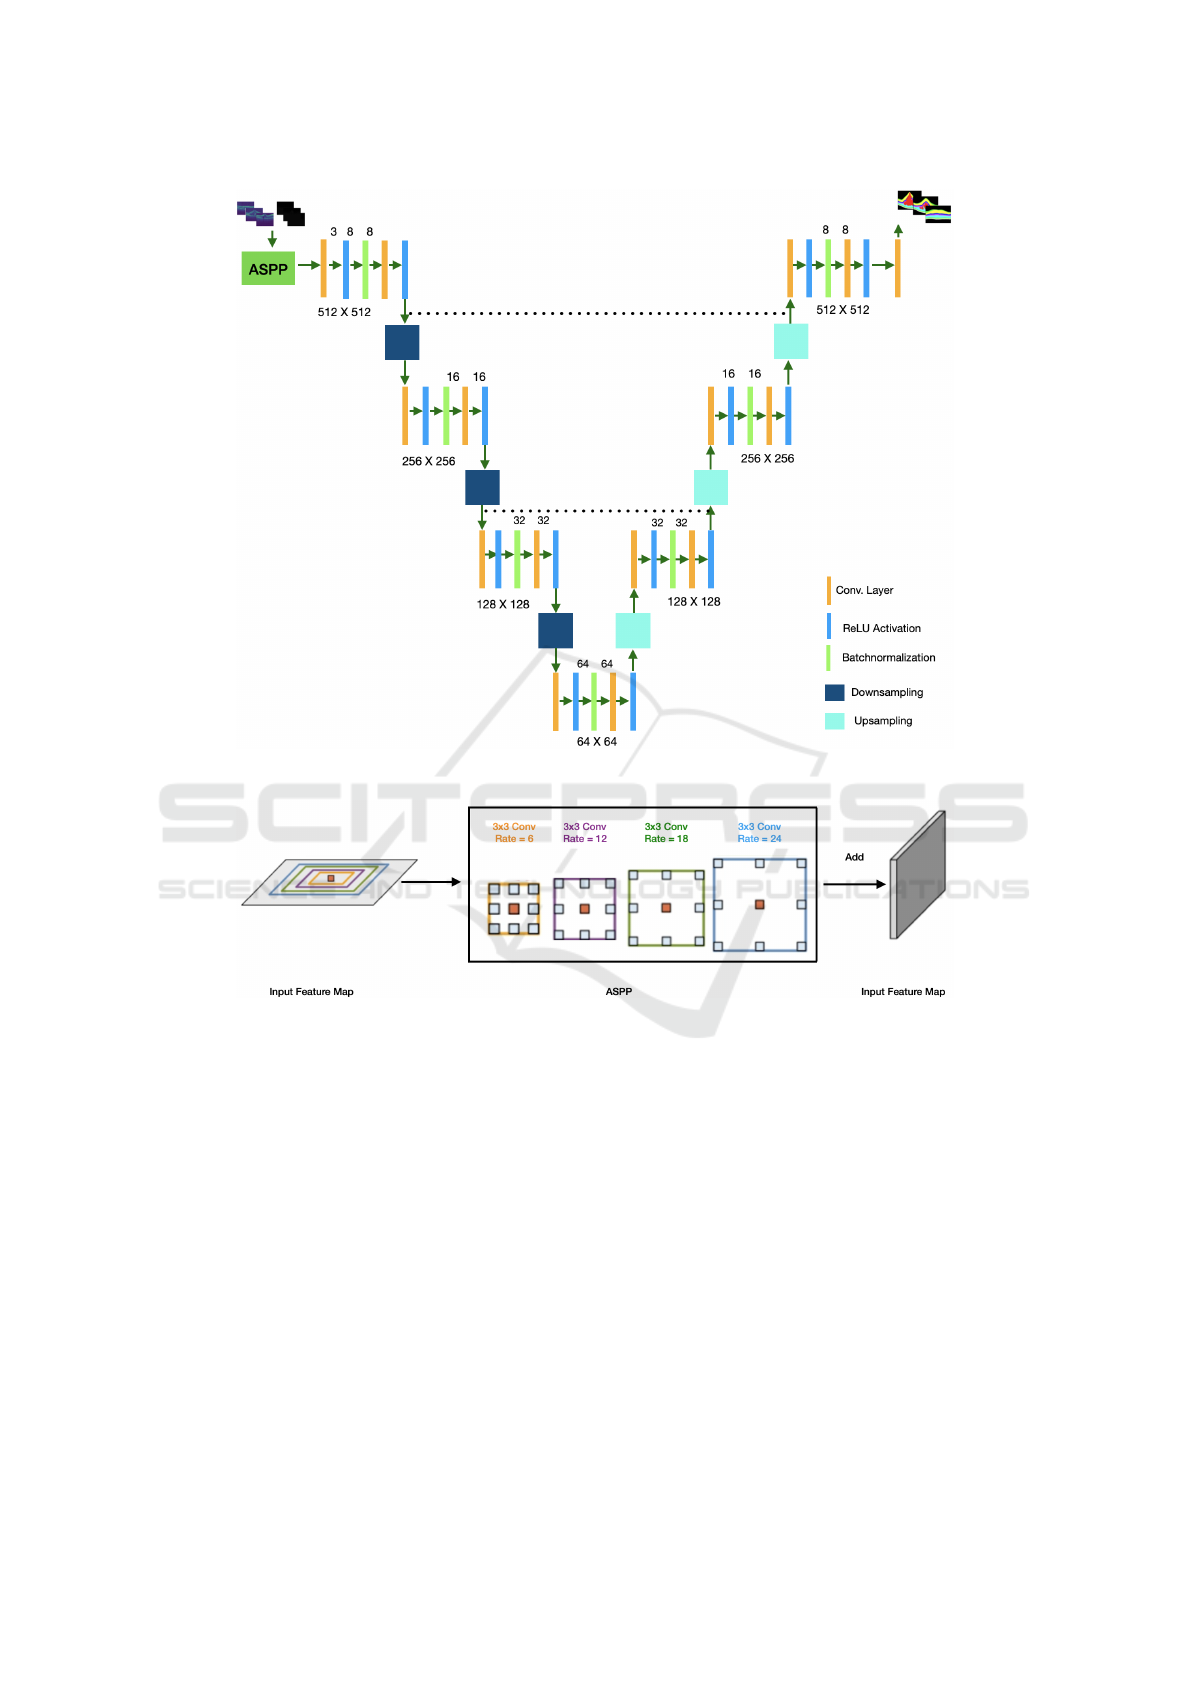
Figure 1: Architecture of the proposed CoNet, consisting of the ASPP block, the encoding path, the bottleneck, the decoding
path and the classification layer.
Figure 2: The ASPP blocks in the proposed model capture multi-scale information by applying multiple parallel filters with
different frequencies.
4 EXPERIMENTS
4.1 Dataset
The dataset used in the experiments is the Duke DME
dataset (Chiu et al., 2015) which is publicly avail-
able. It is consists of 110 B-scans from 10 patients
with severe DME pathology. It was collected using
the standard Spectralis (Heidelberg Engineering, Hei-
delberg, Germany). The volumetric scans were Q =
61 B-scans N = 768 A-scans with an axial resolu-
tion of 3.87 m/pixel, lateral resolution ranging from
11.07 - 11.59 m/pixel, and azimuthal resolution rang-
ing from 118 - 128 m/pixel. Annotation of the im-
ages was done by 2 human experts for three categories
(layer, fluid and background) consisting of 10 classes
(1 fluid, 2 backgrounds and 7 layers). In the past the
retinal OCT is layered for 10 layers but for lucidity
they are grouped into 7 distinct classes which are: In-
ner Limiting Membrane (ILM), Nerve Fiber ending
to Inner Plexiform Layer (NFL-IPL), Inner Nuclear
Layer (INL), and the Outer plexiform Layer (OPL).
A fluid class was identified and the two background
classes were the area above the retinal and the area
below the retinal.
In this work the annotated colors for the classes
are: Black which is the area above and below the reti-
nal, light green which is the ILM layer, yellow which
is the area between NFL and IPL layers, Blue which
is the INL, Pink which is the OPL layer, light blue
BIOIMAGING 2023 - 10th International Conference on Bioimaging
132
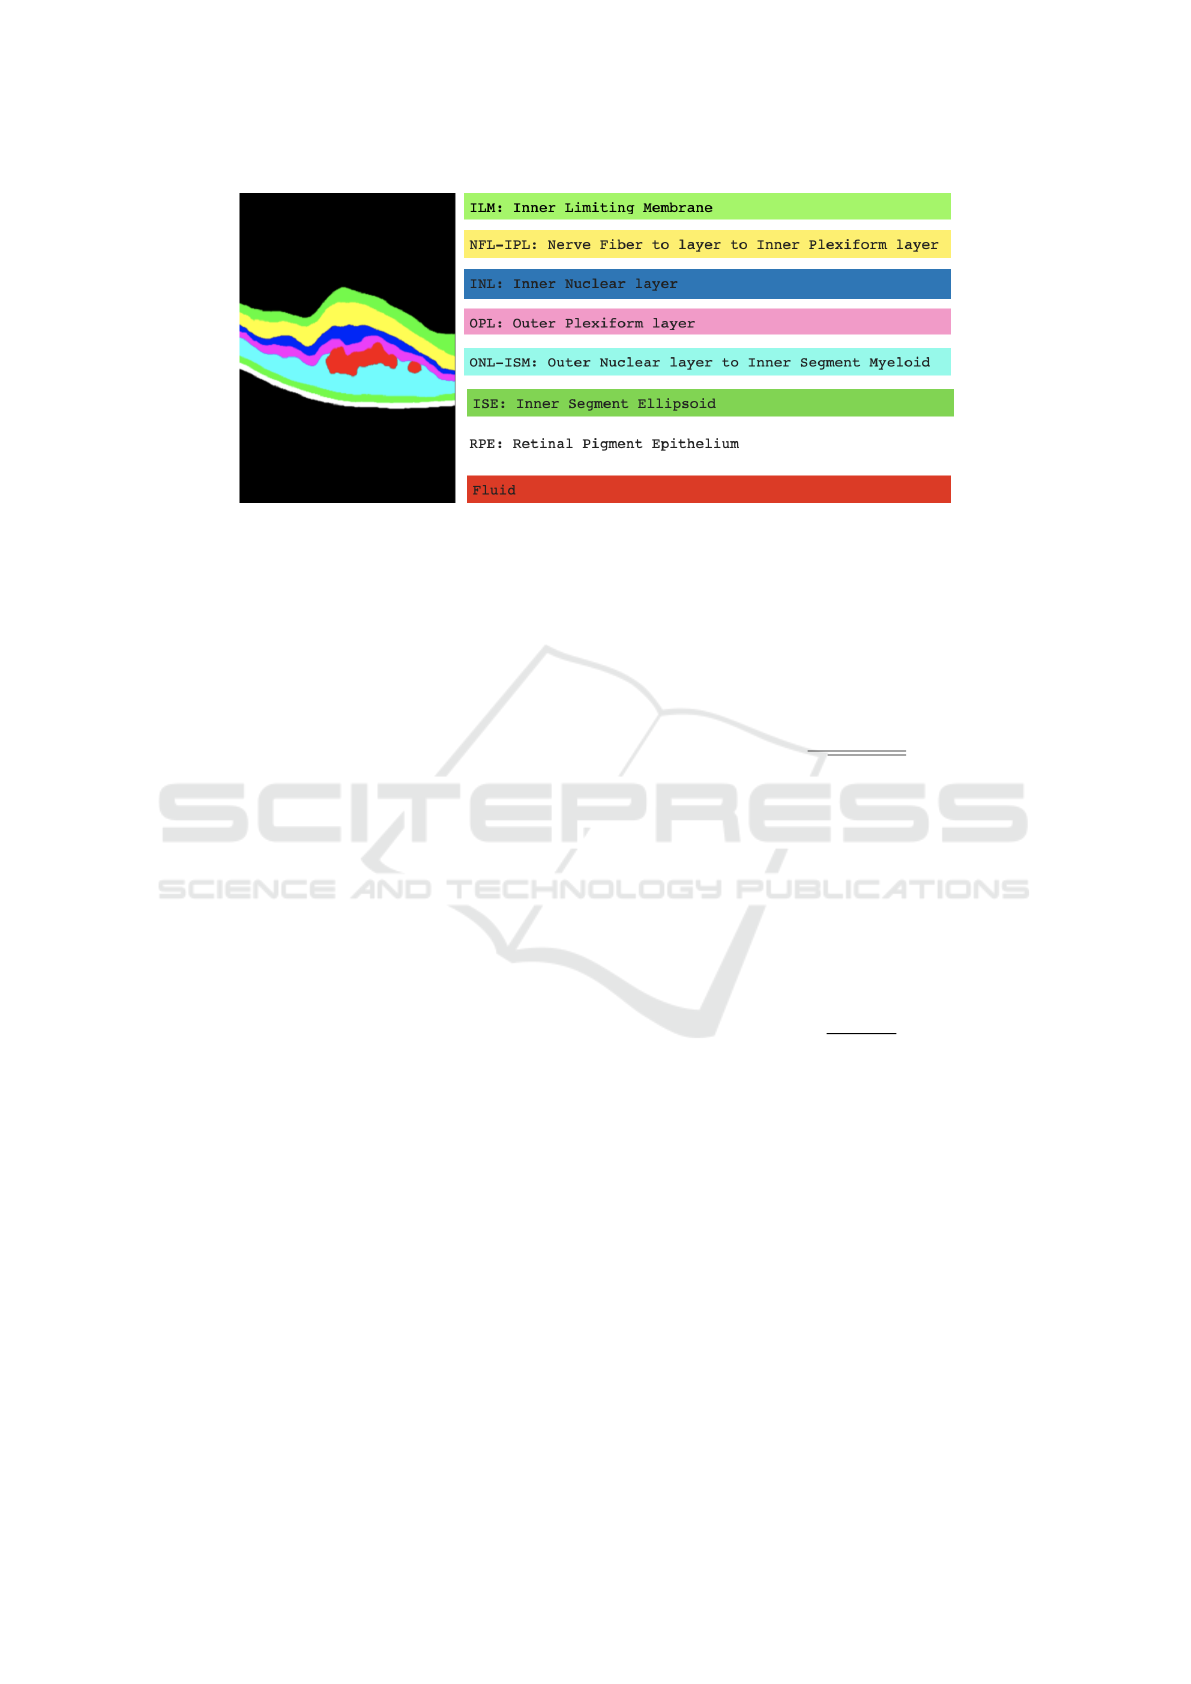
Figure 3: Annotation and labelling of the 10 segments (7 retinal layers, 2 backgrounds and 1 fluid) in the Duke DME dataset.
which is the area between the ONL and ISM layers,
Green which is the ISE layer, White which is the RPE,
and Red which is the fluid. An example of annotation
and labelling of classes is shown in Figure 3.
It is worth to note that the Duke DME dataset was
collected for two problems (layer and fluid segmenta-
tion). Also to add to the complexity of the dataset, the
fluid class demonstrates a high level of variability and
was not present in some B-Scans for some patients.
4.2 Training and Testing
Retinal OCT layers are complex in nature, coupling
with high level of variability of the fluid classes. It
is therefor a common practice to do segmentation of
layers and detection of fluids separately, but in this
work we performed both simultaneously which is a
harder task.
In this work training and testing were done using
annotation from expert 2.
Training was done on 55 B-Scans and no data aug-
mentation was used. We used B-Scans instead of the
entire volumes because of the anisotropic resolution
of OCT volumes and the present of possible motion
artifacts across B-scans.
K-fold cross validation was used for training, vali-
dation and testing. Parameters and environmental set-
tings where the same for the proposed model and the
comparison models to ensure fairness. B-Scans from
5 patients were used per fold, that is patients 1-5 in
the first fold and 6-10 in the second. To eliminate
bias the use of adjacent B-Scans in training, valida-
tion, and testing is not recommended. Across all the
experiments the parameters were set up as, still, the
same as in the comparison models: the value of k
was 2, the original B-Scans were resized to 512 ×512
pixels, the loss function used was Categorical cross-
entropy which provides an estimated probability be-
tween the predicted voxels and the ground truth for
the current state of the model, the batch size was set
to 4, the cost function was optimized using AdaDelta
and back-propagation using the chain rule, by default
the learning rate is set by AdaDelta as explained in
(Zeiler, 2012), and the model was trained for 200
epochs. The AdaDelta’s equation is shown in Eqn (1).
∆θ
t
= −
n
p
E[g
2
]
t
+ ε
g
t
(1)
Dice score also known as the F1 Score was the
evaluation metric used to measure the performance of
the algorithm. It gives a score of how well the pixels
are classified to belong to the correct class per class
in the range from 0 to 1 with 0 being the worst and
1 the perfect classification. In many medical image
segmentation problems Dice Score is the preferred
choice. The formula to calculate the Dice score is
shown in Eqn (2).
DSC =
2|X ∩Y |
|X| + |Y |
(2)
The fluid class was missing for some B-Scans for
some patients. Hence during testing the calculation of
Dice score for the fluid class was exempted from B-
scans with no fluid reference for that patient to avoid
over estimation or under estimation.
The models were trained on a GPU work station
with NVIDIA RTX A6000 48GB. The models were
implemented in Python, using PyTorch library.
4.3 Results
In this section we present and analyse the segment
class results measured in Dice score, of the proposed
CoNet and compare them to the comparison models
(the state-of-the-art, ReLayNet and baselines U-Net)
and the human expert annotation (Inter-observer).
Retinal Image Segmentation with Small Datasets
133
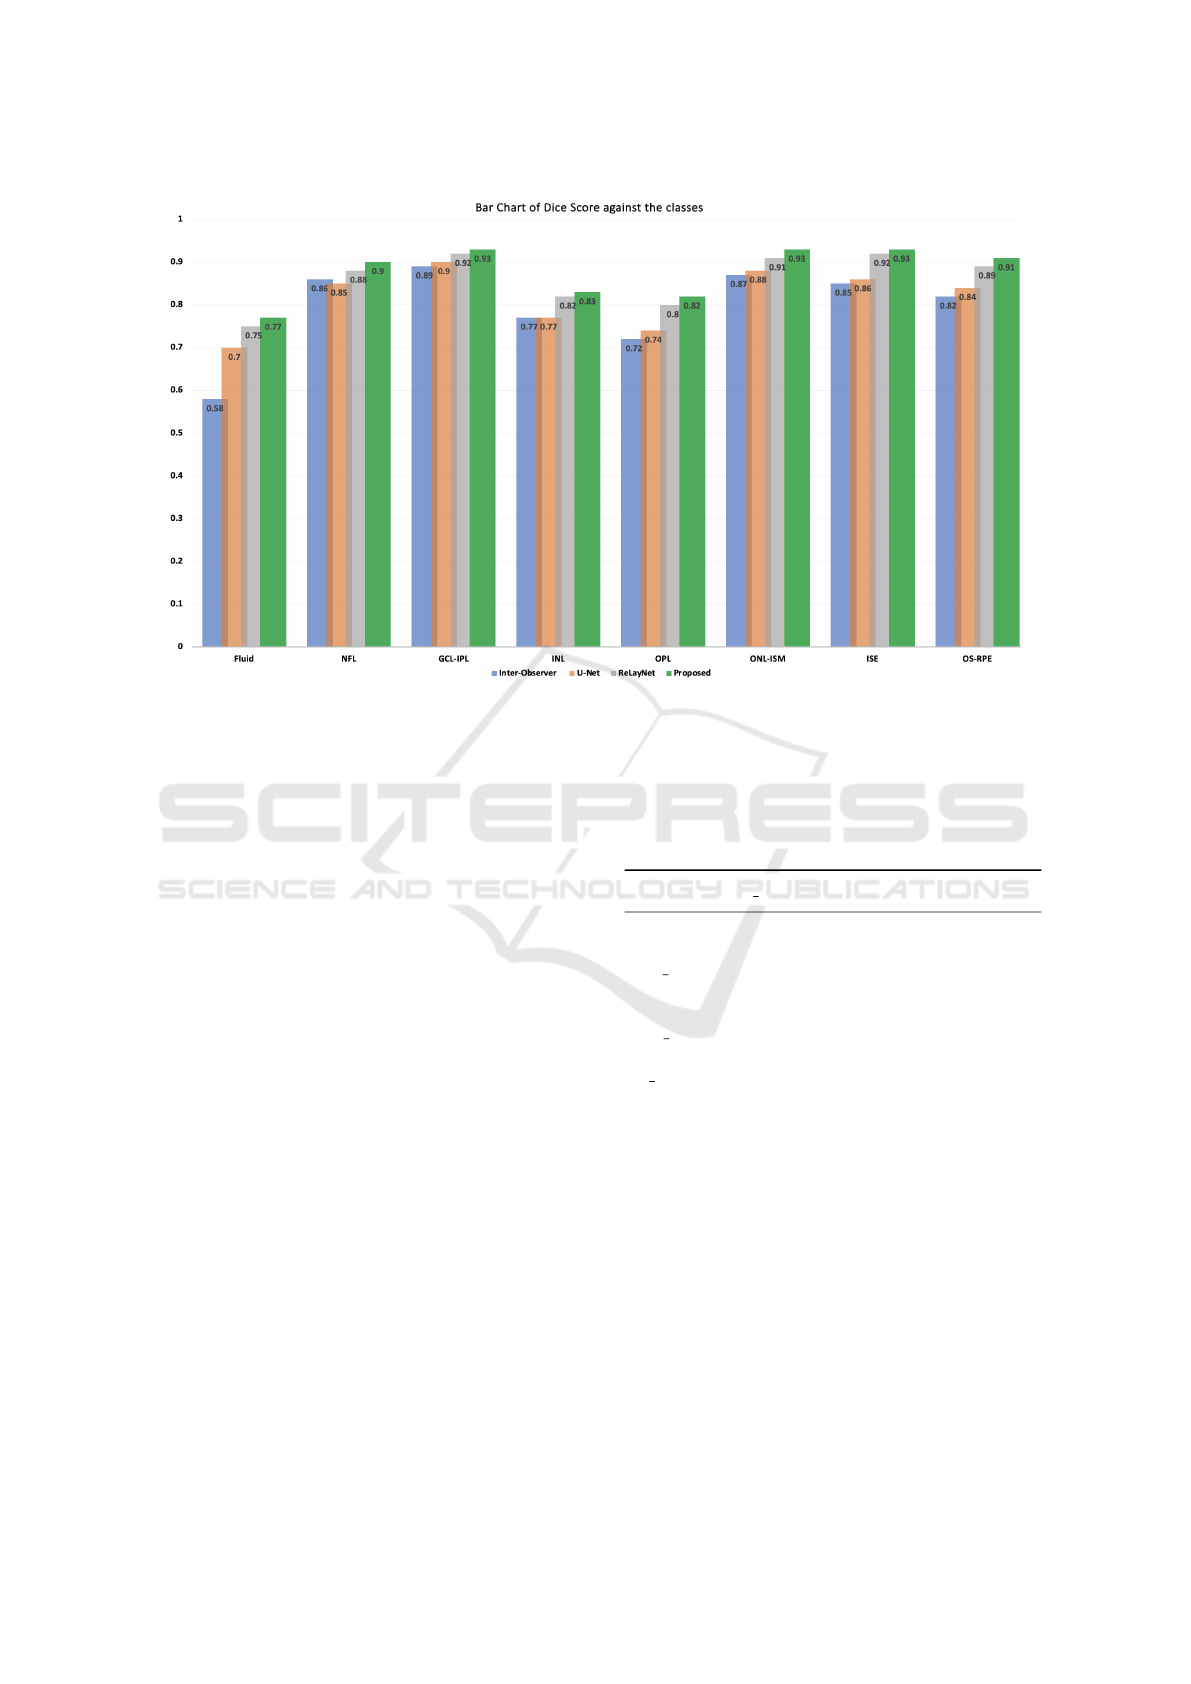
Figure 4: A Bar chart comparison of the performance in Dice score grouped by segment class of the inter-observers, U-Net,
RelayNet and the proposed CoNet.
A bar chart of the segmentation grouped by seg-
ment classes is shown in Figure 4, the Dice Scores
in Table 2, examples of the visualization results to-
gether with their annotations are illustrated in Fig-
ure 5 and a zoom in of a visualization output example
from CoNet is illustrated in Figure 6. Orange arrows
are used to show fine details in the annotated B-Scans
that were picked up by corresponding models. Anal-
ysis from our results show that:
1. The proposed model CoNet outperforms the hu-
man experts, the baseline (U-Net) and current
state-of-the-art model ReLayNet in every single
class by a clear margin.
2. CoNet obtained a Dice Score of 77% which
is 19% greater than the human experts’ (inter-
observer) in the fluid class which was the most
difficult to segment.
3. We obtained a Dice score of 90% and above in 8
out of the 10 classes.
4. The baseline U-Net, the state-of-the-art architec-
ture RelayNet, and the proposed CoNet all ob-
tained a perfect Dice Score of 100% in both back-
ground classes (area above and below the retinal).
5. CoNet obtained an overall mean Dice Score of
88% which is 8% higher than that of the human
experts’ annotation results of 80%.
6. We noticed an increase of performance from the
standard U-Net to a shallower and less com-
plex architectures in the order of ReLayNet, and
CoNet.
Table 2: Segmentation performance (Dice Scores) by seg-
ment classes (rows) and models (columns).
Inter Obs. U-Net ReLayNet
Proposed
Fluid 0.58 0.70 0.75 0.77
NFL 0.86 0.85 0.88 0.90
GCL IPL 0.89 0.90 0.92 0.93
INL 0.77 0.77 0.82 0.83
OPL 0.72 0.74 0.80 0.82
ONL ISM 0.87 0.88 0.91 0.93
ISE 0.85 0.86 0.92 0.93
OS RPE 0.82 0.84 0.89 0.91
5 CONCLUSIONS
In this paper, we have presented the CoNet, a Deep
Learning approach for the joint layers and fluids seg-
mentation of retinal OCT B-Scans. The model was
evaluated on the publicly available Duke DME dataset
consisting of 110 B-Scans without any data augmen-
tation. Taking into consideration of the specific char-
acteristics of the problem, in particular with small
available dataset, the proposed model has the follow-
ing distinct features compared to the previous U-Net
based models:
1. We have reduced the depth of the network from 5
BIOIMAGING 2023 - 10th International Conference on Bioimaging
134
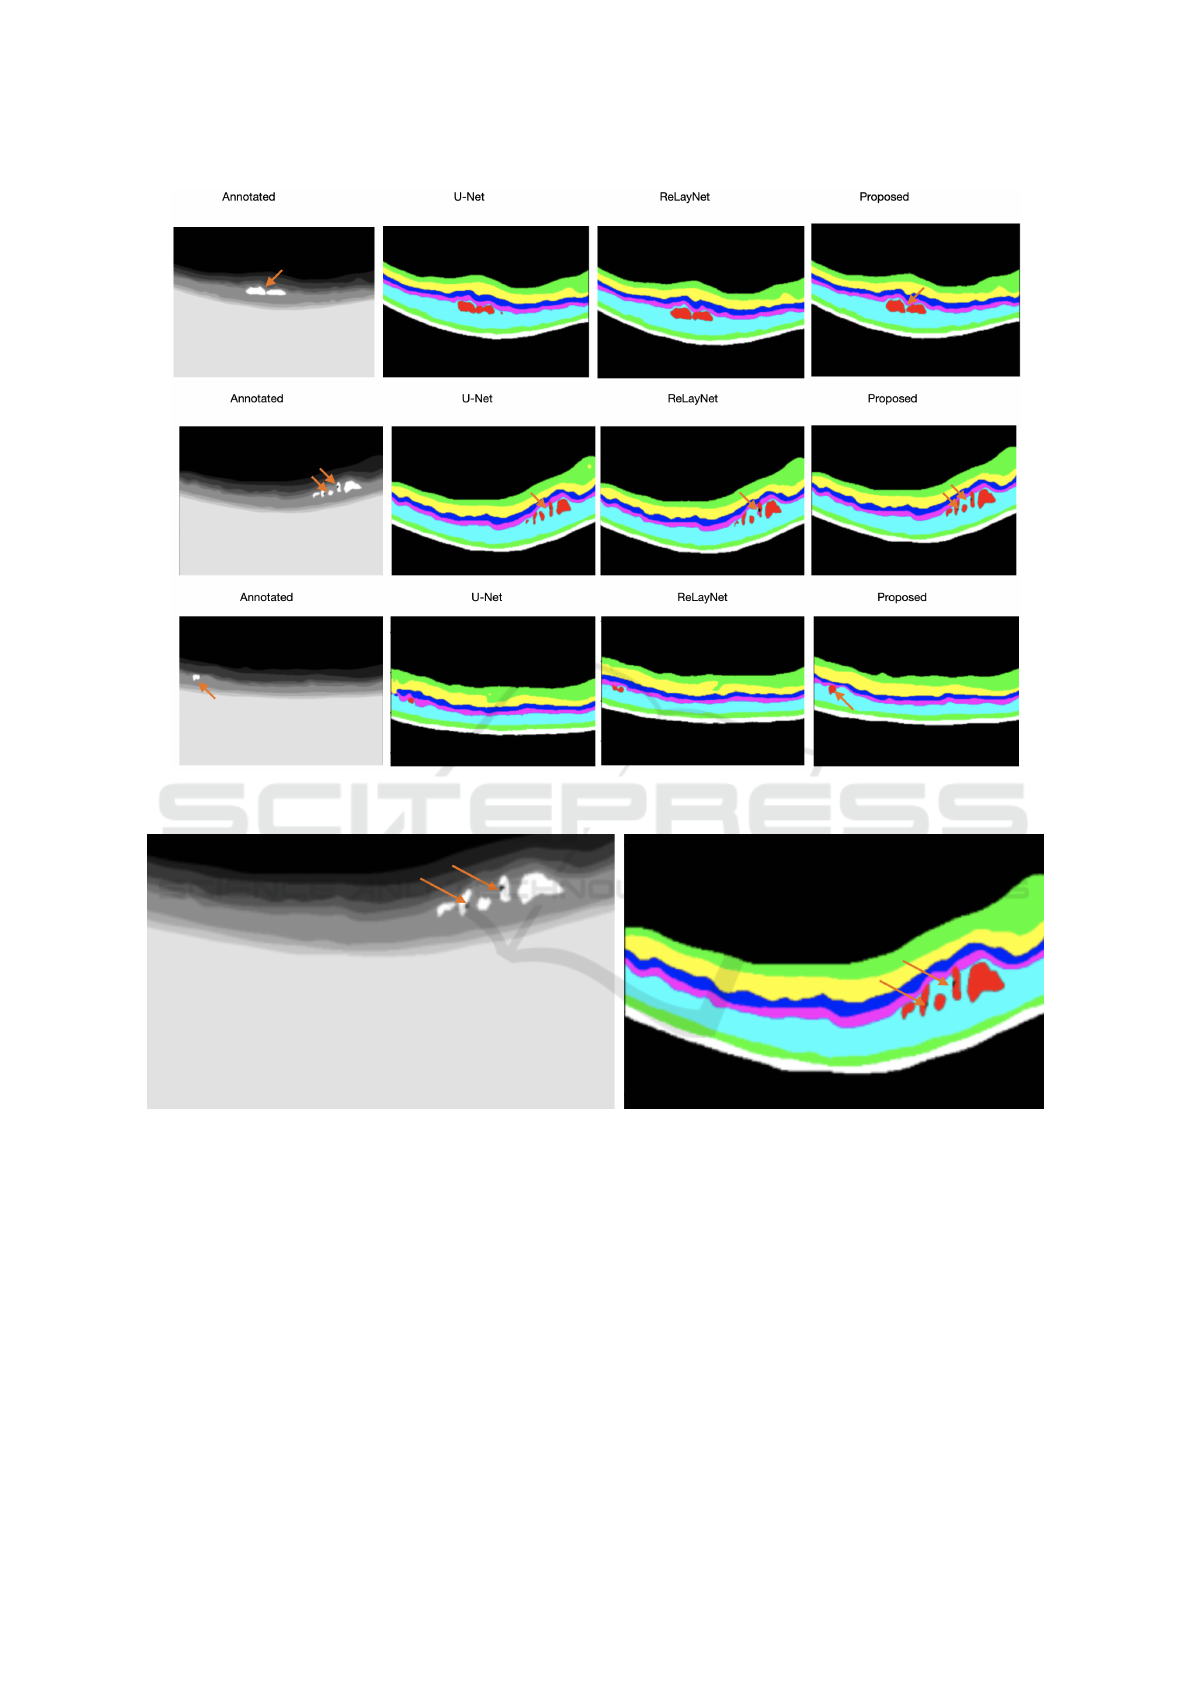
Figure 5: Examples to illustrate the visualisation output of U-Net, ReLayNet and the proposed CoNet, in order of the inputs,
annotations and outputs with orange arrows to demonstrate fine details picked up by the models.
Figure 6: A Zoom in of the B-scan of the second row in Figure 5 to highlight the fine details picked up by the CoNet using
orange arrows.
to 3 convolutional blocks. This was done because
of the very small size of the dataset (only 55 B-
Scans were used during training and the rest 55 for
testing). Deeper and more complex architectures
turn to yield poorer results. Also, reducing the
depth of the network enhances the training speed
of the network and uses less memory since less
parameters are used.
2. We have introduced an ASPP block at the input
layer to capture global information from the input
image, because the dataset demonstrates a high
level of variability. The fluid class was not present
in some B-Scans for some patients.
3. At the classification layer to classify each pixel to
belong to one of the 10 classes we have used a
convolutional layer instead of the SoftMax acti-
vation. This was because using the convolutional
layer for the classification of the fluid class which
is highly variable yielded a better and more accu-
rate results.
4. We have used a rectangular kernel size of 9 × 3
instead of the square kernel size of 3 × 3 to match
Retinal Image Segmentation with Small Datasets
135

the rectangular shape of the original B-Scans.
Evaluation was done on the basis of Dice Score
which is a standard method of evaluating segmenta-
tion problems. Experimental results show that the
proposed model outperformed both the human ex-
perts’ annotation and the current state-of-the-art ar-
chitectures by a clear margin, even on a very small,
imbalanced and complex dataset with a high degree
of presence of pathology that severely affects the nor-
mal morphology of the retina.
The dataset was collected for 2 problems (layers
and fluid segmentation) which can be experimented
separately but we decided to do both jointly together
which is a more challenging task.
The CoNet can be directly applied to solve real
world problems and to monitor the progress of eye
diseases such as diabetic macular edema (DME), age-
related macular degeneration (AMD) and Glaucoma.
In the future we will evaluate the CoNet on other
benchmark datasets, and compare our results to other
state-of-the-art models. Also we plan to extend the
current 2D network to 3D.
REFERENCES
Abr
`
amoff, M. D., Garvin, M. K., and Sonka, M. (2010).
Retinal imaging and image analysis. IEEE reviews in
biomedical engineering, 3:169–208.
Bogunovi
´
c, H., Venhuizen, F., Klimscha, S., Apostolopou-
los, S., Bab-Hadiashar, A., Bagci, U., Beg, M. F.,
Bekalo, L., Chen, Q., Ciller, C., et al. (2019). Re-
touch: the retinal oct fluid detection and segmentation
benchmark and challenge. IEEE transactions on med-
ical imaging, 38(8):1858–1874.
Bresnick, G. H. (1986). Diabetic macular edema: a review.
Ophthalmology, 93(7):989–997.
Chen, L.-C., Papandreou, G., Kokkinos, I., Murphy, K., and
Yuille, A. L. (2017). Deeplab: Semantic image seg-
mentation with deep convolutional nets, atrous convo-
lution, and fully connected crfs. IEEE transactions on
pattern analysis and machine intelligence, 40(4):834–
848.
Chiu, S., Allingham, M., Mettu, P., Cousins, S., Izatt, J., and
Farsiu, S. (2015). Kernel regression based segmen-
tation of optical coherence tomography images with
diabetic macular edema. Biomedical Optics Express,
6.
Cicek, O., Abdulkadir, A., Lienkamp, S., Brox, T., and Ron-
neberger, O. (2016). 3D U-Net: Learning dense volu-
metric segmentation from sparse annotation.
Dodo, B. I., Li, Y., Kaba, D., and Liu, X. (2019a). Retinal
layer segmentation in optical coherence tomography
images. IEEE Access, 7:152388–152398.
Dodo, B. I., Li, Y., and Liu, X. (2019b). Level set segmenta-
tion of retinal oct images. In International Conference
on Bioimaging. Czech Republic.
Fang, L., Cunefare, D., Wang, C., Guymer, R. H., Li, S.,
and Farsiu, S. (2017). Automatic segmentation of
nine retinal layer boundaries in oct images of non-
exudative amd patients using deep learning and graph
search. Biomedical optics express, 8(5):2732–2744.
Fauw, J., Ledsam, J., Romera-Paredes, B., Nikolov, S.,
Tomasev, N., Blackwell, S., Askham, H., Glorot, X.,
ODonoghue, B., Visentin, D., Driessche, G., Lak-
shminarayanan, B., Meyer, C., Mackinder, F., Bou-
ton, S., Ayoub, K., Chopra, R., King, D., Karthike-
salingam, A., and Ronneberger, O. (2018). Clinically
applicable deep learning for diagnosis and referral in
retinal disease. Nature Medicine, 24.
Fernandez, D. C. (2005). Delineating fluid-filled region
boundaries in optical coherence tomography images
of the retina. IEEE transactions on medical imaging,
24(8):929–945.
Garvin, M. K., Abramoff, M. D., Wu, X., Russell, S. R.,
Burns, T. L., and Sonka, M. (2009). Automated 3-
d intraretinal layer segmentation of macular spectral-
domain optical coherence tomography images. IEEE
transactions on medical imaging, 28(9):1436–1447.
Girish, G., Thakur, B., Chowdhury, S. R., Kothari, A. R.,
and Rajan, J. (2018). Segmentation of intra-retinal
cysts from optical coherence tomography images
using a fully convolutional neural network model.
IEEE journal of biomedical and health informatics,
23(1):296–304.
Gopinath, K. and Sivaswamy, J. (2018). Segmentation of
retinal cysts from optical coherence tomography vol-
umes via selective enhancement. IEEE journal of
biomedical and health informatics, 23(1):273–282.
Huang, D., Swanson, E. A., Lin, C. P., Schuman, J. S., Stin-
son, W. G., Chang, W., Hee, M. R., Flotte, T., Gregory,
K., Puliafito, C. A., et al. (1991). Optical coherence
tomography. science, 254(5035):1178–1181.
Kaba, D., Salazar-Gonzalez, A. G., Li, Y., Liu, X., and
Serag, A. (2013). Segmentation of retinal blood ves-
sels using gaussian mixture models and expectation
maximisation. In International Conference on Health
Information Science, pages 105–112.
Kaba, D., Wang, C., Li, Y., Salazar-Gonzalez, A., Liu, X.,
and Serag, A. (2014). Retinal blood vessels extrac-
tion using probabilistic modelling. Health Informa-
tion Science and Systems, 2(1):2.
Kaba, D., Wang, Y., Wang, C., Liu, X., Zhu, H., Salazar-
Gonzalez, A. G., and Li., Y. (2015). Retina layer
segmentation using kernel graph cuts and continuous
max-flow. Optics Express, 23(6):7366–7384.
Kles, J. B. M.-K. A. and Anderson, P. W. (2007). How the
diabetic eye loses vision.
Lee, C. S., Tyring, A. J., Deruyter, N. P., Wu, Y., Rokem,
A., and Lee, A. Y. (2017). Deep-learning based, au-
tomated segmentation of macular edema in optical
coherence tomography. Biomedical optics express,
8(7):3440–3448.
Loo, J., Fang, L., Cunefare, D., Jaffe, G. J., and Farsiu, S.
(2018). Deep longitudinal transfer learning-based au-
tomatic segmentation of photoreceptor ellipsoid zone
defects on optical coherence tomography images of
BIOIMAGING 2023 - 10th International Conference on Bioimaging
136

macular telangiectasia type 2. Biomedical optics ex-
press, 9(6):2681–2698.
Lu, D., Heisler, M., Lee, S., Ding, G., Sarunic, M. V., and
Beg, M. F. (2017). Retinal fluid segmentation and de-
tection in optical coherence tomography images us-
ing fully convolutional neural network. arXiv preprint
arXiv:1710.04778.
Ndipenoch, N., Miron, A., Wang, Z., and Li, Y. (2022). Si-
multaneous segmentation of layers and fluids in retinal
oct images. In 2022 15th International Congress on
Image and Signal Processing, BioMedical Engineer-
ing and Informatics (CISP-BMEI), pages 1–6. IEEE.
Rashno, A., Koozekanani, D. D., Drayna, P. M., Nazari, B.,
Sadri, S., Rabbani, H., and Parhi, K. K. (2017). Fully
automated segmentation of fluid/cyst regions in opti-
cal coherence tomography images with diabetic mac-
ular edema using neutrosophic sets and graph algo-
rithms. IEEE Transactions on Biomedical Engineer-
ing, 65(5):989–1001.
Ronneberger, O., Fischer, P., and Brox, T. (2015). U-net:
Convolutional networks for biomedical image seg-
mentation. In International Conference on Medical
image computing and computer-assisted intervention,
pages 234–241. Springer.
Roy, A. G., Conjeti, S., Karri, S. P. K., Sheet, D., Katouzian,
A., Wachinger, C., and Navab, N. (2017). Relaynet:
retinal layer and fluid segmentation of macular optical
coherence tomography using fully convolutional net-
works. Biomedical optics express, 8(8):3627–3642.
Salazar-Gonzalez, A., Kaba, D., Li, Y., and Liu, X. (2014).
Segmentation of the blood vessels and optic disk in
retinal images. IEEE journal of biomedical and health
informatics, 18(6):1874–1886.
Salazar-Gonzalez, A., Li, Y., and Kaba, D. (2012). MRF
reconstruction of retinal images for the optic disc seg-
mentation. In International Conference on Health In-
formation Science, pages 88–99.
Salazar-Gonzalez, A. G., Li, Y., and Liu, X. (2010). Retinal
blood vessel segmentation via graph cut. In Interna-
tional Conference on Control Automation Robotics &
Vision, pages 225–230.
Salazar-Gonzalez, A. G., Li, Y., and Liu, X. (2011). Op-
tic disc segmentation by incorporating blood vessel
compensation. In IEEE Third International Workshop
On Computational Intelligence In Medical Imaging,
pages 1–8.
Schlegl, T., Waldstein, S. M., Vogl, W.-D., Schmidt-Erfurth,
U., and Langs, G. (2015). Predicting semantic de-
scriptions from medical images with convolutional
neural networks. In International Conference on In-
formation Processing in Medical Imaging, pages 437–
448. Springer.
Shienbaum, G., Garcia Filho, C. A. A., Flynn Jr, H. W.,
Nunes, R. P., Smiddy, W. E., and Rosenfeld, P. J.
(2013). Management of submacular hemorrhage sec-
ondary to neovascular age-related macular degen-
eration with anti–vascular endothelial growth factor
monotherapy. American journal of ophthalmology,
155(6):1009–1013.
Venhuizen, F. G., van Ginneken, B., Liefers, B., van As-
ten, F., Schreur, V., Fauser, S., Hoyng, C., Theelen,
T., and S
´
anchez, C. I. (2018). Deep learning approach
for the detection and quantification of intraretinal cys-
toid fluid in multivendor optical coherence tomogra-
phy. Biomedical optics express, 9(4):1545–1569.
Wang, C., Wang, Y., and Li, Y. (2017). Automatic choroidal
layer segmentation using markov random field and
level set method. IEEE journal of biomedical and
health informatics.
Wang, J., Zhang, M., Pechauer, A. D., Liu, L., Hwang,
T. S., Wilson, D. J., Li, D., and Jia, Y. (2016). Au-
tomated volumetric segmentation of retinal fluid on
optical coherence tomography. Biomedical optics ex-
press, 7(4):1577–1589.
Zeiler, M. D. (2012). Adadelta: an adaptive learning rate
method. arXiv preprint arXiv:1212.5701.
Retinal Image Segmentation with Small Datasets
137
