
A Stochastic Game Model for Cloud Platform Security
Lu Li
1a
, Lisheng Huang
1b,
*, Guanling Zhao
1c
, Kai Shi
2
and Fengjun Zhang
2
1
University of Electronic Science and Technology of China, Chengdu, China
2
The 30th Research Institute of China Electronics Technology Group Corporation, Chengdu, China
1250535163@qq.com, fjzhang2020@163.com
Keywords: Cloud Platform, Stochastic Game Model, Stochastic Petri Nets, Markov Chains.
Abstract: The extensive use of virtualization technologies in cloud platforms has caused traditional security measures
to partially fail. It was a hard struggle for static protection mechanisms to get work done in time when facing
constantly evolving network threats. In this paper, an active defense approach is proposed to address the
dynamic and variable security threats in cloud environment. Stochastic game model is introduced to model
the cloud platform security elements. An attack-defense payoff function and matrix are also defined based on
the features of the cloud platform. To accurately describe the attack action and the corresponding defense
action, the overall attack graph and single-point defense graph are optimized. Based on proposed game model
and attack-defense graph, the optimal defense strategy algorithm for the cloud platform is designed. The
optimal defense strategy is obtained after a multi-stage stochastic game considering the long-term gain.
Finally, the model's reliability is evaluated using stochastic Petri nets and Markov chains. Experimental
simulation demonstrates that the presented model outperforms the existing mainstream game models, such as
the evolutionary game model and Bayesian game model, in terms of the optimal strategy, defense success
rate, and steady-state availability.
1 INTRODUCTION
While cloud platforms bring various beneficial
services, they also increase more security threats and
challenges (Almorsy et al., 2016). On one hand, the
complexity of resources allocated in cloud platforms,
such as data, compute, services, and tenants, leads to
an expanded attack surface. Because the cloud
platform stores more data, the risks associated with
data leakage will be more severe. Easy key or
certificate systems, weak passwords, and simple
authentication methods are the main sources of
attacks. A multi-tenant computing architecture is
introduced by the cloud platform, allowing many
tenants to share memories, databases, and other
nearby resources. As a result, more users are affected
at once by known system flaws and software security
problems, increasing the cloud platform's attack
surface. On the other hand, cloud platforms have
more serious security issues than traditional networks
a
https://orcid.org/0000-0002-9606-4206
b
https://orcid.org/0000-0003-3652-3279
c
https://orcid.org/0000-0001-9438-7514
because they comprise virtual machines, cloud
resources, cloud management systems, etc. (Sabahi,
2011). After attacking the cloud platform's virtual
machines and other resources, they can access the
relevant servers. If the cloud platform's
administration system is breached, the attacker can
also get access to a lot of important data, including
user names and passwords, information about virtual
machines and servers, etc. In order to reduce data loss,
user privacy leakage, cloud service paralysis and
other problems, it is necessary to study the cyber
security of cloud platforms and prevent it in time.
Traditional attack-defense techniques must be paired
with active attack-defense measures in order to
effectively defend against the growing network
threats. At the same time, game theory is the key
technology in active attack-defense, where players
make decisions that are best for themselves under the
influence of each other. In network security, game
theory has been applied to capture the essence of
network conflicts, attackers and defenders be
152
Li, L., Huang, L., Zhao, G., Shi, K. and Zhang, F.
A Stochastic Game Model for Cloud Platform Security.
DOI: 10.5220/0011778900003405
In Proceedings of the 9th International Conference on Information Systems Security and Privacy (ICISSP 2023), pages 152-162
ISBN: 978-989-758-624-8; ISSN: 2184-4356
Copyright
c
2023 by SCITEPRESS – Science and Technology Publications, Lda. Under CC license (CC BY-NC-ND 4.0)

modeled as competitors in the game model, the
attacker’s decision strategy is closely related to the
defender’s, and vice versa (Liang & Xiao, 2013).
The popular active attack-defense game models
include Stackelberg game, evolutionary game,
Bayesian game, signaling game, and stochastic game.
These game models have been used in network
security modeling by numerous domestic and
international academics. (Jiang et al., 2019)
constructs an attack-defense game based on the
Stackelberg game to model the interaction between
the attacker and the defender. (Abdalzaher et al.,
2016) devises two protection schemes based on the
Stackelberg game model to protect the nodes of WSN.
However, the Stackelberg game has an action
sequential order for both attackers and defenders,
which has limitations for practical scenarios. In a
evolutionary game, players’ actions and strategies are
modified and improved through continuous imitation
and learning (Sotomayor et al., 2020). the authors
constructed a network attack-defense multi-stage
game model based on bounded rationality constraints
(Huang et al., 2017). A security method for
generating attack and defense graphs is applied to
Vehicular Ad Hoc Network in (Zhang et al., 2019),
which is based on evolutionary game theory and
offensive and defensive interaction models. However,
the design of dynamic replication equations for
evolutionary games and the process through which
they attain a stable state are more challenging. a
detection means of wireless ad hoc network based on
the Bayesian game model is presented to analyze the
interactions between pairs of attacking/defending
nodes (Islam et al., 2021). (Liu et al., 2021) studies
the quantitative and automatic modeling and analysis
of cyber-physical attacks on ICS key information
systems and physical equipment. (Lalropuia & Gupta,
2020) constructs a Bayesian game model to capture
the interaction between attackers and defenders under
bandwidth spoofing attacks. While Bayesian games
are based on games with imperfect information, their
predictions are inaccurate. Taking into account the
dynamic confrontation of spear phishing attacks in
ICS and the cost of defense strategy deployment, a
multi-stage spear-phishing attack-defense signal
game model is constructed (Chen et al., 2019). A
method of active defense strategy selection based on
a two-way signal game is designed in (Liu et al.,
2019). However, the signal game not only suffers
from the issue of the attackers' and defenders' action
sequential, but also plays with inadequate information.
The stochastic game is a combination of game
theory and Markov decision, which mainly applies to
the defense with bounded rational constraints and the
active attack-defense of cloud computing networks
(van Ravenzwaaij et al., 2018). The virtual machine
migration technology and the optimal strategy of
honeypot deployment are well applied to improve the
security of the cloud computing network. The attack
path is also predicted qualitatively and quantitatively
using the stochastic game, the invasion of a black box,
and the attack-defense map (Kandoussi et al., 2020).
However, the current model adopts staged game
methods, which provide limited guidance for the
continuous real-time selection of a network defense
strategy (Chen et al., 2019). (Elmir et al., 2022) studies
the interaction between service providers and attackers
using a stochastic game model and optimizes cloud
computing security. However, the game model does
not take into account potential long-term benefits. The
SBS structure and offensive and defensive actions are
modeled as a two-player stochastic game model (Fanti
et al., 2016), and the optimal strategy is obtained by
calculating the Nash equilibrium. However, both attack
chains and attack trees have to be remodeled if the
architecture of the system is modified (Jakóbik, 2020).
Aiming at the issues with the aforementioned
model, a new stochastic game model for the cloud
platform is proposed, which takes into account the
long-term interests and determines the current
optimal attack-defense strategy after a multi-stage
stochastic game. The overall attack graph and single-
point defense graph of the cloud platform are also
optimally designed to accurately describe the system
attack-defense information. In addition to this, we use
stochastic Petri nets and Markov chains for reliability
modeling and compare the loss rate of the system
under different policies. Experimental simulations
demonstrate that the presented model can raise
system reliability.
The rest of the paper is organized as follows.
Section 2 describes the definitions related to the
proposed game model, discusses the attack-defense
graphs, the attack-defense payoff matrix and the
optimal strategy algorithm design, and analyzes them
with instances. Section 3 presents experimental
simulations and a reliability study of this model based
on real environment data, and compares it to popular
gaming models. Section 4 discusses the conclusion
and future works.
2 STOCHASTIC GAME MODEL
FOR CLOUD PLATFORM
A new game model is proposed based on the
stochastic game. In this model, the offense-defense
A Stochastic Game Model for Cloud Platform Security
153

payoff function, the offense-defense payoff matrix,
and the offense-defense graph model are redesigned.
In addition, stochastic Petri nets and Markov chains
are used to model and analyze the reliability.
2.1 Definition of Game Model
The stochastic game model for cloud platform
(CSGM) is represented by a 6-tuple CSGM =
(N,S,A,D,U,𝛿), which is described below.
(1) N = {N
A
, N
D
} represents the set of game
players, where N
A
represents the network attacker,
and N
D
represents the defense system for cloud
platform.
(2) S={S
0
, S
1
, ... , S
n
} represents the state set of
CSGM. S indicates that the offensive and defensive
confrontation is at different stages, where attacker
gains different privileges and the defending system
loses differently.
(3) A = {a
1
, a
2
, ... , a
n
} represents the set of
attacker actions. The set of attacker’s actions under
state S
k,
A
k
= {a
1
, a
2
, ... , a
k
} and A
k
⸦ A.
(4) D = {d
1
, d
2
, ... , d
n
} represents the set of
defender actions. The set of effective defense actions
for the attack action ak, Dk = {d
1
, d
2
, ... ,d
k
} and
D
k
⸦D.
(5) U = (U
1
, U
2
, ..., U
n
) represents the set of payoff
functions for game players. We consider the player's
long-term gain and design the utility function for
attacker and the defender, U = U
now
+ U
exp
, where
U
now
is the current gain and U
exp
is the expected future
gain. The utility function formulas for both sides are
designed as shown in Eq. (1) and (2).
Ua
= (1−𝛽)(
R
+ δ∙
R
) + 𝛽(−C
)
(1)
Ud
= 𝛽
R
+ (1 − β)( 𝛿∙
R
− C
)
(2)
Ua
represents the attacker’s gain for selecting
action a
i
under state S
i
; Ud
represents the defender’s
gain for selecting action a
i
under state S
i
; R
si
is the
current gain under state S
i
and R
sj
is the expected gain
under the next state S
j
; 𝛽 represents the probability of
defense success; 𝛿 represents the discount factor,
which indicates the attack-defense preference of
current and future payoffs; C
ai
and C
di
denote the cost
of attack action a
i
and defense action d
i
, respectively.
2.2 Attack-Defense Diagram Model
The essence of network security is the game between
network attackers and defenders, so network security
modeling should be considered from the perspective
of both attackers and defenders. The attack-defense
diagram comprehensively reflects the essence of
network attack and defense by incorporating network
security information into security analysis and
decision-making, including attack actions, defense
measures, and corresponding cost. It is built from the
perspective of the defender and is often referred to as
a defense diagram.
Considering the characteristics of the cloud
platform such as variable states and various means of
attack and defense, we separately store the attack path
and defense path of the defense diagram.The overall
attack graph and single-point defense graph are
designed to precisely explain the network status,
attack action, and corresponding defense action for
each state. The overall attack graph is shown in
Figure 1, where S
0
~S
k
denote the k game states and
a
1
~a
m
denote the m attack actions. If S
i
can reach S
j
,
there is a matching attack action a
i
, otherwise, there
is none.
a1
a2
am
...
a2
a3
am
...
...
S0
S1 S2 S3
S2 S3 Sk
Figure 1: Overall attack graph.
...
...
...
S0
a1 a2 am
d1 d2 dn
Figure 2: Single-point defense graph.
2.3 Attack-Defense Payoff Matrix
A matrix of attack-defense activities, as shown in Eq.
(3), is a typical attack-defense payoff matrix. Under
the state S
k
, the set of attacker actions is
A=(a
1
,a
2
, ...,a
nk
), and the set of defender actions is
D=(d
1
, d
2
, ..., d
mk
). A complex game matrix G
k
of
order n
k
×m
k
, whose elements represent the direct
gains achieved by the attacker and the defender under
attack-defense strategies (a
i
, d
j
), can be used to
represent the game in state S
k
.
ICISSP 2023 - 9th International Conference on Information Systems Security and Privacy
154
𝑑
𝑑
⋯𝑑
G
k
=
𝑎
𝑎
⋮
𝑎
⎝
⎜
⎛
𝑟
∗
𝑟
∗
⋯𝑟
∗
𝑟
∗
𝑟
∗
⋯𝑟
∗
⋮⋮⋮⋮
𝑟
∗
𝑟
∗
⋯𝑟
∗
⎠
⎟
⎞
(3)
Combined with our game model and algorithm,
the designed attacker gain matrix is shown in Eq. (4).
The matrix tuples represent the gains of the attacker
and the defender when the attack action a
i
is taken in
state S
j
. The calculation method of Ua
is shown in
formula (1), and the calculation method of
Ud
is
shown in formula (2).
𝑎
𝑎
⋯𝑎
G =
𝑆
𝑆
⋮
𝑆
⎝
⎛
Ua
,Ud
Ua
,Ud
⋯Ua
,Ud
Ua
,Ud
Ua
,Ud
⋯Ua
,Ud
⋮⋮⋮⋮
Ua
,Ud
Ua
,Ud
⋯Ua
,Ud
⎠
⎞
(4)
2.4 Algorithm for Optimal Strategy
Selection
Aiming at the fact that the majority of current payoff
computations are based on current payoffs, a multi-
stage gaming algorithm is proposed that takes into
account long-term payoffs. The play the game
multiple times until the end condition is reached, and
then calculates the impact of future gains on the
present. For each state, iterates over all of the attack
actions associated with that state to determine the
long-term benefits under various assault actions.
Simultaneously, the attack success rate and the
defense success rate are computed, so the long-term
process is also considered when computing the
success rate. The flow of the optimal strategy
selection algorithm is shown below.
Input: CSGM = (N,S,A,D,U,δ)
Output: payoff matrix and optimal attack-defense
strategies
Step1:
Input parameters:
S<-(S0,S1,...,Sk)
A<-(a1,a2, ... ,am)
D<-(d1, d2, ... , dn).
1) Input attributes of the parameter S, which contains
the set of available attack action attlist and the system
loss rate.
2) Input attributes for parameter A, which include
benefit, cost, next state, valid set of defenses, and attack
success rate.
3) Input attributes for parameter D, which include
benefit, cost, and defense success rate.
4) Determine the value of discount factor
step2:
For S
i
∈ S and (i=1,2, ... ,k), a
i
∈ S
i
.attlist is
calculated by the Eq. (1) and (2). R
sj
denotes the future
expected gains, which is obtained after a multi-stage
game.
Step3:
When either of the following game-end conditions is
encountered: a. the final state S
k
is visited, b. the current
state has been visited, or c. there is no optional attack
action in the current state, return (Ua
,Ud
)=(0,0) as the
future expected gain R
sj
and bring it into the above
formula for calculation, otherwise, repeat the steps of
step2 and step3.
Step4:
In the above procedure, the attack/defense success
rate is calculated recursively at the same time. Attack
success rate equals iteration of defense failure
probability, defensive success rate equals iterative
defensive success rate
Step5:
Obtain the payoff matrix and the attack/defense
success rate matrix, based on these matrices, produce the
optimal attack-defense strategies.
End
2.5 Instance and Analysis
2.5.1 Experimental Environment of the
Instance
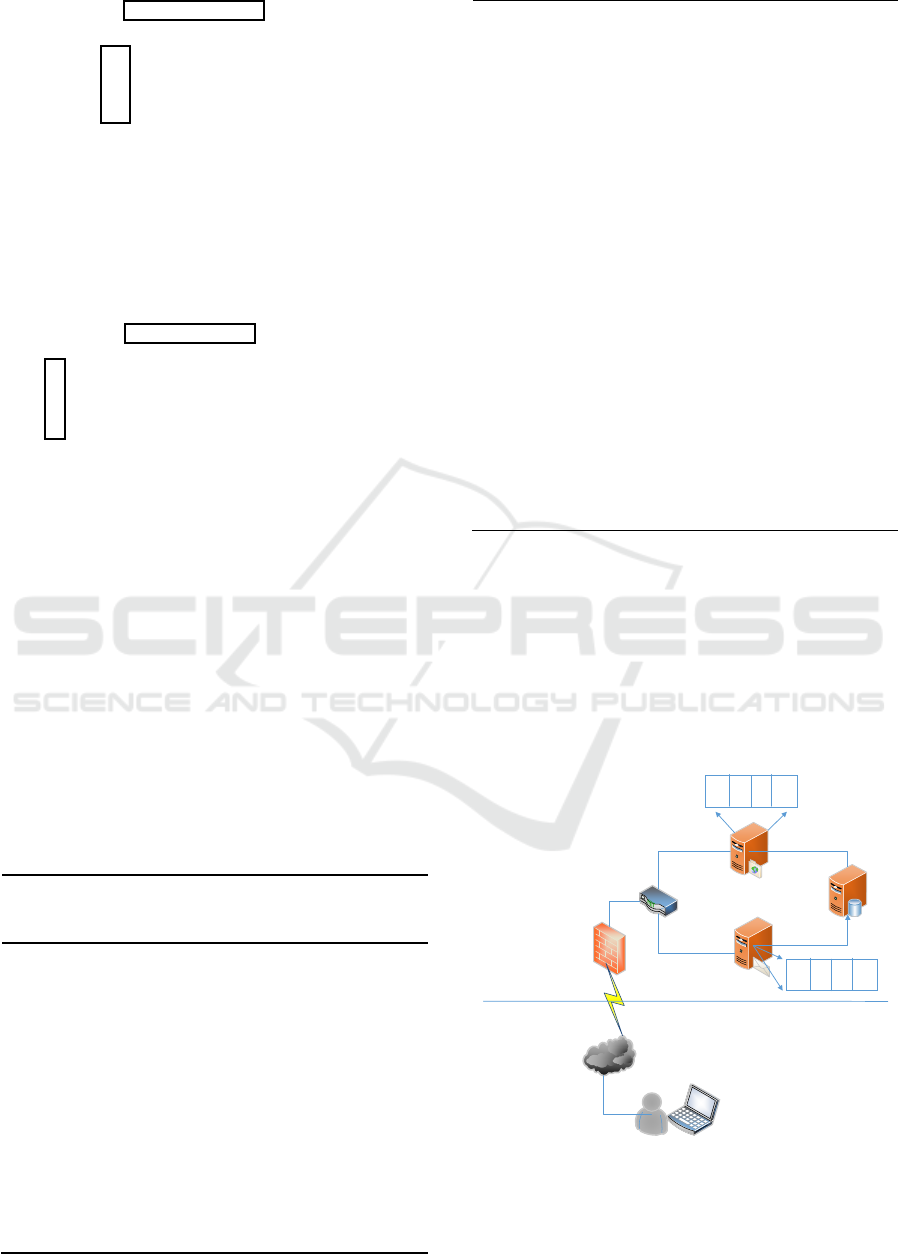
To further clarify the game model and optimal
strategy algorithm described in the preceding section,
we describe a common cloud network topology
example, as shown in Figure 3.
FTP Server
SMTP Server
Database
Server
Firewall
Extranet
Cloud platform
environment
Router
Attacker
VM
VM
ę
VM
VM
VM
ę
VM
Figure 3: Network topology graph.
In this instance, the cloud platform consists of
three servers: a FTP server, a SMTP server, and a
A Stochastic Game Model for Cloud Platform Security
155
database server. Using virtualization technology,
each server is partitioned into many virtual machines.
FTP server and SMTP server are servers that users
can rent and utilize. The database server manages the
FTP server and SMTP server, which is inaccessible
to common users. An attacker in the extranet, who
initially has no access to servers, can launch attacks
on the above cloud platform.
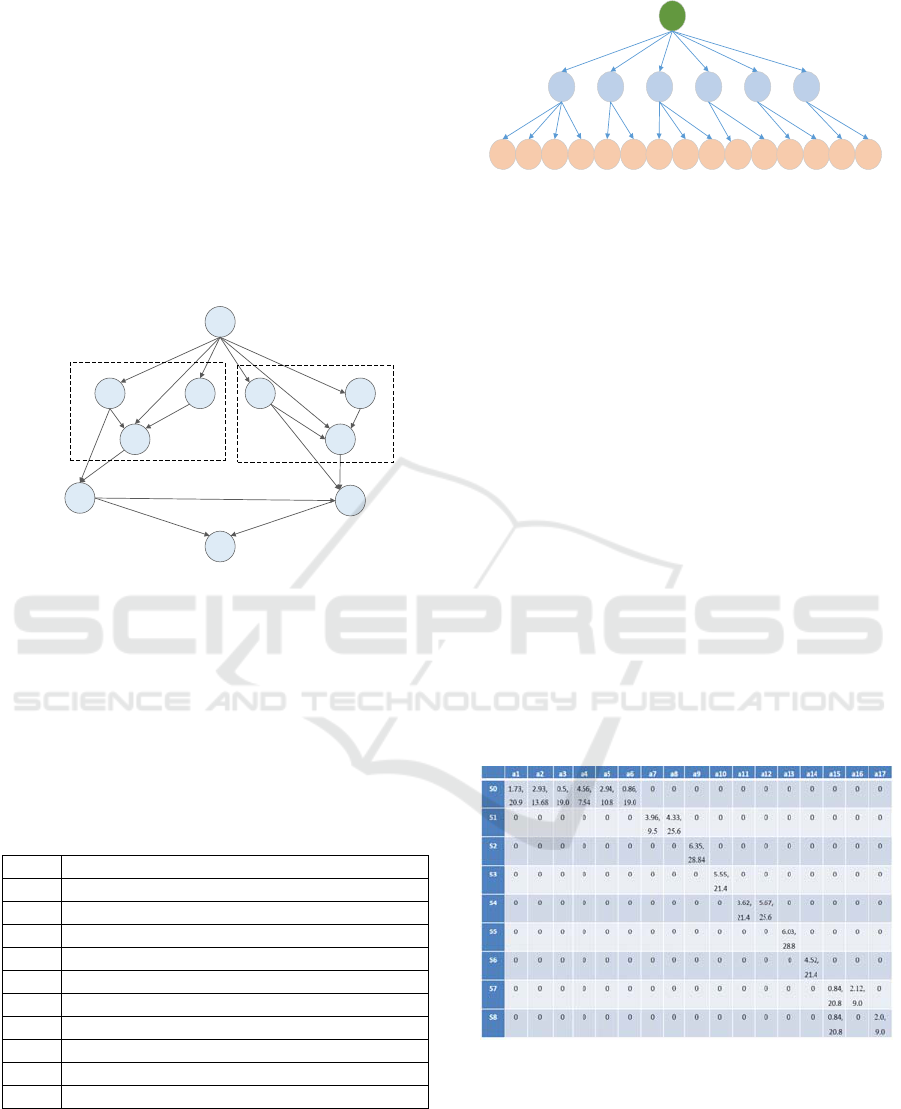
2.5.2 Attack-Defense Diagram of Instance
The overall attack graph of the cloud platform is shown
in Figure 4, including 9 states and 17 attack actions.
S0
S1
S2
S3
S7
S9
S4 S5
S6
S8
a1
a3
a2 a4
a6
a5
a7
a9
a11
a12
a13
a8
a10
a14
a15 a17
SMTP VM FTP VM
SMTP Server
FTP Server
Data Server
a16
a15
Figure 4: Overall attack graph of Instance.
The definitions of each state are shown in Table 1.
For the state S
0
, the attacker can take the attack action
when he has not obtained any authority A
0
=
{a
1
,a
2
,a
3
,a
4
,a
5
,a
6
}. Similarly, the set of attack actions
in other states can be obtained, A
1
= {a
7
, a
8
}, A
2
=
{a
9
}, A
3
= {a
10
}, A
4
= {a
11
, a
12
}, A
5
= {a
13
}, A
6
= {a
14
},
A
7
= {a
15
, a
16
}, A
8
= {a
17
}.
Table 1: This caption has one line so it is centered.
State Definition
S0 Normal State
S1 Gain SMTP VM user privileges
S2 Gain SMTP VM memory privileges
S3 Gain SMTP virtual machine Root privileges
S4 Obtain virtual machine user access to FTP
S5 Obtain virtual machine memory access to FTP
S6 Obtain virtual machine Root access to FTP
S7 Gain host Root privileges of SMTP
S8 Gain host Root privileges of FTP
S9 Obtain database server Root privileges
Each state is owned with a unique single-point
defense graph. As shown in Figure 5, the single-point
defense graph for state S
0
is utilized as an illustration.
There are six optional attack actions in state S
0
, where
a
1
corresponds to the effective defense action D
1
= {d
1
,
d
2
, d
3
, d
15
}.
S0
a1 a2 a3 a4 a5 a6
d1 d2 d3 d15 d4 d5 d3 d6 d15 d7 d8 d1 d5 d9 d15
Figure 5: Single-point defense graph of S
0
.
2.5.3 Optimal Strategy Algorithm of
Instance
In this instance, the inputs to the optimal strategy
algorithm are S = {S
0
, S
1
, S
2
, ... , S
9
}, A = {a
1
, a
2
, a
3
,
... ,a
17
}, D = {d
1
, d
2
, d
3
, ... ,d
15
}. For parameter S, the
set of attack actions in each state is A
0
=
{a
1
,a
2
,a
3
,a
4
,a
5
,a
6
}, ..., A
8
= {a
17
}; for the parameter A,
we take a1 and a
17
as examples, a
1
= {benefit, cost,
next state, valid set of defenses, attack success rate}
= {10.0, S1, (d
1
, d
2
, d
3
, d
15
) , 0.6}, a
17
= {7.5, S
9
, (d
14
,
d
16
), 0.4}, where benefit, next state, and probability
of defense success can all be calculated based on the
CVSS security vulnerability assessment system; for
parameter D, we take d
1
and d
15
as examples, d
1
=
{benefit, cost, defense success rate} = {50, 20, 0.5}
and d
17
= {10, 5, 0.5}, where the benefit is determined
by the amount of attack activities that can be
successfully defended, the cost is related to the
complexity of defense, and the defense success rate =
1 - attack success rate.
Table 2: State/attack-defense payoff matrix of instance.
The optimal strategy algorithm is implemented
using Python language. The state/attack-defense
payoff matrix are obtained as shown in Table 2. The
corresponding attack success rate and defense success
rate for each state are obtained as P
a
= {0.06, 0.36,
0.14, 0.24, 0.36, 0.14, 0.24, 0.4, 0.4, 0} and P
b
= {0.03,
0.14, 0.09, 0.14, 0.14, 0.09, 0.14, 0.24, 0.24, 0.24, 0},
respectively. Based on this matrix and the attack-
defense success rates, the optimal attack- defense
ICISSP 2023 - 9th International Conference on Information Systems Security and Privacy
156
strategy for each state are obtained as A
opt
= {'a
4
', 'a
8
',
'a
9
', 'a
10
', 'a
12
', 'a
13
', 'a
14
', 'a
16
', 'a
17
', 'a
1
'} and D
opt
= {'d
8
',
'd
2
', 'd
2
', 'd
2
', 'd
2
', 'd
2
' , 'd
2
', 'd
14
', 'd
14
', 'd
15
'}.
2.5.4 Reliability Analysis
Combined models such as reliability block diagrams,
fault trees, and s-t connectivity networks are
commonly used for system reliability and availability
analysis. These models can offer a succinct
description and an effective evaluation for the system
under study, but they are unable to capture the
dependencies that exist in real systems (Sahner &
Trivedi, 1987) (Veeraraghavan & Trivedi, 1988),
such as non-zero detection/reconstruction times,
incomplete coverage, correlated failures, repair
dependencies, and performance reliability
dependencies. On the other hand, state-space-based
models, such as Markov model, are able to capture
various dependencies that appear in reliability/
availability models (Dugan et al., 1986) (Goyal et al.,
1986). In this paper, stochastic Petri nets (SPN) and
Markov model are used to model and analyze the
system's reliability.
P0
p1 p2
p3 p4
p5 p6
p7
Get user priviliges of
virtual machine
Get root priviliges of
virtual machine
Get root priviliges
of host
Get database
server priviliges
Figure 6: SPN model of instance.
M0
M1
M2
M7
M3
M4
M5
M6
β5
λ5
β7
λ7
β4
λ6
β8
λ8
λ3
β3
λ4
β6
β9 λ9
Figure 7: Markov chain model of instance.
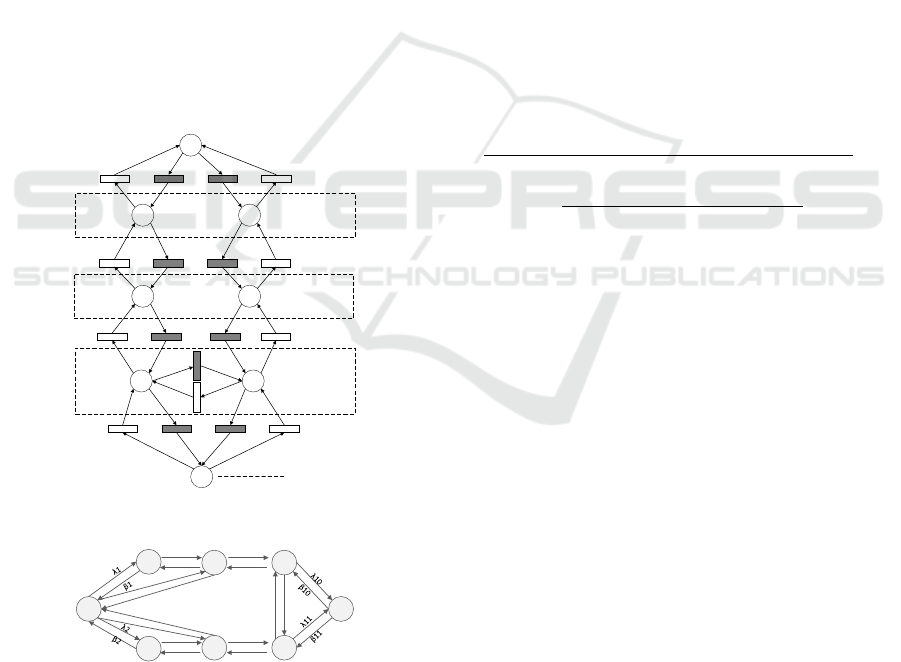
The SPN model of the instance is shown in Figure
6, where the black rectangular nodes indicate the
attack action, the white rectangular nodes indicate the
defense action, and the circular nodes indicate the
system states in which the attacker has different
system privileges.
The Markov chain model corresponding to the
SPN is shown in Figure 7, where M
k
related to the
different states of the system, and λ
i
and β
j
represent
the transfer probability between different states. λ
i
and β
j
correspond to the attack and defense success
rate respectively.
We set the following assumptions:
state M
1
can be transfered from state M
0
by
various attack actions as A
1
{a
1
,a
2
,...,a
n
}.
the set of defensive actions corresponding to
the attack action ai is Di{d
1
,d
2
,...,d
n
}.
the optimal defense action for ai is d
opti
, and its
defense success rate is P
dopti
.
The steady-state probability of M
0
-M
7
is SSP =
{m
0
,m
1
,.... .m
7
}
The system loss rate of M
0
-M
7
is Loss = {0, 0.2,
0.2, 0.25, 0.25, 0.3, 0.3, 0.4}
Based on the above assumptions, λ
i
and β
j
are
calculated as shown in Eq. (5) and (6). In addition, the
reliability of the system is calculated as shown in
Eq. (7)
𝜆𝑖=
1 − 𝑃
+1−𝑃
+⋯+1−𝑃
𝑛
(5)
𝛽𝑗=
(𝑃
+𝑃
+⋯+𝑃
)
𝑛
(6)
Ra = 1-(m
0
*0)-(m
1
+m
2
)*0.2)-((m
3
+m
4
)*0.25)-
(
m
5
+m
6
)
*0.3-
(
m
7
*0.4
)
(7)
3 EXPERIMENT SIMULATION
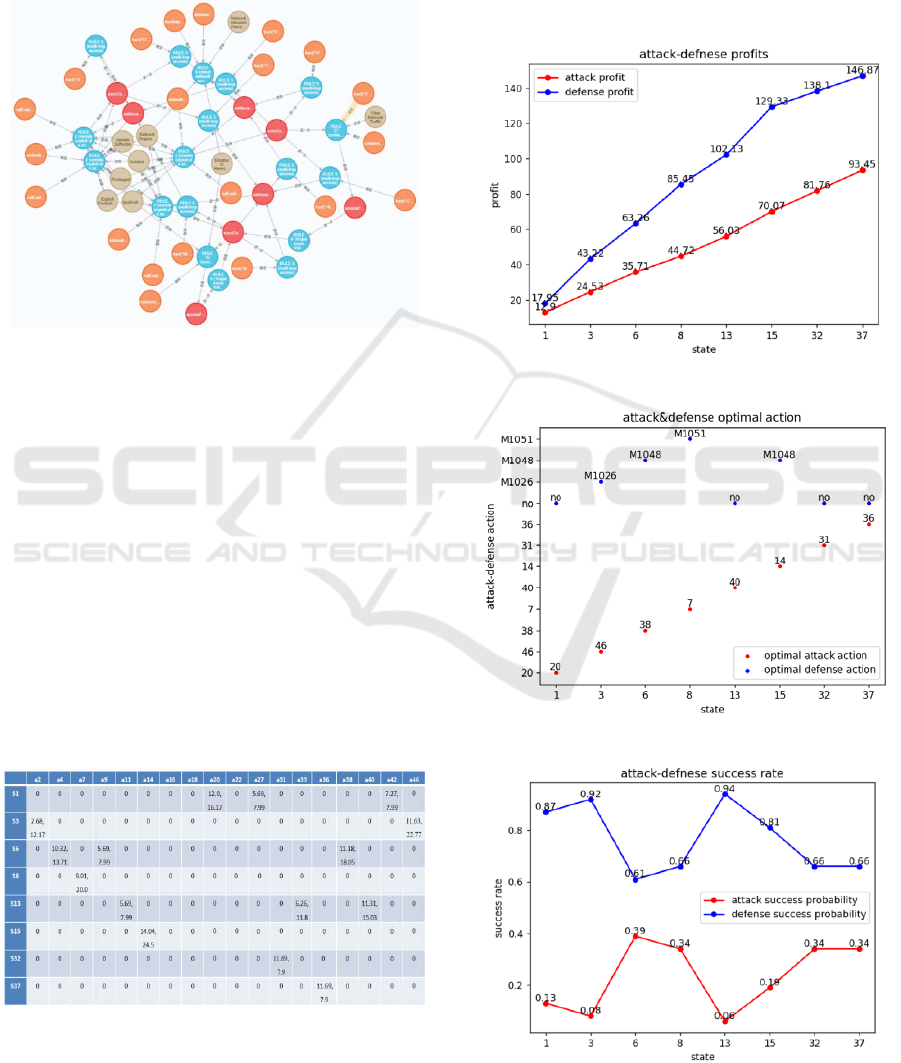
3.1 Experiment Data
The experimental data of a cloud platform is collected
and stored using neo4j as shown in Figure 8. The
orange node represents the attack condition, which
must exist before the attack action can be carried out.
The blue node represents the attack action, which the
attacker carries out in order to reach a specific attack
state. The red node denotes the system state, where
the attacker's authority varies. The gray node denotes
the defense action, where there may be numerous
defense actions for one attack action or a single
defense action may apply to multiple attack actions.
The relationships include trigger, gain, further,
and defense. The relationship between orange nodes
and blue nodes is trigger, which indicates that if
specific attack conditions are met, a particular attack
action can be triggered. The gain connect blue nodes
and red nodes, that is, after an attack action is
A Stochastic Game Model for Cloud Platform Security
157
launched, another state can be reached. Red nodes
and blue nodes have a further relationship, which
means that the attacker can initiate further attacks in
a certain state. Defense is the interaction between gray
nodes and blue nodes, and it is a strong defensive
response to an attack.
Figure 8: Attack-defense graph of Experiment.
3.2 Optimal Strategy Algorithm of
Experiment
We gather the necessary data from the above
experimental environment, including the information
of state, attack action, and defense action. We can get
the following values from the Neo4j database for the
attributes of state and attack action: S
k
= {status_id,
attack_list}; a
k
= {attack_id, 0, attack_reward,
attack_cost, defense_list, attack_prob}. For the
attributes of defense action, we set d
k
= {defense_id,
0.44, 33.5, 1.2}. The gathered information is inputted
into the optimal strategy algorithm and the attack-
defense payoff matrix is obtained as shown in Table 3.
Table 3: State/attack-defense payoff matrix of experiment.
Based on the payoff matrix, the attack/defense
profit sum is calculated as shown in Figure 9. The
horizontal coordinate represents the eight system
states of the cloud platform with unique number, and
the vertical coordinate indicates the profits. The
optimal attack/defense strategy for each state is also
obtained, as shown in Figure 10. The meanings of the
horizontal coordinates are consistent with Figure 9,
and the red dots and blue dots indicate the optimal
strategies of attackers and defenders in a certain state,
respectively. In addition to this, the attack/defense
success rate is obtained as shown in Figure 11.
Figure 9: Attack and defense profit sum.
Figure 10: Attack and defense optimal strategy.
Figure 11: Attack and defense success rate.
ICISSP 2023 - 9th International Conference on Information Systems Security and Privacy
158
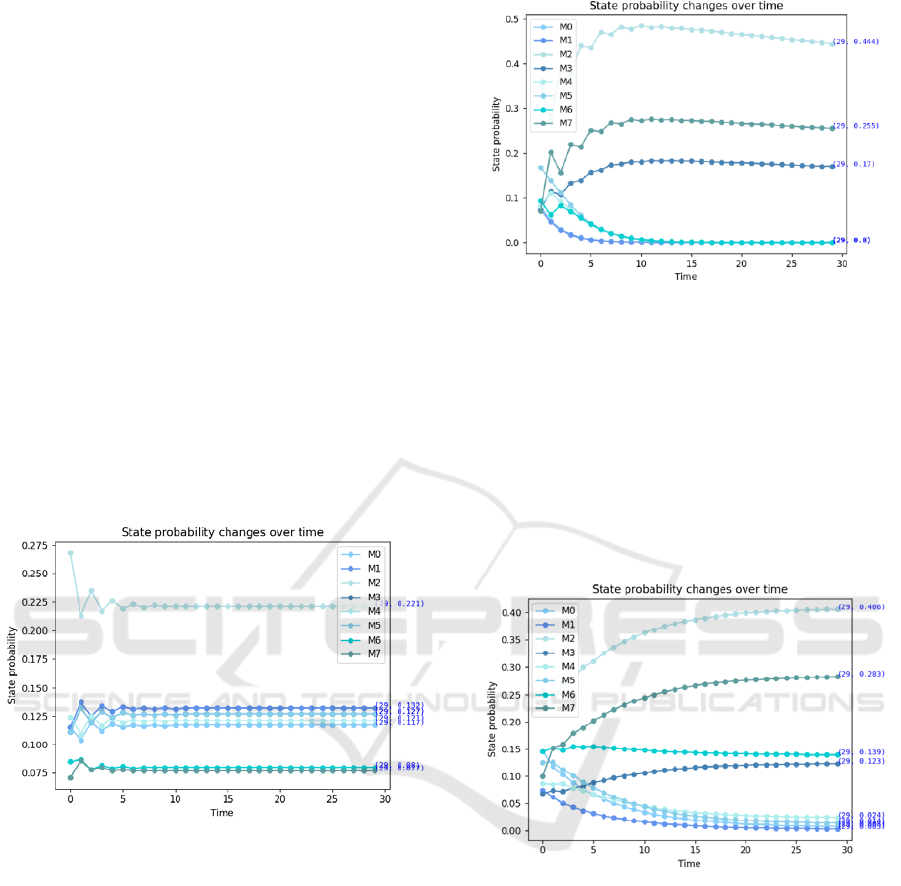
3.3 Reliability Simulation
To verify the validity of the presented model in this
paper, reliability simulations are conducted in four
cases based on above experiment environment.
Simulations verify that the system loss rate is lower
and the reliability is higher under the proposed model.
We assume that the initial state vector is P
0
= ( P
M0
,
P
M1
, P
M2
, P
M3
, P
M4
, P
M5
, P
M6
, P
M7
) = ( 0.5, 0.15, 0.15,
0.08, 0.08, 0.02, 0.02, 0 ). Also assume that: state loss
rate = attack profits in the state / total attack profits,
Loss = {0.16, 0.05, 0.24, 0.05, 0.27, 0.05, 0.09, 0.09}.
In the first scenario: all defensive actions are
deployed, and the attacker chooses the attack action
averagely. The transfer probability between states is
equal to the average success rate of the optional attack
actions. Using Python to walk through the Markov
transfer process, the final steady-state probabilities
are obtained as shown in Figure 12, P
m
= ( m
0
, m
1
, m
2
,
m
3
, m
4
, m
5
, m
6
, m
7
) = ( 0.117, 0.132, 0.221, 0.127,
0.121, 0.127, 0.08, 0.077). Calculate the system's
reliability based on Eq. (6): Ra = 86.2%.
Figure 12: State transfer probability for first case.
In the second scenario: the defender deploys the
optimal defense strategy according to the game model,
while the attacker merely takes into account the short-
term profit and selects the most profitable attack
action. If the defense action is effective against the
attack action, the state transfer probability is the
attack success rate, otherwise, the state transfer
probability is 1. All other calculations are left
unaltered, and the state transfer probabilities are
obtained as shown in Figure 13. The final steady-state
probabilities are P
m
= ( m
0
, m
1
, m
2
, m
3
, m
4
, m
5
, m
6
,
m
7
) = (0.0, 0.0, 0.444, 0.17, 0.0, 0.0, 0.0, 0.255).
Calculate the system's reliability based on Eq. (6): Ra
= 84.1%.
Figure 13: State transfer probability for second case.
In the third scenario: The attacker still takes into
account the short-term profit and selects the most
profitable attack action, while the defender do not
deploy any defense strategy. Without modifying any
other calculations, the probability of transition
between states is derived as depicted in Figure 14.
The final steady-state probabilities are P
m
= ( m
0
, m
1
,
m
2
, m
3
, m
4
, m
5
, m
6
, m
7
) = (0.008, 0.003, 0.406, 0.123,
0.024, 0.014, 0.139, 0.283). Calculate the system's
reliability based on Eq. (6): Ra = 84.1%.
Figure 14: State transfer probability for third case.
In the fourth scenario: Based on the proposed
game model, the defender deploys the optimal
defense strategy in advance and the attacker launch
the action according to long-term gain. The
calculation is the same as in the previous scenarios.
The state transfer probabilities are as shown in Figure
15. The final steady-state probabilities are P
m
= ( m
0
,
m
1
, m
2
, m
3
, m
4
, m
5
, m
6
, m
7
) = (0.099, 0.151, 0.22,
0.084, 0.099, 0.151, 0.0, 0.126). Calculate the
system's reliability based on Eq. (6): Ra = 87.4%.
A Stochastic Game Model for Cloud Platform Security
159

Figure 15: State transfer probability for fourth case.
Although the first scenario's reliability of 86.2%
is also ideal, it necessitates the deployment of all
defense actions, which will undoubtedly raise the cost
of defense system. The reliability of the second and
third cases are 84.1% and 84.9%, which are
significantly lower than the proposed model in this
paper. In summary, the proposed model improves the
reliability of the system to a certain extent and also
reduces the defense cost.
3.4 Experimental Comparison
3.4.1 Optimal Strategy Comparison
In the existing game models, the optimal strategies
calculated by Nash equilibrium are mostly mixed
strategies that cannot be applied directly to the actual
environment. In contrast, the optimal strategy in this
paper is a pure policy that uses a recursive multi-stage
game to calculate the current gain, which is more
practical and decreases the complexity of
management deployment. Table 4 compares the
mixed strategies from the (Huang et al., 2017) with
the pure strategies from the CSGM in this paper.
Table 4: Optimal strategy comparison.
Game model of (Huang
et al., 2017)
CSGM
Attack
strategy
Defense
strategy
Attack
strategy
Defense
strategy
S0-
>S1
{0.45,0.4,
0.15}
{0.5,
0.5}
a20 no
S1-
>S2
{0.3,
0.7,0}
{1,0,0} a46 M1026
S2-
>S3
{0.47,
0.23,0.3}
{045,0.5,
0.05}
a38 M1048
… … … … …
Table 5: Defense success rate and profits comparison.
Highest
defense
success
rate
lowest
defense
success
rate
Average
defense
success
rate
Average
defense
profits
SAR-
RG
0.95 0.75 0.8 89.5
GFQL 0.75 0.6 0.7 87.5
IS-
RS/PS
0.55 0.65 0.6 72.5
CSGM 0.94 0.61 0.76 90.6
3.4.2 Defense Success Rate and Profits
Comparison
Comparing the average gain, defense success rate,
and detection accuracy of the three game models in
the (Balaji et al., 2019), the superiority of the SAR-
RG model is highlighted. As indicated in Table 9, we
compare the defense success rate and average profits
of these three models to CSGM in this paper. In terms
of defense success rate, The CSGM is demonstrably
superior to the GFQL and IS-RS/PS models, and is
comparable to the SAR-RG model. Moreover, this
model has a greater average defense profits than the
other three models.
3.4.3 Steady-State Probability Comparison
(Lalropuia & Gupta, 2020) analyzes the impact of
DoS attacks on the system availability using
stochastic reward network. The SSP variation of their
simulations is shown as Table 6, with an average SSP
of 0.85. The SSP obtained using CSGM for defense
deployment is 0.874. The stability of the proposed
model in this paper is superior to the presented model
in the (Lalropuia & Gupta, 2020).
Table 6: Steady-state probability comparison.
State SSP(simul
ation)
Average
SSP
Game model in
(Lalropuia &
Gupta, 2020)
ω=0.1 0.81
0.855
ω=0.2 0.82
… …
ω=0.9 0.89
CSGM Case 4
0.874 0.874
4 CONCLUSIONS
In order to satisfy the requirement for network
security defense of cloud platforms, A new active
defense model for cloud platforms is proposed which
ICISSP 2023 - 9th International Conference on Information Systems Security and Privacy
160

is based on stochastic game theory and merges the
concept of active defense. The model enhances the attack-
defense graph, redefines the reward function and payoff
matrix, and provides the optimal defense strategy
algorithm. This algorithm calculates the attack and defense
payoff matrix by taking into account the long-term interests
and then determines the best defense strategy based on this.
To verify the effectiveness of the model, we simulate the
reliability of four scenarios using stochastic Petri nets and
Markov chains. The results demonstrate that the model
outperforms both the deployment of all defense actions and
the absence of defense actions. Compared with mainstream
models, the proposed model outperforms in terms of
optimal strategy form, defense success rate and gain, and
system stability probability. The model's backtracking
algorithm complexity is too high, making it more taxing for
larger cloud platform systems. In the future, we will
continue to optimize the algorithm's time complexity.
REFERENCES
Abdalzaher, M. S., Seddik, K., Muta, O., & Abdelrahman,
A. (2016). Using Stackelberg game to enhance node
protection in WSNs. 853–856. https://doi.org/10.1109/
CCNC.2016.7444900
Almorsy, M., Grundy, J., & Müller, I. (2016). An Analysis
of the Cloud Computing Security Problem.
https://arxiv.org/abs/1609.01107
Balaji, S., Julie, E. G., Robinson, Y. H., Kumar, R., Thong,
P. H., & Son, L. H. (2019). Design of a security-aware
routing scheme in Mobile Ad-hoc Network using
repeated game model. Computer Standards and
Interfaces, 66, 103358-. https://doi.org/10.1016/j.csi.
2019.103358
Chen, X., Liu, X., Zhang, L., & Tang, C. (2019). Optimal
Defense Strategy Selection for Spear-Phishing Attack
Based on a Multistage Signaling Game. IEEE Access,
7, 19907–19921. https://doi.org/10.1109/ACCESS.2019.
2897724
Dugan, J. B., Trivedi, K. S., Smotherman, M. K., & Geist,
R. M. (1986). The hybrid automated reliability
predictor. Journal of Guidance, Control, and Dynamics,
9(3), 319–331. https://doi.org/10.2514/3.20109
Elmir, I., El mehdi, K., Mohamed, H., Abdelkrim, H., &
Kim, D. seong. (2022). A Game Theoretic approach
based virtual machine migration for cloud environment
security. International Journal of Communication
Networks and Information Security (IJCNIS), 9(3).
https://doi.org/10.17762/ijcnis.v9i3.2579
Fanti, M. P., Nolich, M., Simic, S., & Ukovich, W. (2016).
Modeling cyber attacks by stochastic games and Timed
Petri Nets. 002960–002965. https://doi.org/10.1109/
SMC.2016.7844690
Goyal, A., Carter, W. C., Silva, E., Lavenberg, S. S., &
Trivedi, K. H. (1986). The System Availability
Estimator. 6th Annual International Symposium on
Fault-Tolerant Computing Systems. http://www.
researchgate.net/publication/236231098_The_System_
Availability_Estimator
Huang, J., Zhang, H., & Wang, J. (2017). Markov
Evolutionary Games for Network Defense Strategy
Selection. IEEE Access, 5, 19505–19516.
https://doi.org/10.1109/ACCESS.2017.2753278
Islam, M. N. U., Fahmin, A., Hossain, M. S., &
Atiquzzaman, M. (2021). Denial-of-Service Attacks on
Wireless Sensor Network and Defense Techniques.
Wireless Personal Communications, 116(3), 1993–
2021. https://doi.org/10.1007/s11277-020-07776-3
Jakóbik, A. (2020). Stackelberg game modeling of cloud
security defending strategy in the case of information
leaks and corruption. Simulation Modelling Practice
and Theory, 103, 102071-. https://doi.org/10.1016/j.
simpat.2020.102071
Jiang, W., Ma, Z., & Deng, X. (2019). An attack-defense
game based reliability analysis approach for wireless
sensor networks. International Journal of Distributed
Sensor Networks, 15(4), 1550147719841293.
Kandoussi, E. M., Hanini, M., El Mir, I., & Haqiq, A.
(2020). Toward an integrated dynamic defense system
for strategic detecting attacks in cloud networks using
stochastic game. Telecommunication Systems, 73(3),
397–417. https://doi.org/10.1007/s11235-019-00616-1
Lalropuia, K. C., & Gupta, V. (2020). A Bayesian game
model and network availability model for small cells
under denial of service (DoS) attack in 5G wireless
communication network. Wireless Networks, 26(1),
557–572. https://doi.org/10.1007/s11276-019-02163-8
Liang, X., & Xiao, Y. (2013). Game Theory for Network
Security. IEEE Communications Surveys and Tutorials,
15(1), 472–486. https://doi.org/10.1109/SURV.2012.0
62612.00056
Liu, X., Zhang, H., Zhang, Y., Shao, L., & Han, J. (2019).
Active Defense Strategy Selection Method Based on
Two-Way Signaling Game. Security and
Communication Networks, 2019, 1–14. https://doi.org/
10.1155/2019/1362964
Liu, X., Zhang, J., Zhu, P., Tan, Q., & Yin, W. (2021).
Quantitative cyber-physical security analysis
methodology for industrial control systems based on
incomplete information Bayesian game. Computers &
Security, 102, 102138-. https://doi.org/10.1016/j.cose.
2020.102138
Sabahi, F. (2011). Cloud computing security threats and
responses. 245–249. https://doi.org/10.1109/ICCSN.20
11.6014715
Sahner, R. A., & Trivedi, K. S. (1987). Reliability
Modeling Using SHARPE. IEEE Transactions on
Reliability, R-36(2), 186–193. https://doi.org/10.1109/
TR.1987.5222336
Sotomayor, M., Pérez-Castrillo, D., & Castiglione, F.
(2020). Complex social and behavioral systems: Game
theory and agent-based models. Springer Nature.
van Ravenzwaaij, D., Cassey, P., & Brown, S. D. (2018). A
simple introduction to Markov Chain Monte-Carlo
sampling. Psychonomic Bulletin & Review, 25(1),
143–154. https://doi.org/10.3758/s13423-016-1015-8
A Stochastic Game Model for Cloud Platform Security
161

Veeraraghavan, M., & Trivedi, K. (1988). Hierarchical
Modeling for Reliability and Performance Measures. In
S. K. Tewksbury, B. W. Dickinson, & S. C. Schwartz
(Eds.), Concurrent Computations: Algorithms,
Architecture, and Technology (pp. 449–474). Springer
US. https://doi.org/10.1007/978-1-4684-5511-3_23
Zhang, H., Zheng, K., Wang, X., Luo, S., & Wu, B. (2019).
Efficient Strategy Selection for Moving Target Defense
Under Multiple Attacks. IEEE Access, 7, 65982–65995.
https://doi.org/10.1109/ACCESS.2019.2918319
ICISSP 2023 - 9th International Conference on Information Systems Security and Privacy
162
