
Gateway Placement in LoRaWAN Enabled Sensor Networks
Batuhan Can, Halit Uyanık and Tolga Ovatman
Department of Computer Engineering, Istanbul Technical University, Istanbul, Turkey
Keywords:
Gateway Placement, LoRaWAN Networks, Environmental Monitoring.
Abstract:
This paper proposes two different approaches to be applied in gateway placement problem in LoRaWAN sen-
sor networks. The first approach is based on finding the minimal set to contain all the coverage intersections
of the sensors and the second approach is based on optimization via integer programming over the distance
between the gateways and sensors. Our results show that using automated gateway placement provides signif-
icantly less number of gateways to be used.
1 INTRODUCTION
Placing gateways in a sensor network has always been
a challenging problem. There is vast amount of re-
search about this problem and different types of ap-
proaches have been considered to solve it efficiently.
Gateway placement has a critical role in real-world
applications of sensor networks, since it is necessary
for a system to be energy-efficient and to have high
quality data communication. A smart way of placing
gateways can highly affect the total energy consump-
tion of sensors.
In this paper, we propose two different approaches
to solve the problem of gateway placement by group-
ing the sensors in a LoRaWAN enabled sensor net-
work. One of these approaches relies on exploring
the intersection of sensor coverage ranges and plac-
ing gateways on these intersections to cover the most
intersection with the least number of gateways. Other
approach uses mixed-integer programming (MIP) on
an optimization model that try to minimize the num-
ber of gateways that fully cover the provided set of
sensors.
We validate the proposed model not by using
hypothetical sensor locations but by simulating the
model with actual sensor positions obtained from a
real-world case study: Ergene river (which is a major
left tributary of the Maritsa river, flowing entirely in
the East Thrace region of Turkey). All the sensor po-
sitions from the Ergene river has been pre-determined
by a previous project to collect the most information-
rich data about micro-pollutants in the river (see Fig-
ure 2). We run our experiments over two different
simulators: ns-3 (Riley and Henderson, 2010) and Lo-
RaPlan (Loh et al., 2021b). In ns-3, we have used
LoRaWAN module to tune the low level communi-
cation properties between the gateways and the sen-
sors. We collected transmission failure rates over ns-3
simulations. Also by running LoRaPlan simulations,
we obtain RSSI levels throughout the sensor network
and other basic signal properties for certain gateway
placements.
Our results show that using MIP significantly de-
creases the number of gateways that can provide a full
coverage even though it results in a degradation in
communication quality. Both of these differences in-
crease as the coverage of the gateways increase. Our
study provides novel results over a realistic sensor dis-
tribution scenario in a rural environment. Proposed
approaches have been validated by two different sim-
ulation environments ns-3 and LoRaPlan, and the re-
sults of these approaches are compared with manual
placement.
2 RELATED WORK
Even though the underlying concepts such as inter-
net of things (IoT), wireless sensor networks (WSN)
and wireless mesh networks (WMN) may change
through time, optimal gateway placement in wire-
less networks have been taking the attention of many
researchers. Also the problem of coverage and
clustering devices in wireless networks, have been
considered in various studies (Abbasi and Younis,
2007)(Younis and Akkaya, 2008). Gateway place-
ment as a cluster assignment problem can be defined
as the division of nodes in a wireless network into
Can, B., Uyanık, H. and Ovatman, T.
Gateway Placement in LoRaWAN Enabled Sensor Networks.
DOI: 10.5220/0011777000003399
In Proceedings of the 12th International Conference on Sensor Networks (SENSORNETS 2023), pages 93-100
ISBN: 978-989-758-635-4; ISSN: 2184-4380
Copyright
c
2023 by SCITEPRESS – Science and Technology Publications, Lda. Under CC license (CC BY-NC-ND 4.0)
93

clusters and finding the optimal location for the gate-
way in each group, so that the requirements of the net-
work are satisfied by dividing the network into mini-
mum number of clusters.
Various methods can be considered to find a so-
lution to the problem of clustering. An example to
such methods is a hybrid model which is the combi-
nation of three algorithms based on LEACH and K-
Means (Bholowalia and Kumar, 2014). Clustering in
the proposed model is done by K-Means algorithm.
Another study presents an integer linear programming
(ILP) formulation and a polynomial time recursive al-
gorithm (Aoun et al., 2006), aiming to divide a WMN
into minimum of number of clusters.
In gateway placement, it is crucial to satisfy the
quality-of-service (QoS) requirements. These re-
quirements can differ in different scenarios. In order
to provide the bandwith requirements of the clients,
three different models have been developed (Qiu
et al., 2004) to find the best locations for internet acc-
sess points (ITAP) and ILP is used to formulate the
problem. Another study focuses on clustering the sen-
sors in a way that the least transmission latency is sat-
isfied (Youssef and Younis, 2007). For this purpose
two genetic algorithms for the optimal gateway place-
ment have been introduced and validated by simulat-
ing WSN. There is also a study where a MIP formu-
lation is used in order to optimize the throughput in a
WMN, and a greedy algorithm to solve the problem
of gateway placement (Li et al., 2008). A formula-
tion based on ILP is proposed to lower the cost of the
network deployment by dividing the IoT devices into
two groups such as gateways and lower-end tranmis-
sion devices, according to their power consumptions
(Gravalos et al., 2016).
Communication of devices over long distances is
costly. In order to overcome this problem LoRa,
which is a Low-Power Wide-Area Network (LP-
WAN) technology, can be used. Ability of commu-
nicating over long distances at low power satisfied by
LoRa increases the sustainability of the IoT applica-
tions immensely. A star-to-star topology is introduced
in Long-Range Wide-Area Networks (LoRaWAN) ar-
chitecture. With LoRaWAN, the necessity of building
and sustaining a multi-hop network is discarded, since
IoT devices are able to communicate in a single-hop,
in LoRaWAN (Haxhibeqiri et al., 2018).
Pace of the studies on planning and setting up
efficient LoRa networks has been increasing in the
last few years. For example, a recent study dis-
cusses efficient gateway placement, where a formula-
tion based on mixed-integer non-linear programming
(MINLP) is presented to solve the problem for rela-
tively small LoRa networks, whereas an approximate
algorithm is proposed to set up wider networks (Ousat
and Ghaderi, 2019). An approach to the problem of
gateway placement as a clustering challenge is also
presented, studying on a dynamic IoT scenario and
aiming to find the optimal number of clusters so that
the number of devices which are not able to transmit
data will be minimized (Matni et al., 2020). Coeffi-
cients in a propagation model for Low-Power Wide-
Area Networks (LPWANs) in a specific scenario, in
which a wooded area is considered, are adjusted in
(Cruz et al., 2022) in order to optimize the coverage
area and minimize the number of gateways by using
Evolutionary Particle Swarm Optimization (EPSO).
In (Loh et al., 2021a) the authors introduced an
ILP based approach in order to satisfy the most com-
mon requirement of gateway placement - minimizing
the total number of gateways considering the famous
set cover problem while guaranteeing the robustness
of the network and the proposed method has been
simulated using real-world data of an urban environ-
ment. Aim of the o optimization model in this paper
is to cover all the sensors and cluster them in a way
that each group has an overall quality of data trans-
mission above a determined threshold. Additionally
this approach is simulated by using real-world data of
a rural environment, in which data transmit ranges of
gateway devices differs due to the topography of the
terrain. Results are also evaluated and compared by
using different tools and considering several metrics.
3 PROPOSED APPROACHES
Gateway placement is handled as an application of
the set cover problem in most of the cases, because
the common aim in placing gateways is to cover all
the sensors in a network. It is obvious that a sensor
network can be fully covered by assigning a gateway
to each single device. However, this approach is not
cost-efficient, since a gateway can cover more than
one sensor. Thus, an optimization is needed to find
these proper placement locations of gateways so that
network can be divided into clusters, in where there is
a single gateway device can transmit data with all the
sensors in the cluster.
3.1 Placement by Coverage
Figure 1 shows the first approach on finding appro-
priate gateway locations for the distributed sensors
across the Ergene river. First, a sphere which en-
capsulates the maximum assumed signal range of the
sensors is drawn around the sensors. Second, the in-
tersection of these spheres are taken, because if any
SENSORNETS 2023 - 12th International Conference on Sensor Networks
94

Figure 1: Intersection of signal ranges (dashed circles) are
used for potential gateway (green shaded) regions.
gateway is placed within these intersections, then it
is guaranteed that the communication can be estab-
lished at least once. However, the intersection area
is wide and therefore another step is required to find
exact three-dimensional geographical location of the
gateway. In this step, if there exists any river points
along the intersection area, which the rivers are repre-
sented as small vector lines, then one of these points
are chosen randomly. If there are no river points avail-
able, then the intersection of vertical and horizontal
center of the intersection is chosen.
Number of chosen gateways can widely vary ac-
cording to the coverage distance of the gateways. Due
to possible inclusion of some end-devices within mul-
tiple gateway ranges, it is also possible for a sensor to
broadcast its packet to multiple gateway units which
can further affect the network performance. Another
issue to resolve is the selection of most optimal gate-
way within possible optimal locations so that all sen-
sors can be covered with minimum number of gate-
way units. To resolve this issue, a basic set-cover
approach is applied. First the sensors and their cor-
responding gateways are listed in a hash-map. Then
these maps are sorted in decreasing order. Lastly, sets
are taken one by one until all sensors are taken at least
once.
3.2 Gateway Placement by MIP
In order to find optimal locations for placing gate-
ways, coverage distances of the devices must be con-
sidered. Transmission range of a gateway might dif-
fer due to the topology of the terrain. Also a sensor
should not be in more than one cluster in a network
divided into independent sets of sensors, so that each
data transmitted to a gateway is unique. Especially in
rural environments it is hard to estimate the range of a
gateway, therefore it is difficult to determine optimum
locations for gateways.
In order to formulate the problem as an MIP in-
stance, all the definitions done in the statement of the
problem must be expressed mathematically. Table 1
shows variables used throughout the development of
the proposed model.
In the proposed technique, a grid based approach
Table 1: Variables used in MIP formulation.
variable description
G grid representation of the terrain
S set of sensors in the network
N number of sensors in the network
R gateway coverage range
r
grid
scale of the grid (resolution)
lon
i
, lat
i
projected coordinates of the i
th
x
i
, y
i
grid coordinates of the i
th
node
s
x
, s
y
grid coordinates of sensor s ∈ S
is used to model the environment. Scale of the grid is
provided as a parameter, which indicates the number
of potential placement location in a single axis. Ac-
cording to the grid scale, resolution of the grid can be
determined. Grid resolution indicates the total num-
ber of potential placement locations in the terrain.
Grid resolution has a significant role in the perfor-
mance of the optimization model. A change in the res-
olution of the grid effects the run-time performance of
the optimization model.
x
i
= r
grid
·
lon
i
− lon
min
lon
max
− lon
min
(1)
y
i
= r
grid
·
lat
i
− lat
min
lat
max
− lat
min
(2)
lon
i
=
(lon
max
− lon
min
) · x
i
r
grid
+ lon
min
(3)
lat
i
=
(lon
max
− lon
min
) · x
i
r
grid
+ lon
min
(4)
Sensor location data should be provided following
the format of projected coordinate system. Conver-
sion from projected coordinate system to grid coor-
dinate system is performed by using the Equations 1
and 2. The conversion is performed by scaling each
coordinate between the minimum and maximum val-
ues among the coordinates following the resolution
of the grid. Even though the conversion is straightfor-
ward (for instance it does not take earth’s curvature
into account), it still produces admissible results as
seen in the section 4.2.
After the optimization, selected gateway coordi-
nates than converted back to the real coordinates us-
ing the Equations 3 and 4 which are the inverse
functions of the conversion functions Equation 1 and
Equation 2.
Main purpose of the MIP based optimization
model is to deploy least gateway device as possible
while guaranteeing the sensor network is fully cov-
ered by these gateways. The model divides the wire-
less sensor network into clusters such that in each
cluster there is only one gateway and all the sensors
Gateway Placement in LoRaWAN Enabled Sensor Networks
95

in the cluster are connected only to this gateway de-
vice. In other words, in the end it is expected to see
that there is a one-to-many relation between sensors
and gateways.
Equation 5 shows the objective function for the
optimization model. A 2-dimensional boolean array
(G) is used to represent the grid. Rows and columns
of the array indicate the placement location of a gate-
way. According to the representation, if the gateway
is placed at a point, corresponding value in the array
G will be True (1), otherwise False (0). Thus, we can
formulate the objective of minimizing the number of
gateway as minimizing the number of 1s in G. To be
more precise, summation of the entities in the array
must be reduced as much as possible.
minimize
N−1
∑
i=0
N−1
∑
j=0
G
i j
(5)
During the optimization, the aim is to cover all the
sensors in the network by the planted gateways. Also
each sensor should be connected to only one gateway
device. Therefore a constraint for each sensor is de-
fined in the optimization model.
In the expression of the constraint shown in Equa-
tion 6, 2D binary array G, is used with a function f (in
Equation 7), where the distance between the sensor
and the potential gateway location is calculated. Ac-
cording to the calculated distance a Boolean value is
returned, which indicates if the sensor is in the range
of a gateway device or not. Euclidean Distance for-
mula in Equation 8 is used in order to calculate the
distance between devices.
∀(s ∈ S)
N−1
∑
i=0
N−1
∑
j=0
G
i j
· f (i, j, s
x
, s
y
) ≤ 1
!
(6)
f (x
i
, y
i
, x
j
, y
j
) =
(
1 E(x
i
, y
i
, x
j
, y
j
) ≤ R
0 otherwise
(7)
E(x
i
, y
i
, x
j
, y
j
) =
q
(x
i
− x
j
)
2
+ (y
i
− y
j
)
2
(8)
Implementations related to MIP formulation are
done by using Python programming language. A li-
brary called Python-MIP (Santos and Toffolo, 2020)
is used to built an optimization model. Python-MIP is
a tool, in which a mixed-integer programming based
optimization model is used to formulate the problem
and solve it. To visualize the outcomes of the op-
timization, matplotlib (Hunter, 2007), a commonly
used tool to visualize data, is used. Codes of the
model definition and visualizations are shared within
a repository
1
.
1
https://github.com/canbatuhan/gp-mip
Figure 2: Initial collection of measurements from 75 sample
locations on the Ergene watershed. (The image is a courtesy
of TUBITAK project 115Y064.
4 EVALUATION
4.1 Experimental Environment
Simulation of the introduced model is performed by
using data obtained from a real-world study case. Lo-
cation of the sensors placed in Ergene river are taken
as inputs of the optimization model, in the form of
projected coordinate system. Later, the river is mod-
elled as a grid by converting the input data to grid
coordinate system, as mentioned in Section 3.2.
Sensor network locations in Ergene River contains
75 sensors spread on a 12000 km
2
area (see Figure 2).
Number of gateways to cover all the sensors differs re-
lated to the coverage distance, which is the maximum
distance for a device to transmit data successfully.
In our simulations, we use Network Simulator 3
(ns-3) (Riley and Henderson, 2010). ns-3 supports
third-party modules and for this study, a LoRaWAN
module developed by researchers in a previous study
is utilized (Magrin et al., 2017). In our simula-
tions, we use a scheduling approach similar to slot-
ted ALOHA to distribute sensors across duty-cycles
with as little collision as possible. ns-3 also supports
simulating the network under realistic path-loss con-
ditions which are also taken from previous studies and
fed into the simulation (Phaiboon and Somkuarnpanit,
2006). For 100 meter, path-loss exponent is found
around 2.2 with path-loss as 78 dB.
We also use another simulator, LoRaPlan (Loh
et al., 2021b), which is a gateway placement planning
software for LoRa enabled sensor networks. In Lo-
RaPlan, a user is able to run simulations with sensor
location and gateway location data. Received Sig-
nal Strength Indication (RSSI) level of each reach-
able sensor can be extracted. In LoRaPlan interface,
thresholds for RSSI levels can be set and they are set
to -120 dBm (lower threshold) and -100 dBm (upper
SENSORNETS 2023 - 12th International Conference on Sensor Networks
96

threshold) in default, therefore these threshold values
are used in our experiments.
4.2 Evaluation and Discussion
Evaluation of the proposed methods are performed
using different measures. Manual placement of gate-
ways is used as a baseline during the comparison
of the proposed approaches. Firstly, the number of
gateways is compared. Secondly, a measure called
Failed Packet Attempt (FPA) ratio (as percentage to
all packet transmissions attempts of a sensor) of each
gateway placement scenario is extracted from the re-
sults of ns-3. Thirdly, by using LoRaPlan, RSSI
(dBm) value of each reachable sensor is calculated
for different coverage distances ranging from 1000
meters to 10000 meters. Finally, in order to see the
differences between proposed approaches, gateway
placements are shown on map.
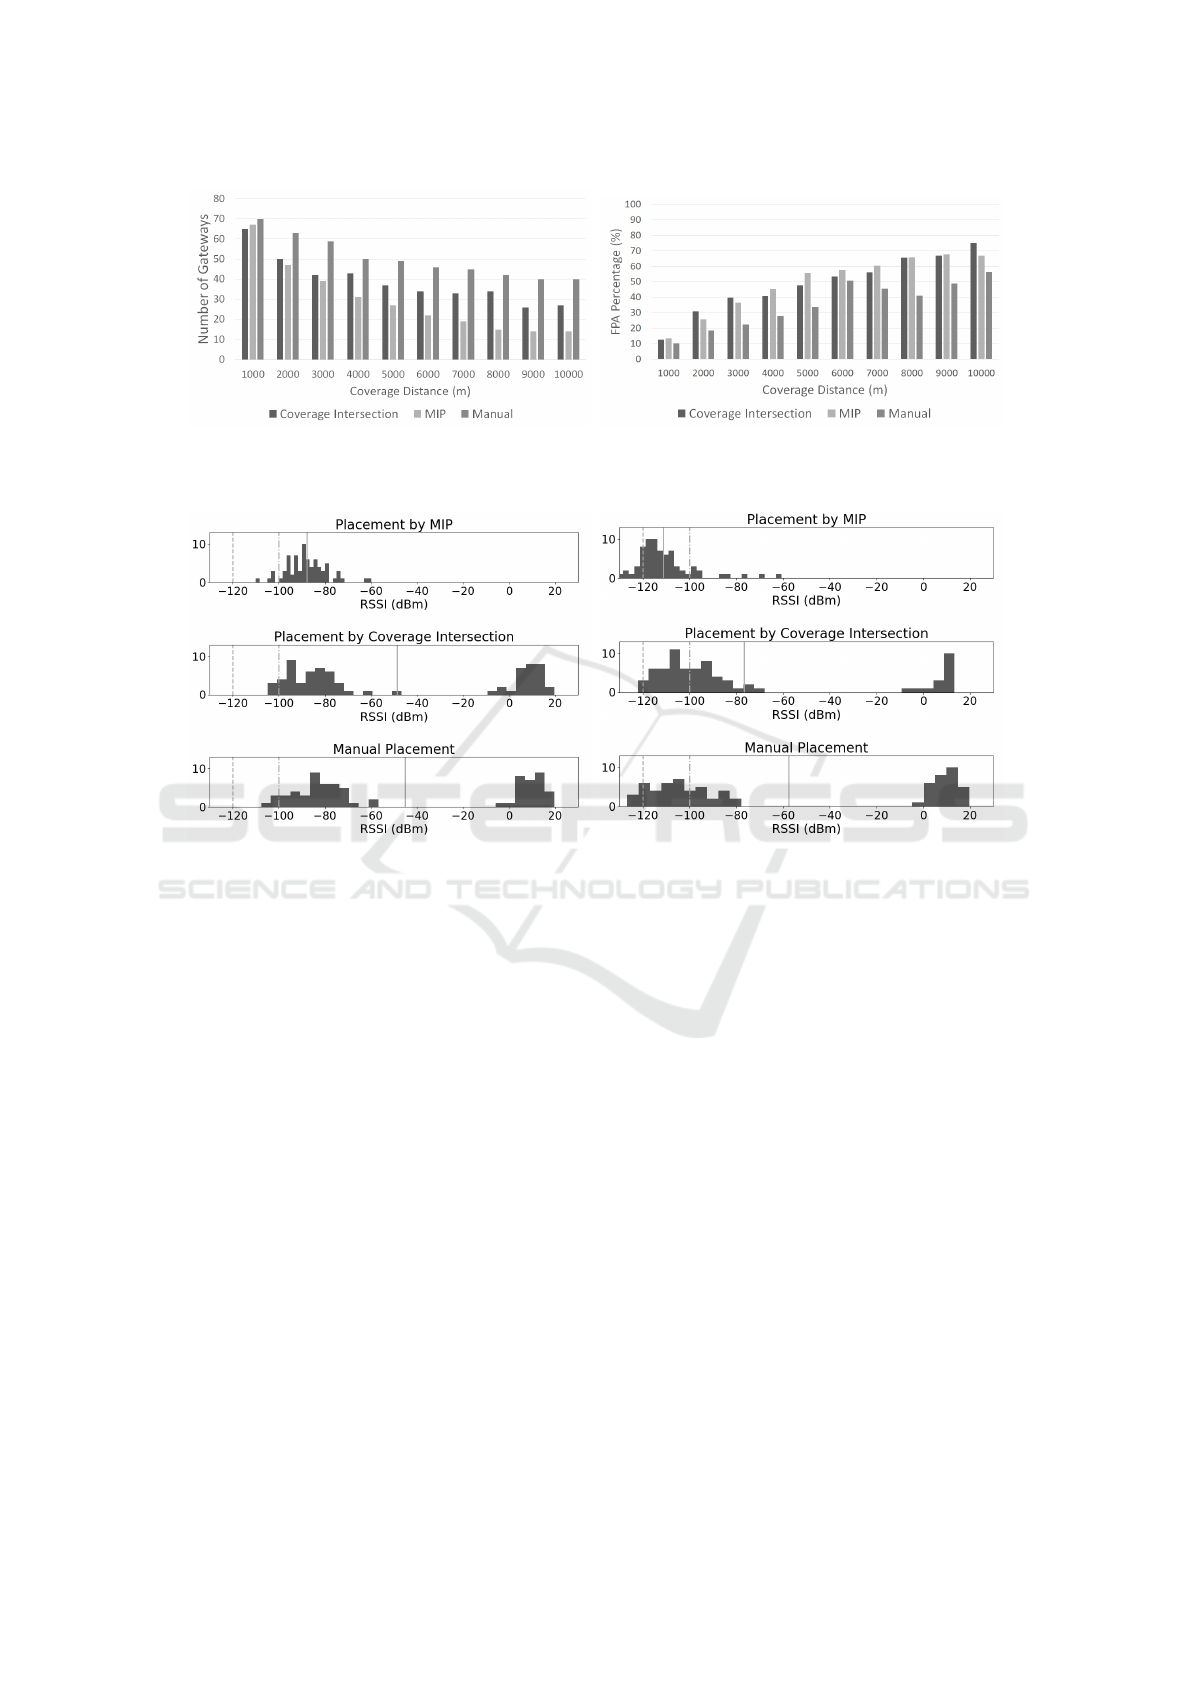
Figure 3a shows how many gateways are used in
order to cover all the sensors located in Ergene River.
In all methods, the number of gateways decreases as
the range increases. Specially in MIP formulation the
decline of gateway count is immense and constant.
This is because the main objective of the optimization
model is to minimize the number of gateways and the
formulation in Equation 5. Also in coverage intersec-
tion method, gateway count declined in short and long
ranges. However, it did not change when the coverage
distance is 6000 to 8000 meters. Also as expected,
the comparison results shows that placing gateways
manually is inefficient in term of the total of number
of gateways, since it can be seen that even when the
range is 10000 meters, 40 gateway locations are se-
lected in manual placement, whereas 27 gateways are
used in coverage intersection method and 14 gateway
location is proposed in MIP formulation.
Figure 3b indicates the probability of a packet loss
during a transmission considering the proposed gate-
way placement. FPA percentage for every method
increase, while the coverage distance increases. As
expected, the manual placement is the best approach
to have a network with less transmission failures.
Nonetheless, it is important to remember that within
the manual placement, the number of gateways is the
highest among proposed approaches. In small ranges
such as 1000 to 3000 meters; MIP method ends up
with finer FPA percentages than coverage intersection
method. For an example in the scenario, in which the
range is 2000 meters, FPA percentage of MIP formu-
lation is approximately 25,63%, whereas the FPA per-
centage of coverage intersection methods is 30,83%.
In medium ranges, FPA percentage of Coverage Inter-
section method is less than the proposed optimization
model. For long ranges; gateway placement proposal
of the MIP method performs better than coverage in-
tersection approach.
In figures 4a and 4b; distribution of RSSI values
of the reachable sensors for each gateway placement
is compared. Comparisons are done for coverage dis-
tances of 2000 meters and 8000 meters, respectively.
In other words, behaviour of the introduced methods
and the base case are analyzed in terms of short and
long ranges of coverage. In all comparisons -100 dBm
is selected as an upper threshold, whereas the -120
dBm is selected as a lower threshold as they set as
default in simulation software, LoRaPlan.
Figure 4a shows the distributions of RSSI values
for reachable sensors in a short range of coverage,
where the coverage is 2000 meters. All the distri-
butions indicate that after each gateway placement
provided by the proposed methods, strength of the
sensors are above the upper threshold. Moreover, it
is noticeable that coverage intersection method ends
up with RSSI values which are similar to the manual
placement, whereas the number of gateways for cov-
erage intersection much less than the manual place-
ment for 2000 meters as shown in Figure 3a.
Distributions of RSSI values in long range sce-
nario, where the coverage distance is 8000 meters, are
presented in Figure 4b. In terms of MIP formulation,
results show that signals strengths are between upper
and lower thresholds. Also in this scenario, MIP for-
mulation ends up with signals that their strengths are
below the lower threshold which means there are no
signal. As it mentioned previously, this is because
that the number of gateways is reduced significantly
in MIP formulation, specially in long range coverage
cases. Figure3a shows that for 8000 meters range,
the number of gateways used in the MIP formulation
is less than half the gateways used in the coverage
intersection method and approximately one third the
gateways used in manual deployment. Therefore the
distances between gateway and sensors are greater in
MIP formulation, thus signal strengths are low.
On the other hand, distribution of RSSI values
with gateway deployment by coverage intersection
differ from the one with manual placement. In cov-
erage intersection method, RSSI values are mostly
between lower threshold and a bit above the upper
threshold. Also there is a group of sensors receiving
signals that their strengths are very high, in coverage
intersection method. However, in manual placement
of gateways, some of the signals are below the lower
threshold. Also in manual placement, there is a bigger
group of sensors that their signal strengths are very
high like in coverage intersection method. In overall,
coverage intersection method protects its stability in
Gateway Placement in LoRaWAN Enabled Sensor Networks
97
(a) Comparison for full coverage. (b) Comparison of failed packet attempt ratios.
Figure 3: Comparison among placement methods.
(a) 2000 meters. (b) 8000 meters.
Figure 4: Distribution of RSSI values for reachable sensors.
terms of RSSI values, even though the distance is in-
creased. It is also remarkable that the number of gate-
ways used in coverage intersection method is much
less than manual placement.
Finally, in order to make a comparison between
the results of MIP formulation and coverage inter-
section method, the sensor network and the proposed
gateway locations are visualized on a grid. Also the
coverage distances and connections between devices
are shown within the network. In Figures 5a and 5b,
gateway placements for 8000 meters of coverage dis-
tance are visualized.
After the gateway placement by coverage intersec-
tion for 8000 meters of coverage distance, 34 gate-
ways are used to cover all the sensors in the network
as shown in Figure 5a. However, there are some loca-
tions in the network that a single gateway might be de-
ployed, so that multiple sensors can be covered. Thus,
the model does not reduce the number gateways as
possible. Moreover, a sensor might be in the range of
more than one gateways. On the other hand, perfor-
mance of the model is better than MIP formulation in
term of overall signal strength as it shown in Figures
4a and 4b.
Gateway placement done by MIP formulation is
focused on minimizing the number of gateways to
fully cover the network. Figure 5b shows that the pro-
posed optimization model, selects 15 gateway loca-
tions to cover all the sensors. This means that MIP
formulation reduces the number of gateways more
than half of the gateways used in coverage intersec-
tion method. Also it is noticeable that the model re-
sults with gateway placements, so that all the sensors
in the network are connected to a single gateway. Re-
ducing the number of gateways causes a decline in
signal strengths as indicated in Figures 4a and 4b,
since distances between devices increase. However,
Figure 3b shows that the FPA percentages of place-
ment by MIP formulation are similar to Coverage In-
tersection method.
While forming the clusters, transmission range
of gateway devices is the first consideration of the
proposed approach. Also minimizing the number of
gateways is the main objective of the optimization
model. In the end, the offered model provides a set
of placement locations, which covers the whole net-
SENSORNETS 2023 - 12th International Conference on Sensor Networks
98
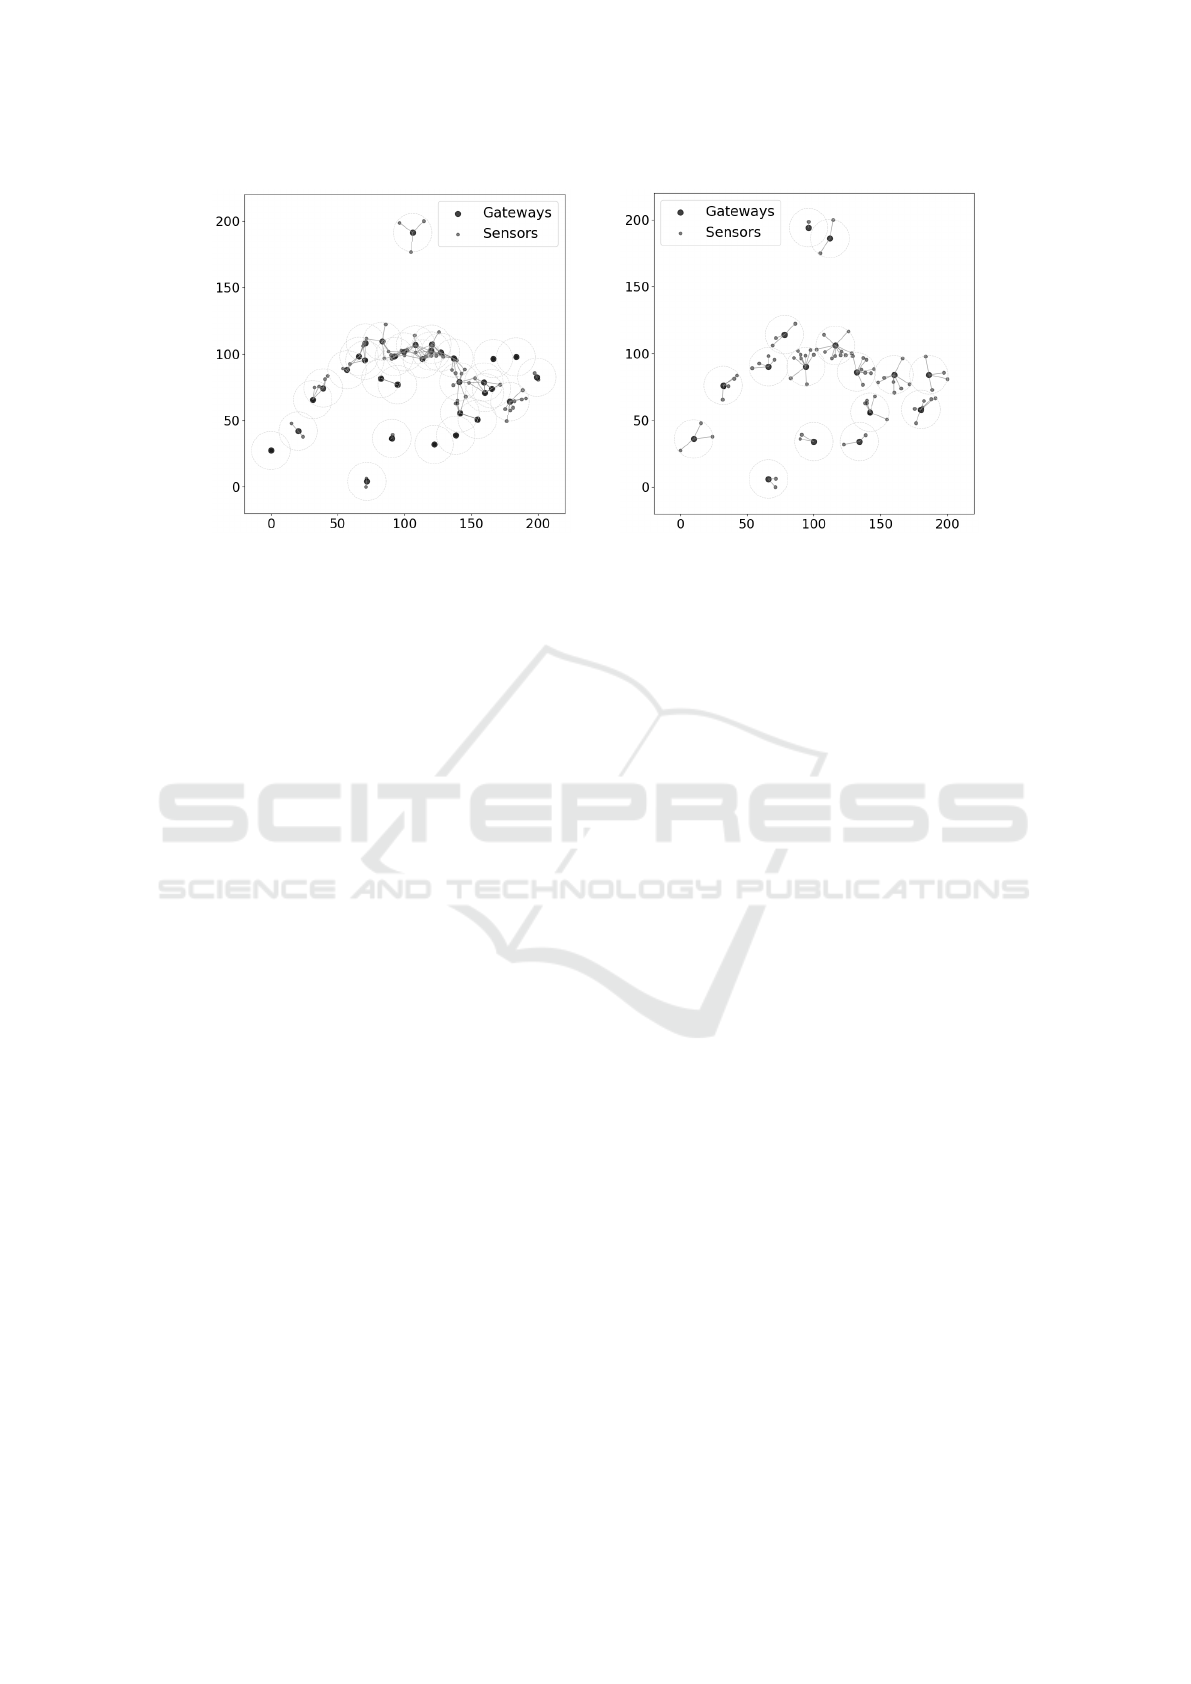
(a) Placement by coverage intersection. (b) Placement by MIP formulation.
Figure 5: Gateway placement examples.
work while the number of gateway devices decreases
and partition the network into clusters having a cer-
tain level of quality of data measurement.
A caveat for the introduced technique is that the
experimental environment is a rural area. Topology of
the terrain has a crucial role in data transmission be-
tween devices. Even though LoRa provides a higher
distance of coverage compared to other techniques,
due to the geographical obstacles, range of a signal
might differ. For example, if there is a hill between
two devices, data transmission might not be com-
pleted successfully, despite to the fact that these two
devices are very close to each other.
5 CONCLUSION
This paper presents two different gateway placement
approaches and evaluates these approaches over a
real-world sensor positions in Ergene River. We run
our simulations in ns-3 and LoRaPlan simulators to
investigate the communication quality obtained by the
network. Our results provide numerical guides to ex-
amine the trade-off between using less gateways to
cover the full set of sensors versus communication
quality.
This work can be extended by experimenting on
different sensor position distributions to further in-
vestigate the points where each of the proposed ap-
proaches’ perform poorly. Moreover, MIP formula-
tion and optimization presented in the paper can be
investigated under different grid sizes to discover the
effect of using finer resolutions in the optimization
versus time requirements. Finally the proposed place-
ment strategies may also have some additional con-
straints such as ease of transportation to gateways or
terrain information such as vegetation, etc.
ACKNOWLEDGEMENTS
This work was supported by the CHIST-ERA
grant CHIST-ERA-19-CES-005, by The Scientific
and Technological Research Council of Turkey
(TUBITAK) under grant id 120N679.
REFERENCES
Abbasi, A. A. and Younis, M. (2007). A survey on clus-
tering algorithms for wireless sensor networks. Com-
puter communications, 30(14-15):2826–2841.
Aoun, B., Boutaba, R., Iraqi, Y., and Kenward, G. (2006).
Gateway placement optimization in wireless mesh
networks with qos constraints. IEEE Journal on Se-
lected Areas in Communications, 24(11):2127–2136.
Bholowalia, P. and Kumar, A. (2014). Ebk-means: A clus-
tering technique based on elbow method and k-means
in wsn. International Journal of Computer Applica-
tions, 105(9).
Cruz, H. A., Ferreira, S. C., Ara
´
ujo, J. P., Barros, F. J.,
Farias, F. S., Neto, M. C., Tostes, M. E., Nascimento,
A. A., and Cavalcante, G. P. (2022). Methodology
for lora gateway placement based on bio-inspired al-
gorithmsfor a smart campus in wooded area. Sensors,
22(17):6492.
Gravalos, I., Makris, P., Christodoulopoulos, K., and Var-
varigos, E. A. (2016). Efficient gateways placement
for internet of things with qos constraints. In 2016
IEEE Global Communications Conference (GLOBE-
COM), pages 1–6. IEEE.
Haxhibeqiri, J., De Poorter, E., Moerman, I., and Hoebeke,
J. (2018). A survey of lorawan for iot: From technol-
ogy to application. Sensors, 18(11):3995.
Gateway Placement in LoRaWAN Enabled Sensor Networks
99

Hunter, J. D. (2007). Matplotlib: A 2d graphics environ-
ment. Computing in science & engineering, 9(03):90–
95.
Li, F., Wang, Y., Li, X.-Y., Nusairat, A., and Wu, Y. (2008).
Gateway placement for throughput optimization in
wireless mesh networks. Mobile Networks and Ap-
plications, 13(1):198–211.
Loh, F., Bau, D., Zink, J., Wolff, A., and Hoßfeld, T.
(2021a). Robust gateway placement for scalable lo-
rawan. In 2021 13th IFIP Wireless and Mobile Net-
working Conference (WMNC), pages 71–78. IEEE.
Loh, F., Mehling, N., Metzger, F., Hoßfeld, T., and Hock,
D. (2021b). Loraplan: A software to evaluate gate-
way placement in lorawan. In 2021 17th Interna-
tional Conference on Network and Service Manage-
ment (CNSM), pages 385–387. IEEE.
Magrin, D., Centenaro, M., and Vangelista, L. (2017). Per-
formance evaluation of lora networks in a smart city
scenario. In 2017 IEEE International Conference on
communications (ICC), pages 1–7. ieee.
Matni, N., Moraes, J., Oliveira, H., Ros
´
ario, D., and
Cerqueira, E. (2020). Lorawan gateway placement
model for dynamic internet of things scenarios. Sen-
sors, 20(15):4336.
Ousat, B. and Ghaderi, M. (2019). Lora network plan-
ning: Gateway placement and device configuration.
In 2019 IEEE International Congress on Internet of
Things (ICIOT), pages 25–32. IEEE.
Phaiboon, S. and Somkuarnpanit, S. (2006). Mobile path
loss characteristics for low base station antenna height
in different forest densities. In 2006 1st International
Symposium on Wireless Pervasive Computing, pages
6–pp. IEEE.
Qiu, L., Chandra, R., Jain, K., and Mahdian, M. (2004). Op-
timizing the placement of integration points in multi-
hop wireless networks. In Proceedings of ICNP, vol-
ume 4, pages 271–282.
Riley, G. F. and Henderson, T. R. (2010). The ns-3 Network
Simulator, pages 15–34. Springer Berlin Heidelberg,
Berlin, Heidelberg.
Santos, H. G. and Toffolo, T. (2020). Mixed integer linear
programming with python.
Younis, M. and Akkaya, K. (2008). Strategies and tech-
niques for node placement in wireless sensor net-
works: A survey. Ad Hoc Networks, 6(4):621–655.
Youssef, W. and Younis, M. (2007). Intelligent gateways
placement for reduced data latency in wireless sensor
networks. In 2007 IEEE International Conference on
Communications, pages 3805–3810. IEEE.
SENSORNETS 2023 - 12th International Conference on Sensor Networks
100
