
Concept Study for Dynamic Vision Sensor Based Insect Monitoring
Regina Pohle-Fr
¨
ohlich and Tobias Bolten
Institute for Pattern Recognition, Niederrhein University of Applied Sciences, Krefeld, Germany
Keywords:
Insect Monitoring, Dynamic Vision Sensor, Event Camera.
Abstract:
A decline in insect populations has been observed for many years. Therefore, it is necessary to measure the
number and species of insects to evaluate the effectiveness of the interventions taken against this decline. We
describe a sensor-based approach to realize an insect monitoring system utilizing a Dynamic Vision Sensor
(DVS). In this concept study, the processing steps required for this are discussed and suggestions for suitable
processing methods are given. On the basis of a small dataset, a clustering and filtering-based labeling ap-
proach is proposed, which is a promising option for the preparation of larger DVS insect monitoring datasets.
An U-Net based segmentation was tested for the extraction of insect flight trajectories, achieving an F1-score
of ≈ 0.91. For the discrimination between different species, the classification of polarity images or simulated
grayscale images is favored.
1 INTRODUCTION
Climate and landscape changes caused by human in-
fluence have a major impact on biodiversity. An
observed and scientifically proven process in recent
years is the population decline of many insect species
(Hallmann et al., 2017). In order to better understand
the processes of species reduction and habitat shifts, a
prototype for long-term monitoring of insects is being
developed, which works non-invasively and enables
a determination of the number of insect flight move-
ments and discrimination of species in the observation
area. For data generation, a Dynamic Vision Sensor
(DVS) is used.
The Dynamic Vision Sensor technology is a result
of the continuing research in the field of neuromor-
phic engineering. The operating and output paradigm
of this sensor differs fundamentally from well-known
and widely used conventional cameras. A DVS does
not record frames at a fixed sampling rate (frames
per second), but rather each pixel responds indepen-
dently and asynchronously to changes in brightness
over time. For each detected brightness change above
a defined threshold, its spatial position in the sensor
array (x, y), a very precise timestamp t of triggering,
and an indicator p for the direction of change is trans-
mitted immediately. Thus, the native output of a DVS
is a data-driven stream of so-called events (see Fig-
ure 1 for an example).
As a result, Dynamic Vision Sensors offer techni-
cal advantages over classical imagers for insect mon-
Figure 1: Example of DVS output stream for flying insects
in front of the DVS.
itoring. In comparison, significantly less redundant
information has to be transmitted, stored and finally
processed, since the output of the sensor is already
driven by changes only. The very high time resolu-
tion in the continuous sensor output, which reaches
the microsecond range, supports the detection of very
fast moving objects such as insects. In addition a DVS
has a significantly higher dynamic range so they pro-
vide meaningful data in areas with changing illumi-
nation or even in very dark environments.
In this paper, we address the task of insect moni-
toring in DVS sensor data within such a challenging
outdoor scenario. We discuss possibilities
• for semi-automatic labeling of the event data
• for extracting the flight trajectories
• for differentiation between different insect species
The rest of this paper is structured as follows. Sec-
tion 2 gives an overview of related work. In Section 3
the processing pipeline currently planned is described
with approaches that can be applied for data labeling,
Pohle-Fröhlich, R. and Bolten, T.
Concept Study for Dynamic Vision Sensor Based Insect Monitoring.
DOI: 10.5220/0011775500003417
In Proceedings of the 18th International Joint Conference on Computer Vision, Imaging and Computer Graphics Theory and Applications (VISIGRAPP 2023) - Volume 4: VISAPP, pages
411-418
ISBN: 978-989-758-634-7; ISSN: 2184-4321
Copyright
c
2023 by SCITEPRESS – Science and Technology Publications, Lda. Under CC license (CC BY-NC-ND 4.0)
411

detecting of the flight paths and to distinguish the dif-
ferent insect species. Finally, a brief summary and an
outlook on future work is given.
2 RELATED WORK
2.1 Insect Monitoring
Currently, there are different ways for monitoring
insects in a habitat. These vary depending on
the specific monitoring task (W
¨
agele et al., 2022).
Malaise traps are used to capture passing insects.
For nocturnal moths, light trapping and, less fre-
quently, bait trapping are used. It should be noted
that all these trapping methods are extremely labour-
intensive. Usually, the insects are killed in the traps
and then DNA analyses are performed. Furthermore,
a disadvantage of these monitoring methods is, that
they only collect data over a short time interval.
For scientific studies of butterflies or diurnal
moths, random manual observations or manual
capture-mark-recapture methods are utilized.
For non-invasive detection of insects, bio-acoustic
identification methods and camera traps can be ap-
plied. Acoustic evaluations are very dependent on
ambient noise. Moreover, they only provide very
rough information about the number of insects in a
given area (W
¨
agele et al., 2022).
Camera traps usually work with motion detectors.
Since insects are very small, these detectors must
be adequately sensitive, but they also react to plant
movements due to wind. As a result, a lot of image
data is recorded that does not contain any information
about insects. Another disadvantage of using conven-
tional cameras is that the insects are blurred as a re-
sult of the rapid movement, so that the detection of
the insects in the images is difficult and prone to error
(W
¨
agele et al., 2022).
Finally, there is the possibility of using radar data.
However, radar detection only shows the movement
of dense insect swarms. Species identification is dif-
ficult (Wang et al., 2017). To our knowledge, using a
DVS for insect monitoring has not been investigated
until now.
2.2 DVS-Based Datasets
The event-based computer vision is a comparatively
young domain. The foundation of the field was laid
in the early 1990s (Gallego et al., 2022). As a result,
the availability of DVS-based datasets is, compared to
the frame-based domain, more limited. Furthermore,
many of the available datasets were recorded indoor
or even under laboratory conditions and are therefore
not suitable for developing an insect monitoring sys-
tem.
In the context of monitoring real-world outdoor
scenarios, datasets from the automotive sector are
available. These datasets often do not provide object
annotations at all (Binas et al., 2017; Hu et al., 2020)
or include only classes that are unusable for insect
monitoring (Alonso and Murillo, 2019; de Tourne-
mire et al., 2020). To the best of the authors’ knowl-
edge, currently there is only one DVS-based dataset
called DVS-OUTLAB providing annotations on a se-
mantic level and including the superclass INSECT
(Bolten et al., 2021). This dataset was recorded in
the context of an urban person monitoring and con-
tains insects only as aspects of environmental influ-
ence and noise. In addition, these annotations are only
available on limited spatial and short temporal regions
of interest and do not include details about the insect
species. Thus, there is currently no public and labeled
dataset that allows a quantitative evaluation of insect
monitoring and approaches to extracting their trajec-
tories.
2.3 DVS-Based Processing
There are a variety of methods to encode and pro-
cess the novel output stream of a DVS (see (Gallego
et al., 2022) for an comprehensive overview). This
includes methods that cluster the sensor event out-
put and thus form and assign objects (Bolten et al.,
2019; Rodr
´
ıguez-Gomez et al., 2020). Frequently, the
events are also converted into classic 2D frames and
then processed further using established computer vi-
sion methods.
In the work (Bolten et al., 2022), semantic seg-
mentation using point clouds as well as frame-based
representations was evaluated on basis of the DVS-
OUTLAB dataset. Utilizing PointNet++ and MaskR-
CNN, resulted in high F1 scores of over 0.9 for the
included class INSECT within their ten class segmen-
tation scenario. Although this study does not allow
a general statement on insect monitoring due to the
mentioned dataset limitations, this still shows the po-
tential of the sensor type within this use case scenario
and motivates further research.
3 PLANNED PROCESSING STEPS
Due to the fact that no suitable DVS data were avail-
able as open data for the question of insect monitor-
ing, seven own datasets were captured for our concept
study. These datasets with a length between 30 sec-
VISAPP 2023 - 18th International Conference on Computer Vision Theory and Applications
412
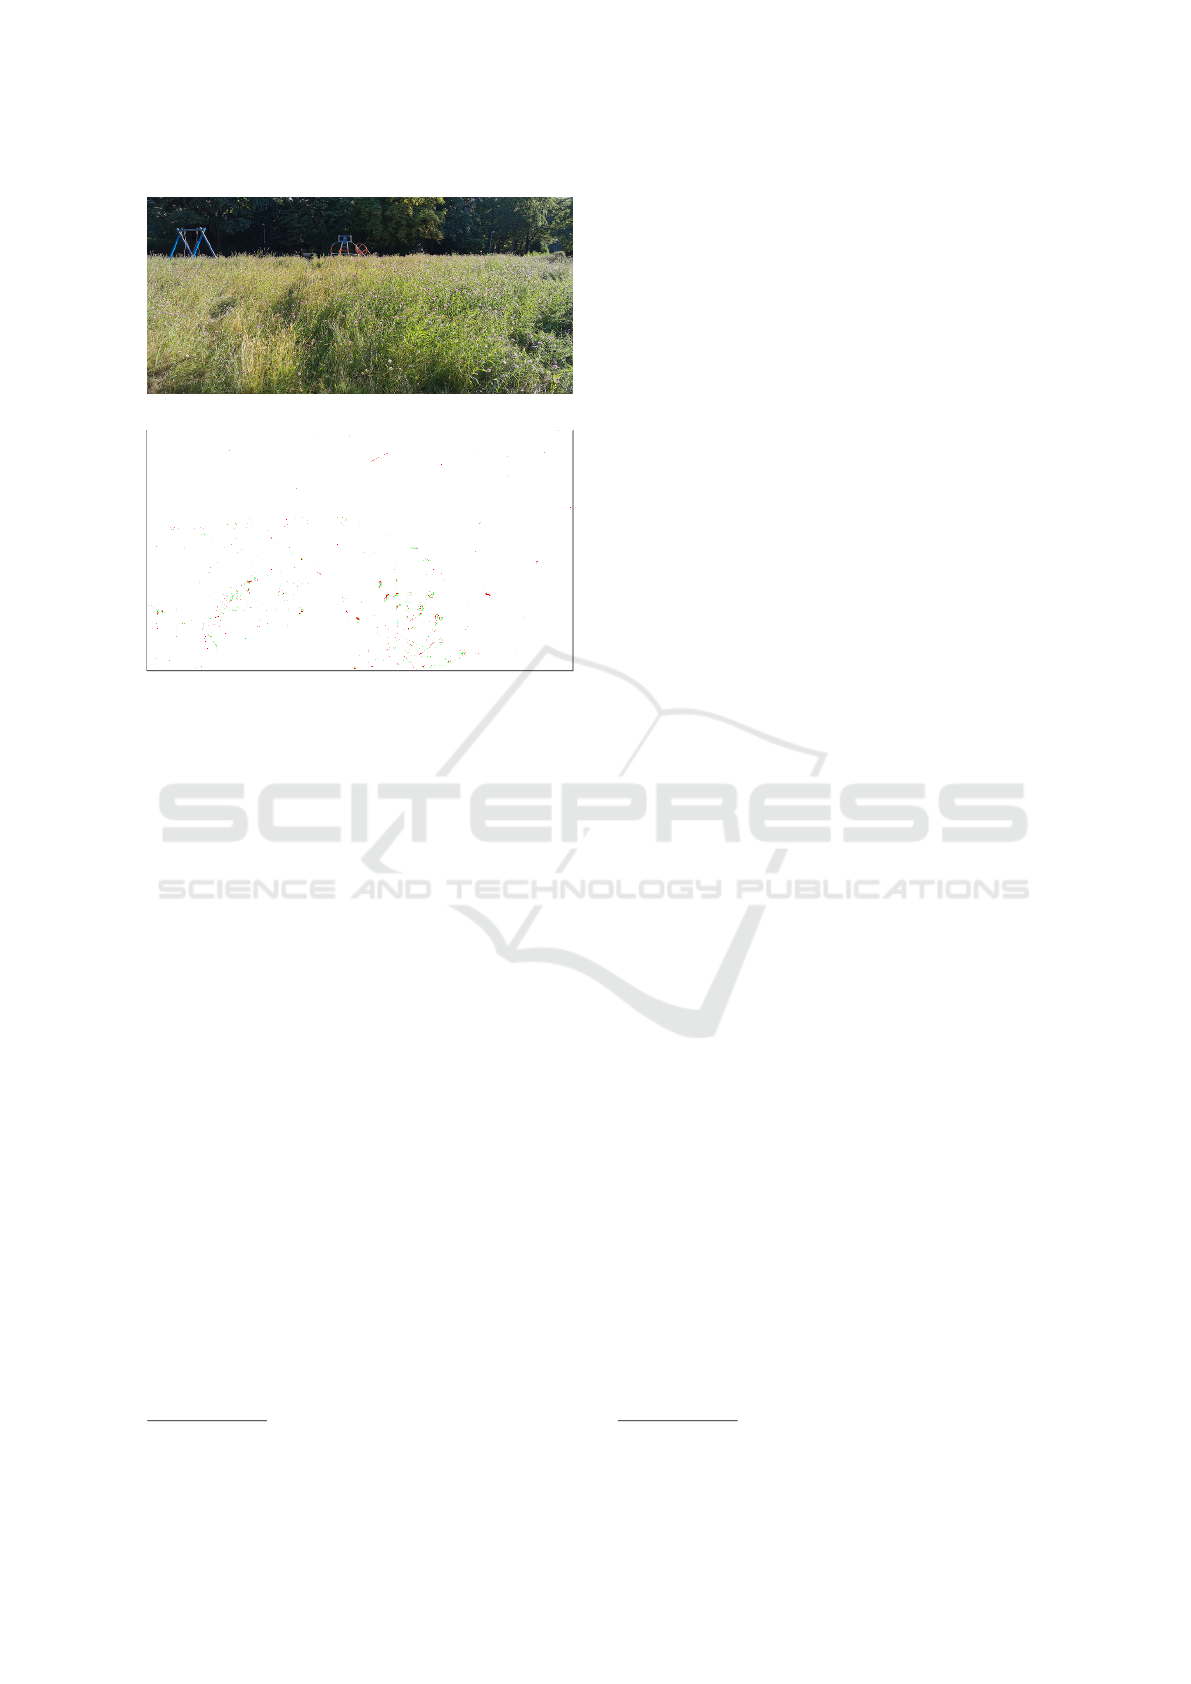
(a) RGB frame.
(b) DVS polarity frame (red ˆ= negative, green ˆ= positive)
(sparse input data; best viewed in color and digital
zoomed).
Figure 2: Comparison between a RGB camera frame and
the output of the DVS sensor accumulated over a time win-
dow of 60 milliseconds.
onds and almost 6 minutes were used to develop the
processing pipeline and to assess the quality of the
individual steps. All datasets were recorded with a
model of the Prophesee GEN4.1-HD DVS. Figure 2
shows a comparison between a RGB camera image
and the output of the DVS sensor accumulated over
a time window of 60 milliseconds. This DVS pro-
vides an image resolution of 1280x720 pixels with a
time resolution in microseconds. To estimate the ap-
plicability of the proposed methods, a dataset of 30
seconds in length was manually labeled and used in
the following experiments. Since the species of in-
sects was currently not available for the sample DVS
data, the events were only subdivided into the classes
INSECT and ENVIRONMENTAL influences including
noise. To evaluate the methods for differentiating
between different insects, additional event data was
simulated from slow-motion videos by using methods
from the Metavision SDK
1
.
A pre-requirement for our processing pipeline is
to prepare the datasets for using AI methods. For
labeling, pre-filtering of the data is necessary to re-
duce the manual effort in order to separate events
caused by insect movements from events caused by
noise and environmental influences. Using the labeled
1
https://docs.prophesee.ai/stable/index.html
data, the detection of flight paths is then carried out
in any recordings. In order to visualize the insects’
movements, an approximation of the detected trajec-
tories by spline functions is then planned. Finally, the
individual trajectories can be assigned to a specific
species using derived features or images.
3.1 Labeling
There are only a few tools for labelling 3D data that
either require additional image material, allow the
manual placement of bounding boxes
2
or work on
voxel data (Berger et al., 2018). Because these pro-
cedures were not applicable to our data, a combina-
tion of pre-filtering followed by clustering was tested
for labeling. For pre-filtering, the fact can be used
that most insects are moving very fast on a spatial
compact flight path. In comparison, environmental in-
fluences such as shadow casts by cloud movement or
the movement of grasses and leaves in the wind lead
to more spatially distributed events. To reduce noise
events, a statistical outlier removal is initially applied.
It calculates the average distance of each point to its
15 nearest neighbors. The value of the neighbors is
chosen so large because insects mostly have dense
flight paths. Then the events that are more distant than
the average distance plus a multiple of the standard
deviation are discarded. For the standard deviation
we chose a small value of 0.5 in order to remove less
compact areas from the event stream. Since in our
test dataset only flying insects occur at a distance of
0.5 to approx. 5 meter, we calculate the linearity fea-
ture for all events according to (Hackel et al., 2016).
In our calculation only events within a radius of three
are used for the calculation of the Eigen values, in or-
der to separate the narrow elongated structures of the
flight paths from the more compact structures of the
plant movements. Then we removed all events with
a linearity value of less than 0.1 in order to filter out
as few insect events as possible. This threshold was
determined experimentally from the data. For the in-
sects, the mean linearity value was 0.44 ± 0.24 and
for the background, the mean value was 0.23 ± 0.3.
Figure 3 shows an example of the result of these fil-
tering steps. In this Figure it can be seen that many
events resulting from noise and environmental influ-
ences (black points) have been removed. The events
of the insect tracks (red points) remain largely unaf-
fected by the filtering. This strategy still needs to be
tested for a larger dataset and for a wider range of in-
sect species.
After filtering, we used the DBSCAN algorithm
(Ester et al., 1996) to cluster the data. This algorithm
2
https://mathworks.com/help/lidar/labeling.html
Concept Study for Dynamic Vision Sensor Based Insect Monitoring
413
(a) Original input.
(b) Filter result.
Figure 3: Projected 3D event space-time point cloud of a
wildflower meadow with insects (30 second time period)
colored using manual class mapping for events from insects
(red) and events from the environment and noise (black).
works density-based and is able to recognize multiple
clusters. It was chosen because this algorithm does
not require the number of clusters to be known in ad-
vance. In addition, the insects’ flight paths form very
dense structures compared to the events of moving
grasses. In our tests, the threshold for the neighbor-
hood search radius was set to 30 and the minimum
number of neighbors required to identify a core point
was set to 10. With these parameters, the algorithm
delivers 1131 clusters for our manually labeled exam-
ple (see Figure 4). It can be seen that a large num-
ber of the flight paths were found correctly, so that
the manual labeling effort was significantly reduced.
In addition, entire clusters can be relabeled with this
method. Another advantage of this approach is that
the data can also be easily prepared for instance seg-
mentation.
3.2 Detection of Flight Trajectories
In the literature, various neural networks are used
for semantic segmentation of event data. In many
applications, graph-based or point-cloud-based neu-
ral networks are used (Bolten et al., 2022). In both
approaches, however, the number of events must be
Figure 4: 3D event space-time point cloud after clustering.
Clusters are highlighted by random colors.
reduced considerably. Typical neural networks for
point clouds, such as PointNet++ (Qi et al., 2017),
only process point clouds with a fixed size. Often
less than 4096 points are used due to computational
requirements. To achieve a reduction in the num-
ber of events, the event point clouds are often di-
vided into patches-of-interest, with additional random
subsampling used for data reduction for each patch.
However, the point cloud used for our tests contained
1943504 events in total. As the flight paths sometimes
contain only a few points, such patching and subsam-
pling would lead to the data no longer containing in-
teresting structures cause by insects.
Another approach for segmenting the event
streams is to convert them into 2D images. Typi-
cal techniques for generating frames from DVS event
streams are based on considering a fixed number of
events or selecting a time window of fixed length. De-
pending on the focus of the application, different en-
coding rules are used that aim to preserve different
aspects of the underlying event stream (Bolten et al.,
2022). Classic encoder-decoder networks are then
used to segment these frames (Alonso and Murillo,
2019). One of such encoder-decoder structures is
the U-Net, which was originally developed by Ron-
neberger (Ronneberger et al., 2015) for segmenting
medical images. One advantage of its architecture is
that it works with few training images and achieves
precise segmentations. For this reason, it was chosen
for the first tests to segment the flight paths.
For our investigation, all events were encoded into
a frame within a time window of 60 milliseconds. We
examined two different encoding types. In binary en-
coding, a pixel is set as soon as an event occurs in the
time window. With time encoding, the time stamps
are set as grey values so that the temporal dynam-
ics in a scene are preserved. For each coding type,
507 images were generated from the manually labeled
point cloud. From each of these, 100 images were
VISAPP 2023 - 18th International Conference on Computer Vision Theory and Applications
414
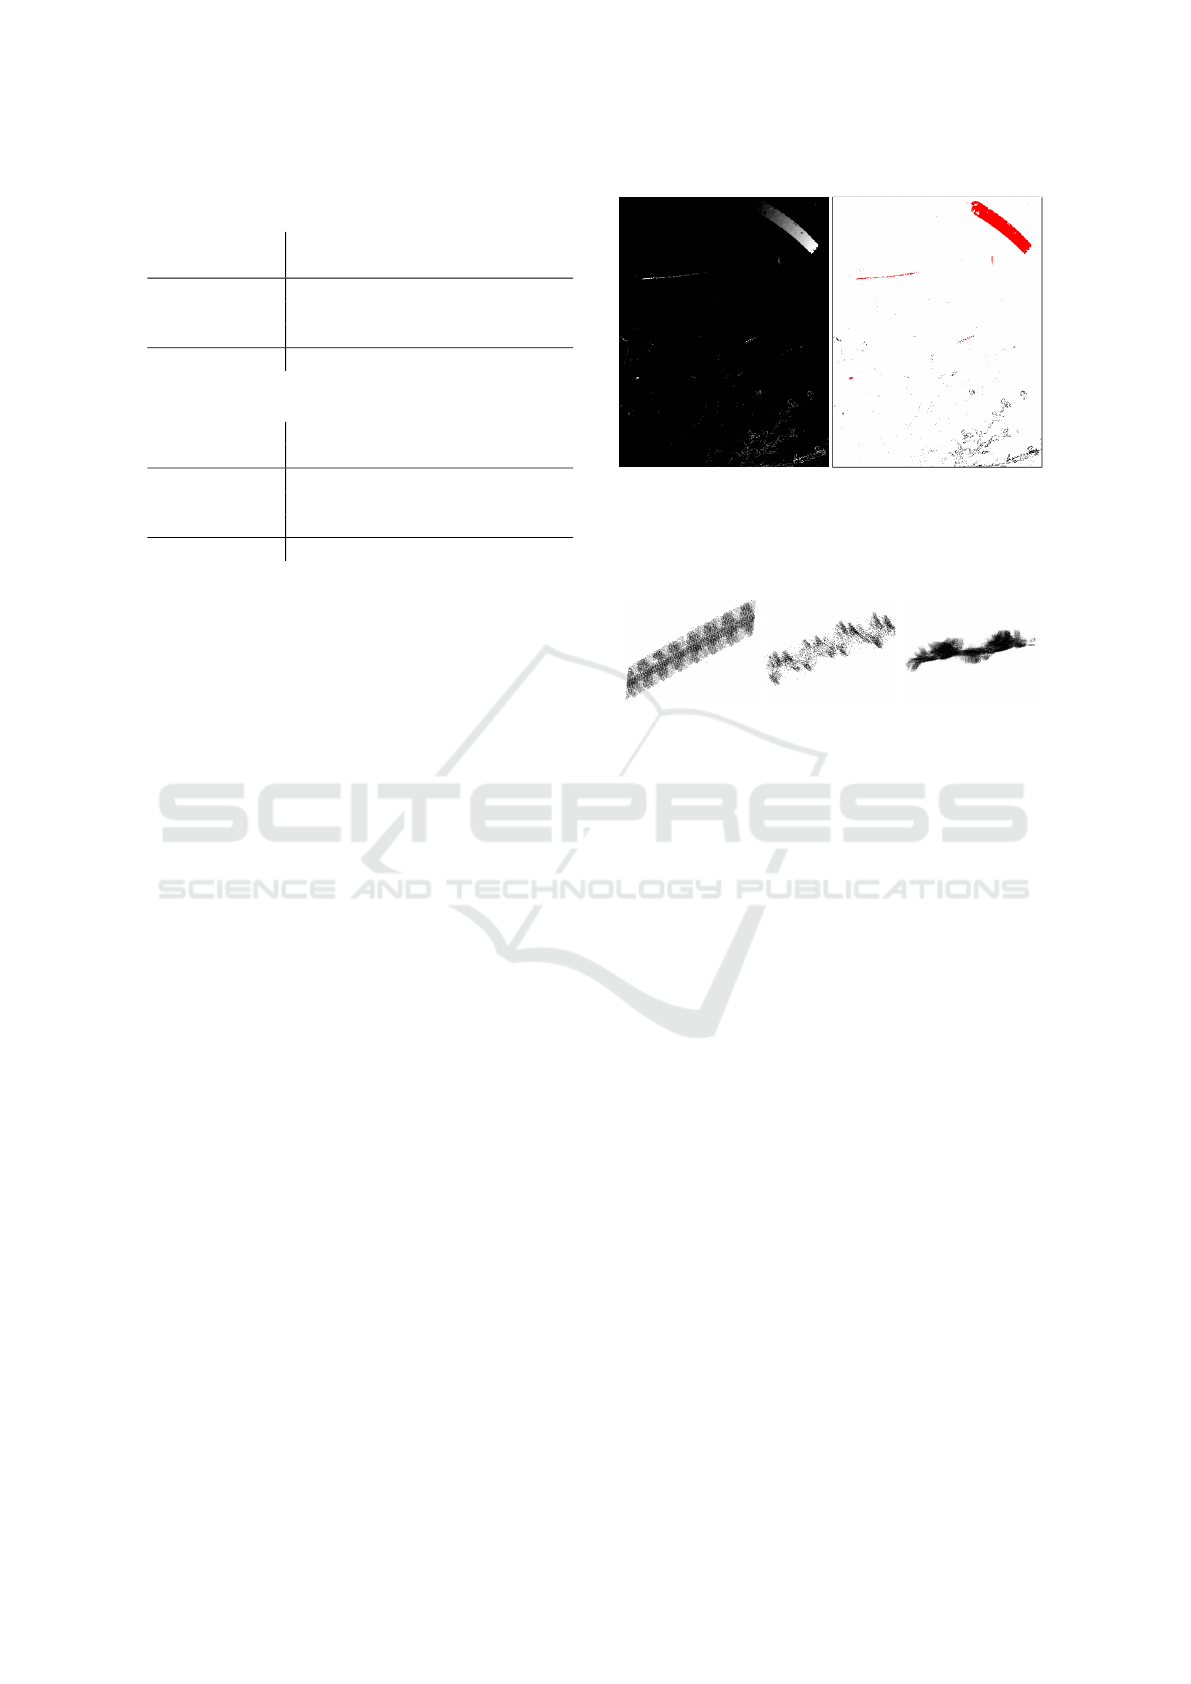
Table 1: Resulting confusion matrices for UNet experiment.
class BACK- ENVIRON- INSECT
GROUND MENT
BACKGROUND 91795957 115889 15024
ENVIRONMENT 2245 192232 3108
INSECT 154 2610 32781
F1 0.999 0.756 0.758
(a) Plain inference after 300 epoch training.
class BACK- ENVIRON- INSECT
GROUND MENT
BACKGROUND 91926870 0 0
ENVIRONMENT 2891 191596 3098
INSECT 510 2598 32437
F1 0.999 0.978 0.912
(b) Corresponding results after pre-processing.
randomly selected as the evaluation set, the rest were
used for training. Furthermore, different layer depths
within the network were used.
The best results according to F1 score were
achieved using a network layer depth of six in com-
bination with the time-encoded input images after
300 training epochs. The resulting confusion matrix
is given in Table 1. The F1 values for the BACK-
GROUND class were 0.99, for the ENVIRONMENT
class 0.76 and for the INSECT class 0.76. When look-
ing at the result images, it became obvious that the
classes ENVIRONMENT and INSECT were mostly de-
tected somewhat too large and filled, which led to the
low F1 values. Within a post-processing, only those
class predictions were considered where events actu-
ally occurred. This makes sense because only these
are important for the backpropagation of the results
to the original 3D event stream for further process-
ing. The confusion matrix after this post-processing
is shown in Table 1b. The F1 values then improved to
0.98 for the ENVIRONMENTAL class and 0.91 for the
INSECT class. An example of this segmentation can
be found in Figure 5.
The obtained F1 scores in our tests correspond ap-
proximately to the values achieved in Bolten (Bolten
et al., 2022). Thus, it could be demonstrated that the
detection of flight paths by means of a neural network
is applicable for our scenario. For practical use, how-
ever, further investigations are required with respect
to the network structure and network configuration as
well as for the selection of the optimal time window.
(a) Time encoded input
frame.
(b) UNet result.
Figure 5: Cropped example frames for UNet based seg-
mentation. Segmentation shown in colors: white ˆ= BACK-
GROUND, black ˆ= ENVIRONMENT, red ˆ= INSECT.
(a) Bee. (b) Dragonfly. (c) Butterfly.
Figure 6: Example for flight patterns.
3.3 Approaches for Differentiation
Between Insect Species
After detecting the trajectories successfully, there are
several possibilities for classifying them to a specific
species.
Classification Based on Derived Features Directly
from DVS Events
A first way for differentiating between insect species
is to analyze flight patterns. A rough differentiation
is provided by the analysis of trajectories. Some but-
terflies, for example, tend to flutter uncontrollably and
in zigzags, while bumblebees, for example, tend to fly
purposefully towards a flower.
The distance travelled is also different. While
butterflies and beetles satisfy their hunger and fly to
fewer flowers, honey bees land more frequently on
flowers of one species successively until they return
to their hive with the collected material.
Looking at the recorded events along the flight
paths of different insects, these resulting flight pat-
terns also provide a possibility for a rough differen-
tiation. For comparison, preferably linear flight seg-
ments should be selected, which can then be classified
e.g. with neural networks for point clouds, such as
PointNet++ (Qi et al., 2017). Figure 6 shows exam-
Concept Study for Dynamic Vision Sensor Based Insect Monitoring
415
ple data for such flight segments of a bee, a dragonfly
and a butterfly.
In addition, the individual insect species also dif-
fer in the number of wing beats when flying. Most
butterflies, for example, achieve between 10 and 20
wing beats, the pigeon tail between 60 and 70, the
ladybird between 75 and 90, the honey bee between
180 and 250, bumblebees 90, flies between 200 and
240 and mosquitoes almost 300 (Greenewalt, 1962).
The wing beat frequency of insects is considered po-
tentially valuable for species identification and is used
e.g. in radar entomology (Wang et al., 2017). In order
to assess the usefulness of this distinguishing crite-
rion, we first examined only the wing beat frequency
for bees. In our study, the number of wing beats for
different bees was calculated from different parts of
the recorded point clouds. To perform the frequency
analysis, the extracted point clouds were transferred
into a new coordinate system using a PCA and the co-
ordinate with the lowest eigenvalue was omitted for
the projection (Figure 7a).
To convert the projection images into curves, the
number of points for the discretized x-values was
counted separately for the positive and negative y-
values in each case in order to exclude a shift in the
wing movement due to the projection (Figure 7b).
The frequency spectrum was then calculated using
FFT and the amplitude values of both curves were
summed up (Figure 7c). To calculate the number of
wing beats, the frequency corresponding to the sec-
ond local maximum was selected, because the first
local maximum contained the curvature of the en-
tire flight path. From these detected frequencies and
the corresponding time intervals, the number of wing
beats per second was calculated for 14 selected trajec-
tories of bees. These varied between 89 and 175 wing
beats, with a mean value of 147.9 ± 6.5. This varia-
tion in values is probably related to the respective po-
sition of the section in the overall flight path (take-off,
in flight, landing). The different loading with pollen
could also play a role. It can therefore be assumed
that the number of wing beats is not a good method
for classifying the insect species in the selected sce-
nario.
Classification Based on Polarity Frames
A second approach is to generate frames by accumu-
lating the previous segmented events and then classi-
fying them. It is only necessary to consider one frame
per trajectory. Therefore it is searched for the largest
bounding box in the images with the projected events
over each 60 milliseconds corresponding to the just
considered trajectory. This ensures that the closest
possible position to the camera is always selected. For
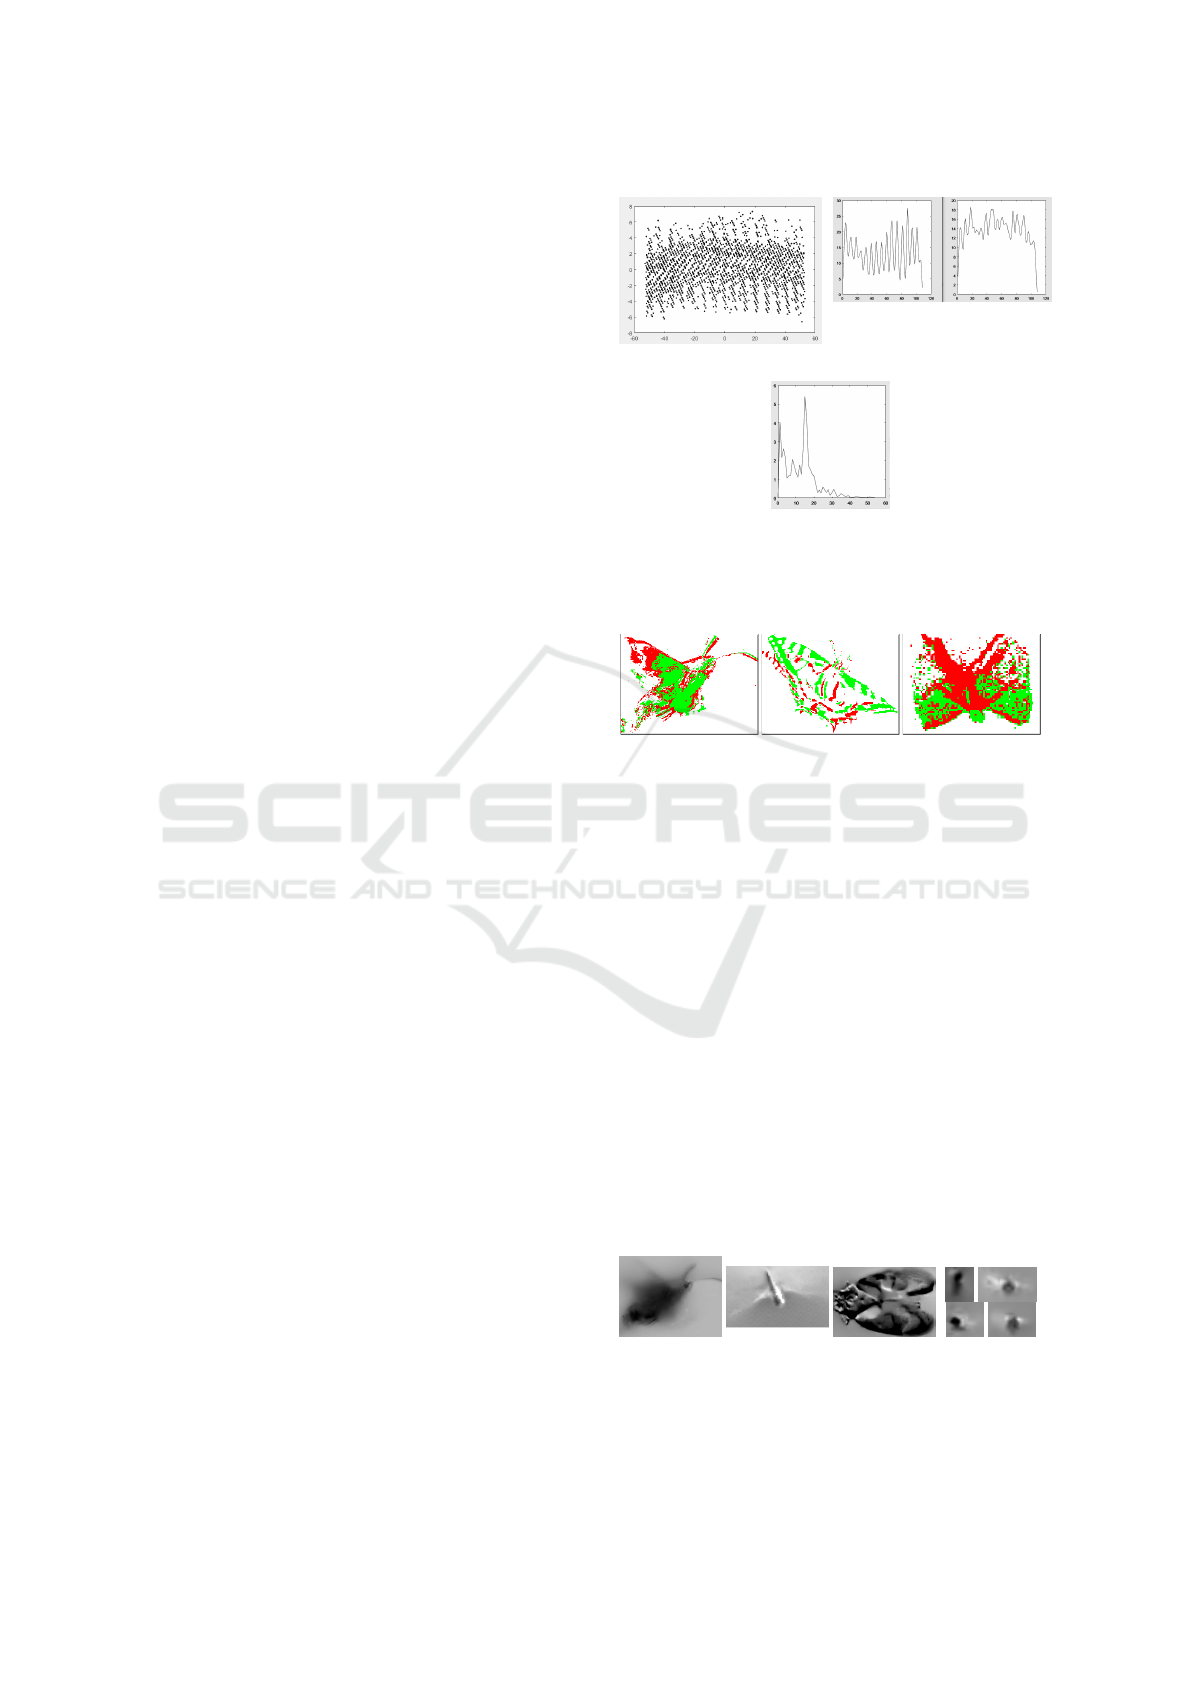
(a) Projection. (b) Curves.
(c) FFT coefficients.
Figure 7: Projection of the point cloud containing only the
events from the selected bee trajectory, derived curves for
y > 0 and y < 0 and sum of the FFT coefficients.
(a) Pigeon Tail. (b) Dovetail. (c) Dragonfly.
Figure 8: Example for generated frames from the polarity
information.
classification of the insect species the polarity values
of the events are used for frame generation. This en-
coding method has shown the best results in previous
studies for classification (Bolten et al., 2022). This
approach is especially useful for insects with a typi-
cal shape or pattern, such as butterflies. Some image
examples can be found in Figure 8.
Classification Based on Simulated Grayscale
Images
Another approach is to simulate a grayscale image
based on the event stream and select the part within
the largest bounding box. Then it can also be classi-
fied with a neural network. Such event-based image
reconstruction methods are based on artificial neural
networks (e.g. (Han et al., 2021), (Wang et al., 2021)).
In our case the reconstruction methods implemented
(a) Pigeon
Tail.
(b) Dragon
Fly.
(c) Blood
Cicada.
(d) Bees
.
Figure 9: Example for simulated gray value frames from
event information.
VISAPP 2023 - 18th International Conference on Computer Vision Theory and Applications
416

in the Metavision SDK is used. Figure 9 shows some
example images reconstructed with this method.
Evaluation of suitable classification approaches is
part of future work.
4 CONCLUSION & OUTLOOK
In this article, individual steps of a processing
pipeline for long-term monitoring of insects using a
DVS are presented. These steps within the pipeline
are examined using a small dataset. The results of the
tests have shown that a combination of filtering and
density-based clustering is a possibility to label larger
datasets that are needed for a more detailed investiga-
tion. In addition, it was found that neural networks
can be used to segment trajectories. Finally, neural
networks based on polarity images or simulated gray
scale images were favored for insect species classifi-
cation. In order to evaluate the individual steps more
precisely, a larger dataset will be recorded and anno-
tated in the next step.
REFERENCES
Alonso, I. and Murillo, A. C. (2019). EV-SegNet: Seman-
tic Segmentation for Event-Based Cameras. In 2019
IEEE/CVF Conference on Computer Vision and Pat-
tern Recognition Workshops (CVPRW), pages 1624–
1633.
Berger, D. R., Seung, H. S., and Lichtman, J. W. (2018).
VAST (Volume Annotation and Segmentation Tool):
Efficient Manual and Semi-Automatic Labeling of
Large 3D Image Stacks. Frontiers in neural circuits,
12:88.
Binas, J., Neil, D., Liu, S.-C., and Delbruck, T. (2017).
DDD17: End-To-End DAVIS Driving Dataset. In
ICML’17 Workshop on Machine Learning for Au-
tonomous Vehicles (MLAV 2017).
Bolten, T., Lentzen, F., Pohle-Fr
¨
ohlich, R., and T
¨
onnies, K.
(2022). Evaluation of Deep Learning based 3D-Point-
Cloud Processing Techniques for Semantic Segmen-
tation of Neuromorphic Vision Sensor Event-streams.
In Proceedings of the 17th International Joint Con-
ference on Computer Vision, Imaging and Computer
Graphics Theory and Applications - Volume 4: VIS-
APP, pages 168–179. INSTICC, SciTePress.
Bolten, T., Pohle-Fr
¨
ohlich, R., and T
¨
onnies, K. D. (2019).
Application of Hierarchical Clustering for Object
Tracking with a Dynamic Vision Sensor. In Ro-
drigues, J. e. a., editor, Computational Science – ICCS
2019, volume 11540 of Lecture Notes in Computer
Science, pages 164–176, Cham. Springer.
Bolten, T., Pohle-Fr
¨
ohlich, R., and T
¨
onnies, K. D. (2021).
DVS-OUTLAB: A Neuromorphic Event-Based Long
Time Monitoring Dataset for Real-World Outdoor
Scenarios. In Proceedings of the IEEE/CVF Con-
ference on Computer Vision and Pattern Recognition
(CVPR) Workshops, pages 1348–1357.
de Tournemire, P., Nitti, D., Perot, E., Migliore, D., and
Sironi, A. (2020). A Large Scale Event-based Detec-
tion Dataset for Automotive. arXiv, abs/2001.08499.
Ester, M., Kriegel, H.-P., Sander, J., Xu, X., et al. (1996). A
Density-Based Algorithm for Discovering Clusters in
Large Spatial Databases with Noise. In Proceedings
of the Second International Conference on Knowledge
Discovery and Data Mining, pages 226–231.
Gallego, G., Delbr
¨
uck, T., Orchard, G., Bartolozzi, C.,
Taba, B., Censi, A., Leutenegger, S., Davison, A. J.,
Conradt, J., Daniilidis, K., and Scaramuzza, D.
(2022). Event-Based Vision: A Survey. IEEE Trans-
actions on Pattern Analysis and Machine Intelligence,
44(1):154–180.
Greenewalt, C. H. (1962). Dimensional relationships for
flying animals. Smithsonian miscellaneous collec-
tions.
Hackel, T., Wegner, J. D., and Schindler, K. (2016). Con-
tour Detection in Unstructured 3D Point Clouds. In
Proceedings of the IEEE conference on computer vi-
sion and pattern recognition, pages 1610–1618.
Hallmann, C. A., Sorg, M., Jongejans, E., Siepel, H.,
Hofland, N., Schwan, H., Stenmans, W., M
¨
uller,
A., Sumser, H., H
¨
orren, T., et al. (2017). More
than 75 percent decline over 27 years in total fly-
ing insect biomass in protected areas. PloS one,
12(10):e0185809.
Han, J., Yang, Y., Zhou, C., Xu, C., and Shi, B. (2021).
EvIntSR-Net: Event Guided Multiple Latent Frames
Reconstruction and Super-resolution. In Proceedings
of the IEEE/CVF International Conference on Com-
puter Vision, pages 4882–4891.
Hu, Y., Binas, J., Neil, D., Liu, S.-C., and Delbruck, T.
(2020). DDD20 End-to-End Event Camera Driving
Dataset: Fusing Frames and Events with Deep Learn-
ing for Improved Steering Prediction. In 2020 IEEE
23rd International Conference on Intelligent Trans-
portation Systems (ITSC), pages 1–6.
Qi, C. R., Yi, L., Su, H., and Guibas, L. J. (2017). Point-
Net++: Deep Hierarchical Feature Learning on Point
Sets in a Metric Space. Advances in neural informa-
tion processing systems, 30.
Rodr
´
ıguez-Gomez, J., Egu
´
ıluz, A. G., Mart
´
ınez-de Dios,
J., and Ollero, A. (2020). Asynchronous event-based
clustering and tracking for intrusion monitoring in
UAS. In 2020 IEEE International Conference on
Robotics and Automation (ICRA), pages 8518–8524.
Ronneberger, O., Fischer, P., and Brox, T. (2015). U-Net:
Convolutional Networks for Biomedical Image Seg-
mentation. In International Conference on Medical
image computing and computer-assisted intervention,
pages 234–241. Springer.
W
¨
agele, J. W., Bodesheim, P., Bourlat, S. J., Denzler,
J., Diepenbroek, M., Fonseca, V., Frommolt, K.-H.,
Geiger, M. F., Gemeinholzer, B., Gl
¨
ockner, F. O., et al.
(2022). Towards a multisensor station for automated
biodiversity monitoring. Basic and Applied Ecology,
59:105–138.
Concept Study for Dynamic Vision Sensor Based Insect Monitoring
417

Wang, L., Kim, T.-K., and Yoon, K.-J. (2021). Joint Frame-
work for Single Image Reconstruction and Super-
Resolution With an Event Camera. IEEE Transac-
tions on Pattern Analysis and Machine Intelligence,
44(11):7657–7673.
Wang, R., Hu, C., Fu, X., Long, T., and Zeng, T. (2017).
Micro-Doppler measurement of insect wing-beat fre-
quencies with W-band coherent radar. Scientific re-
ports, 7(1):1–8.
VISAPP 2023 - 18th International Conference on Computer Vision Theory and Applications
418
