
Intrinsic-Dimension Analysis for Guiding Dimensionality Reduction in
Multi-Omics Data
Valentina Guarino
1
, Jessica Gliozzo
1,2
, Ferdinando Clarelli
3
, B
´
eatrice Pignolet
4,5
, Kaalindi Misra
3
,
Elisabetta Mascia
3
, Giordano Antonino
3,6
, Silvia Santoro
3
, Laura Ferr
´
e
3,6
, Miryam Cannizzaro
3,6
,
Melissa Sorosina
3
, Roland Liblau
5
, Massimo Filippi
6,7,8,9
, Ettore Mosca
10
, Federica Esposito
3,6
,
Giorgio Valentini
1,11
and Elena Casiraghi
1,11,12
1
AnacletoLab - Computer Science Department, Universit
`
a degli Studi di Milano, Via Celoria 18, 20135, Milan, Italy
2
European Commission, Joint Research Centre (JRC), Ispra, Italy
3
Laboratory of Neurological Complex Disorders, Division of Neuroscience, Institute of Experimental Neurology (INSPE),
IRCCS San Raffaele Scientific Institute, 20132 Milan, Italy
4
CRC-SEP, Neurosciences Department, CHU Toulouse, France
5
Infinity, CNRS, INSERM, Toulouse University, UPS, Toulouse, France
6
Neurology and Neurorehabilitation Unit, IRCCS San Raffaele Scientific Institute, 20132 Milan, Italy
7
Vita-Salute San Raffaele University, 20132 Milan, Italy
8
Neurophysiology Unit, IRCCS San Raffaele Scientific Institute, 20132 Milan, Italy
9
Neuroimaging Research Unit, Division of Neuroscience, Institute of Experimental Neurology (INSPE), IRCCS San
Raffaele Scientific Institute, 20132 Milan, Italy
10
Institute of Biomedical Technologies, National Research Council, Segrate (Milan), Italy
11
CINI, Infolife National Laboratory, Roma, Italy
12
Environmental Genomics and Systems Biology Division, Lawrence Berkeley National Laboratory, Berkeley, CA, U.S.A.
Keywords:
Dimensionality Reduction, Intrinsic Dimensionality, Feature Selection, Feature Clustering, Omics Datasets.
Abstract:
Multi-omics data are of paramount importance in biomedicine, providing a comprehensive view of processes
underlying disease. They are characterized by high dimensions and are hence affected by the so-called ”curse
of dimensionality”, ultimately leading to unreliable estimates. This calls for effective Dimensionality Reduc-
tion (DR) techniques to embed the high-dimensional data into a lower-dimensional space. Though effective
DR methods have been proposed so far, given the high dimension of the initial dataset unsupervised Feature
Selection (FS) techniques are often needed prior to their application. Unfortunately, both unsupervised FS
and DR techniques require the dimension of the lower dimensional space to be provided. This is a crucial
choice, for which a well-accepted solution has not been defined yet. The Intrinsic Dimension (ID) of a dataset
is defined as the minimum number of dimensions that allow representing the data without information loss.
Therefore, the ID of a dataset is related to its informativeness and complexity. In this paper, after proposing a
blocking ID estimation to leverage state-of-the-art (SOTA) ID estimate methods we present our DR pipeline,
whose subsequent FS and DR steps are guided by the ID estimate.
1 INTRODUCTION
Many human diseases arise from the interplay of vari-
ations in multiple genes and environmental factors.
While disease diagnosis can be performed based on
similarities of symptoms, disease subtype identifica-
tion based on biomolecular profiles can lead to deeper
understanding of underlying disease mechanisms, di-
agnosis/prognosis, and to personalized treatments (as
aimed by Precision Medicine). In this context, the ad-
vent of high-throughput techniques recently allowed
acquiring unprecedented amounts of multi-omics data
that, when opportunely integrated, may provide a
comprehensive description of genetic, biochemical,
metabolic, proteomic, and epigenetic processes un-
derlying a disease (Nicora et al., 2020).
The past decade has experienced an increasing in-
terest in the development of multi-view integration
methods integrating datasets as complex as multi-
omics ones, and some effective approaches have been
proposed (Meng et al., 2016; Gliozzo et al., 2022).
Nevertheless, most of them cannot handle the di-
Guarino, V., Gliozzo, J., Clarelli, F., Pignolet, B., Misra, K., Mascia, E., Antonino, G., Santoro, S., Ferré, L., Cannizzaro, M., Sorosina, M., Liblau, R., Filippi, M., Mosca, E., Esposito, F.,
Valentini, G. and Casiraghi, E.
Intrinsic-Dimension Analysis for Guiding Dimensionality Reduction in Multi-Omics Data.
DOI: 10.5220/0011775200003414
In Proceedings of the 16th International Joint Conference on Biomedical Engineering Systems and Technologies (BIOSTEC 2023) - Volume 3: BIOINFORMATICS, pages 243-251
ISBN: 978-989-758-631-6; ISSN: 2184-4305
Copyright
c
2023 by SCITEPRESS – Science and Technology Publications, Lda. Under CC license (CC BY-NC-ND 4.0)
243

mension of the considered views, which is often
much larger than the available sample size (small-
sample-size problem). This results in largely sparse
datasets, where the “curse of dimensionality” (Trunk,
1979; Lv, 2013; Hughes, 1968) causes unreliable es-
timates of pairwise-distances (Franc¸ois et al., 2007;
S
¨
odergren, 2011; Ceruti et al., 2014). In this context,
the samples are assumed to be drawn from an original
lower-dimensional manifold that has been twisted and
curved by a smooth mapping bringing to the observed
high-dimensional space. Hence, the true information
can be outlined by many fewer coordinates than those
of the high-dimensional space. Under this assump-
tion, DR techniques have become essential in the
bioinformatics field, and several (linear/non-linear)
methods have been proposed in literature (Nanga
et al., 2021) to embed the data into a space where re-
dundancy and noise are removed while salient infor-
mation is emphasized (Erichson et al., 2016; Halko
et al., 2011), or the local and global topological struc-
ture of the dataset is preserved (Van der Maaten and
Hinton, 2008; McInnes et al., 2018). Most DR
techniques showed impressive results but they often
base their analysis on pairwise-point relationships,
which are biased when incurring small-sample-size
and curse of dimension. An unsupervised FS step is
therefore required prior to their application (Solorio-
Fern
´
andez et al., 2020) to obtain a more tractable (re-
duced) space. However, both FS and DR techniques
need the dimension of the lower-dimensional space as
input. This value should be carefully chosen (Nguyen
and Holmes, 2019); excessively large values would
bring to the computation of still sparse, noisy, and re-
dundant datasets, while excessively low values would
cause the loss of salient information. Such a choice is
still an open problem.
The ID of a dataset is defined as the minimum
number of dimensions needed to represent the data
without information loss (Ceruti et al., 2014; Facco
et al., 2017). We propose an FS and DR approach
that exploits a novel and robust estimate of the dataset
ID as a crucial description of the dataset informative-
ness, which should be maintained and targeted by the
proposed pipeline. We use our approach to reduce
the dimension of each view in a multi-omics dataset.
However, the generality of the method allows its ap-
plication to any type of data.
2 MULTIPLE SCLEROSIS
DATASET
Multiple Sclerosis (MS) is a chronic disease of the
Central Nervous System, characterized by inflamma-
tion, demyelination and axonal loss. It currently
affects more than 2.8 million people globally, be-
ing the most common cause of non-traumatic neu-
rologic disability in young adults. MS is an highly
heterogeneous disease in terms of clinical presen-
tation and treatment response and its precise aeti-
ology is unknown, although it is widely accepted
that it implicates an interplay between genetic, en-
vironmental, and lifestyle factors. With the advent
of high throughput assays, an important contribu-
tion can be derived from their integration to iden-
tify (through unsupervised clustering) disease sub-
phenotypes, which would be an important step to-
wards stratified medicine. To obtain reliable in-
tegrative unsupervised clustering results from high-
dimensional multi-omics views, a well-designed prior
step of DR is needed.
We tested our ID-based DR method on both
miRNA and mRNA data of a private multi-omics
dataset describing the genome profile of MS pa-
tients, which were sampled before the start of a
first-line treatment, with further exclusion of those
who had been treated with highly-active immunosup-
pressive or second-line drugs. These criteria were
adopted in order to minimize the impact of drugs on
-omics values. The transcriptome was generated us-
ing the Truseq stranded mRNA kit and sequenced on
the Illumina HiSeq4000, whereas miRNA libraries
were generated using SMARTer smRNA kit Sequenc-
ing on Illumina NOVAseq6000. Both assays were
performed on peripheral mononuclear blood cells
(PBMC). Quality control, normalization and filtering
for the two -omics was performed in order to mini-
mize possible technical artifacts and to discard fea-
tures deemed as not expressed, yielding D = 502 and
D = 20745 features for miRNA and mRNA, respec-
tively. Overall, for 170 patients both miRNA and tran-
scriptomics values were available.
3 METHODS
Our ID-based DR method processes each view of the
MS dataset by applying four consecutive steps (Fig-
ure 1). After each step, we monitor the ID to un-
derstand whether important information has been re-
moved.
1. Min-max Normalization Step followed by
Global ID estimation (Sections 3.1.1 and 3.1.2)
to obtain a first estimate of the dataset informa-
tiveness. Though the ID estimated at this step
is most probably affected by the curse of dimen-
sionality, it can be used as an input parameter for
computing the blocking-ID estimate we propose
BIOINFORMATICS 2023 - 14th International Conference on Bioinformatics Models, Methods and Algorithms
244

in this paper.
2. High Pairwise-correlation Filtering to remove
redundancy. Pairs of features showing a high pair-
wise correlation (i.e. Spearman correlation > 0.8)
are filtered to remove the feature having the higher
mean correlation with all the other features in the
dataset
1
. The parallel algorithm we implemented
to perform this task is outlined in Appendix A.
3. Blocking ID Estimation (Section 3.1.3). This
estimation approach is inspired by the blocking
analysis applied in (Facco et al., 2017) to com-
pute an ID estimate less affected by noise in the
data samples. In this paper, we revisit it in order
to provide an ID estimate (hereafter referred to as
blocking-ID) robust with respect to the curse of
dimensionality (affecting datasets characterized
by an extremely large dimensionality compared to
the limited sample cardinality). Furthermore, we
use it to identify the minimum number of features,
C , that should be kept by the next unsupervised
FS approach (Step 4 below) to ensure that, with
a certain degree of confidence, most of the salient
information is kept, while noise and redundancies
are minimized.
4. Unsupervised FS via Hierarchical Clustering
(Solorio-Fern
´
andez et al., 2020; Gagolewski,
2021) to select C features that are the medoids of
the corresponding C feature clusters (Section 3.2
and Appendix B).
5. Blocking ID Estimation in order to monitor po-
tential retained noise and information loss.
6. Dimensionality Reduction: The representative
feature set is finally embedded to a lower-
dimensional space, whose dimensionality is cho-
sen based on the blocking-ID estimate computed
in Step 3. To this aim, we compare four differ-
ent DR techniques (UMAP, t-SNE, RPCA and
RCUR) and choose the one that allows obtain-
ing a global ID estimate that is comparable to the
blocking-ID computed in Step 3.
3.1 ID Estimation
The ID (Johnsson, 2011; Campadelli et al., 2015)
of a dataset is the minimum number of parameters
1
Is worth mentioning that, from a biological perspec-
tive, the correlation between omics variables could often be
meaningful: for example, correlated variables in expression
data could relate to the same molecular pathway (Allocco
et al., 2004), and thus to coregulated genes. However, from
a statistical point of view, highly-correlated variables may
affect the reliability of estimates leading to inflated values.
Thus, their removal is often advisable.
needed to maintain its characterizing structure; in
other words, the ID is the minimum number of di-
mensions of a lower dimensional space where the
data can be projected (by a smooth mapping) in or-
der to minimize the information loss. When a dataset
X
n
= {x
i
}
n
i=1
⊂ R
D
has ID equal to d, the D- dimen-
sional samples are assumed to be uniformly drawn
from a manifold with topological dimension equal to
d, that has been embedded in a higher D-dimensional
space through a nonlinear smooth mapping. Unfor-
tunately, the estimation of the topological dimension
of a manifold using a limited set of points uniformly
drawn from it is a challenging, not yet solved task. All
the SOTA ID estimation techniques exploit differing
underlying theories, according to which they are of-
ten grouped into the following four main categories:
Projective ID estimators, Topological-based ID esti-
mators, Fractal ID estimators, and Nearest-Neighbors
(NN) based ID estimators.
In the bioinformatics field, the available datasets
are often noisy and complex. In this context, Pro-
jective, Topological-based and Fractal ID estimators
are often outperformed by NN estimators; Fractal ID
estimators fail when the points are noisy and/or not
uniformly drawn from the underlying manifold, while
Projective and Topological-based ID estimators pro-
duce reliable estimates for data drawn from mani-
folds with mainly low curvature and low ID values.
On the other hand, NN estimators have shown their
robustness on not-uniformly drawn, noisy and com-
plex datasets, where the two main assumptions at the
base of Fractal, Topological-based, and Projective ID
estimators are often violated. Indeed, (1) the points
cannot be assumed to be uniformly drawn from the
manifold where they are assumed to lie, and (2) the
complexity of the available datasets allows assuming
that the points lie on more-than-one, eventually in-
tersecting manifolds, each characterized by a specific
topological dimension.
To account for the aforementioned issues, NN es-
timators often compute a reliable “global” ID estima-
tor by integrating all the “local” IDs estimated over
point-neighborhoods. Based on these remarks, in this
work we estimated the ID of the available multi-omics
views by comparing two NN ID estimators, namely
DANCo (see subsection 3.1.1) and TWO-NN (see
subsection 3.1.2).
3.1.1 DANCo
DANCo (Ceruti et al., 2014) estimates the (potentially
high) ID of a dataset by comparing the joint probabil-
ity density functions (pdfs) characterizing the point-
neighborhood distributions in the input dataset to a set
of pdfs, each characterizing the point-neighborhood
Intrinsic-Dimension Analysis for Guiding Dimensionality Reduction in Multi-Omics Data
245
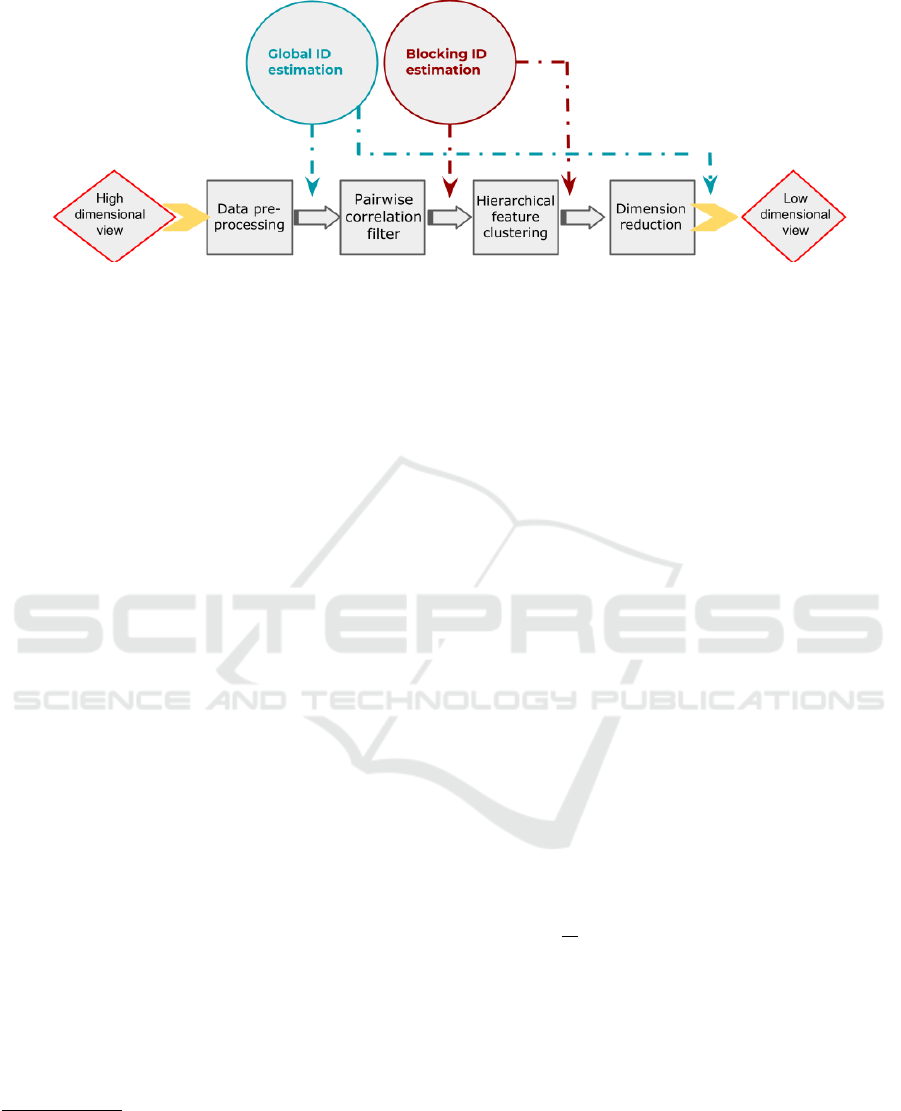
Figure 1: Workflow of our ID-based approach.
distribution in a synthetic dataset uniformly drawn
from a manifold of known (candidate) ID
2
. More pre-
cisely, the Kullback-Leibler (KL) divergence is used
to compare the pdf estimated on the input dataset to
each of the pdfs estimated on the synthetic datasets
and the input-dataset ID is estimated as the dimen-
sionality of the synthetic manifold minimizing the KL
divergence.
DANCo has proven its effectiveness when tested
both on synthetic and real, noisy datasets, composed
of points for which the assumption of uniform sam-
pling from the underlying manifold does not hold.
However, our preliminary tests performed to under-
stand its behaviour (when applied to both the available
views and in some views from the TCGA dataset
3
- data not shown due to shortage of space) clearly
showed its dependency from the size of the consid-
ered point-neighborhoods that are used to estimate
the joint pdfs (defined by the number k of NNs to
be considered). More precisely, in order to pursue
the assumption of local uniformity of point distribu-
tions, k should not be too high (e.g. it could be set so
that the neighborhoods contain less than the 1/10 of
the sample-cardinality). However, choosing a fixed k
value for different views may lead to unreliable esti-
mates. Indeed, on less sparse, “twisted”, and curved
datasets, (i.e. less affected by small-sample-sizes as in
the available miRNA data - Figure 2 -left) the ID esti-
mate increases together with k. On the other side, on
more sparse datasets (cursed by high-dimensions and
small-sample-sizes, as in the available mRNA data
- Figure 2 -right) a low neighborhood size (k = 6)
produces a peak in the ID estimate, after which we
note a drop. This may be due to the fact that, being
2
The joint pdf characterizing the distribution of neigh-
borhoods in a given dataset is the product of two indepen-
dent (parameterized) terms namely g(r; k, d) and q(θ; ν,τ)
that characterize, respectively, the normalized NN distance
distribution and the pairwise-angle distribution.
3
https://www.cancer.gov/about-nci/organization/ccg/
research/structural-genomics/tcga
the dataset more twisted and curved, local uniformity
(and consequent reliable estimates) may be assumed
only when considering small neighborhoods.
The strong dependency of DANCo estimates from
the k parameter requires choosing its value by a care-
ful and objective analysis of each individual view of
a multi-omics dataset. To automatize this choice we
propose selecting the value of k that minimizes the
distance between the DANCo and the ID estimate ob-
tained by the following TWO-NN estimator.
3.1.2 TWO-NN
TWO-NN (Facco et al., 2017) is a NN ID estimator
that has been developed by considering that several
SOTA ID estimators compute estimates that are either
influenced by the cardinality of the considered point
neighborhoods, or are not robust with respect to not-
uniformly distributed point-neighborhoods, which is
often the case of real-world bioinformatics datasets.
To tackle the aforementioned problems, the authors
proposed theories that highlight how, assuming local
uniformity across 2-NN neighborhoods, the volume
of the shell between the first and the second NNs of
each point in a manifold is dependent on the (local)
manifold ID. This ultimately brings to a Pareto law
relationship linking the (true) manifold ID, d, and the
ratio, µ
i
=
r
2i
r
1i
of the distances between the i−th point
and its second and the first NN: L (µ
i
;d) = dµ
(d−1)
i
.
Based on this relationship an ID estimate,
ˆ
d, can be
derived by fitting the empirical cumulative distribu-
tion of the µ
i
s through a maximum likelihood estima-
tor.
Note that the TWO-NN formulation requires as-
suming a uniform distribution only across 2-NN
neighborhoods, and it should be therefore less af-
fected by more twisted and curved datasets. When
compared to DANCo (Figure 2), the TWO-NN esti-
mator has a lower variance of the estimates; however,
DANCo has proven to be more robust than TWO-
NN in the presence of boundary points (Facco et al.,
BIOINFORMATICS 2023 - 14th International Conference on Bioinformatics Models, Methods and Algorithms
246
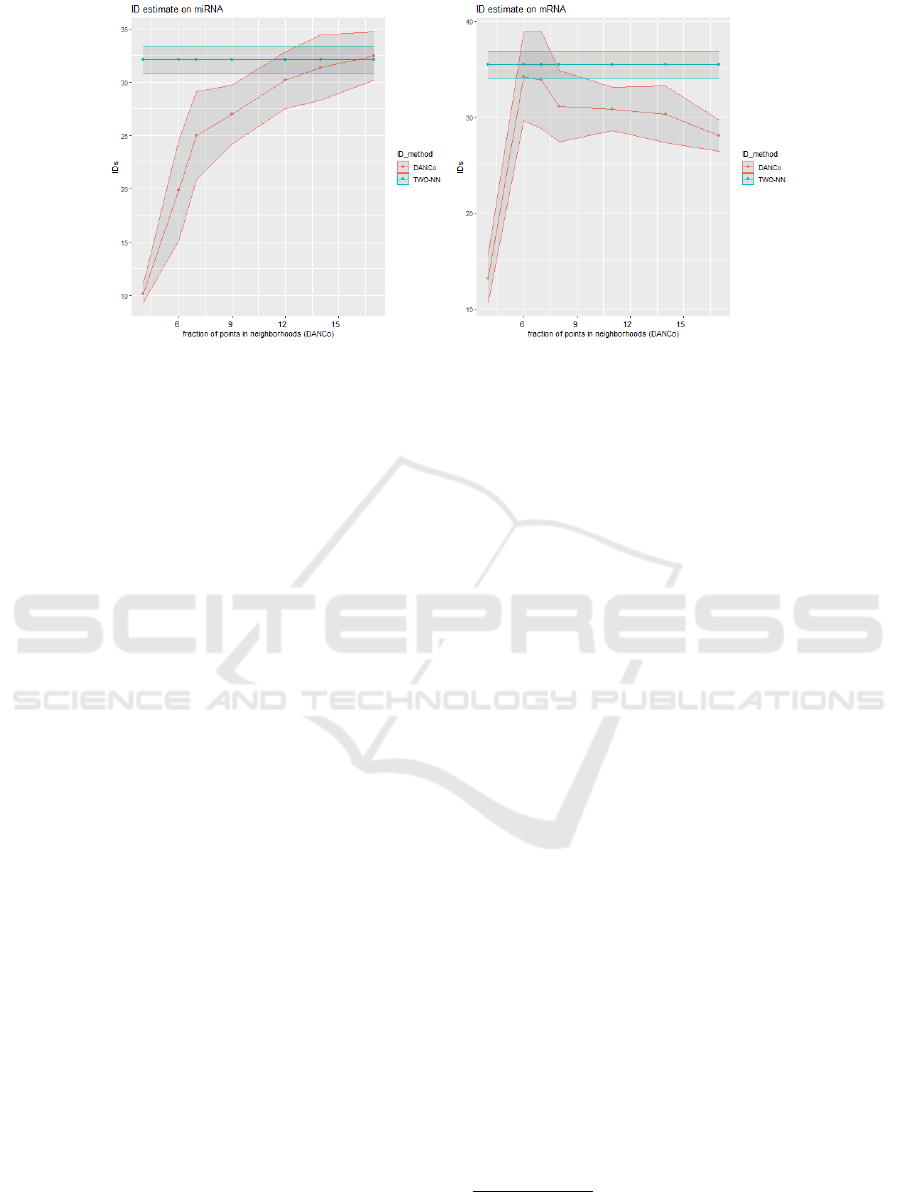
Figure 2: Comparison among IDs computed by DANCo estimator and the TWO-NN estimator. Shaded areas mark the
standard deviation of the ID estimates computed by the two methods. On the miRNA view (left) the chosen neighborhood
size for DANCo is k = 14. On mRNA the chosen neighborhood size for DANCo is k = 6.
2017), often characterizing datasets where the imbal-
ance between dimension and sample cardinality is ex-
tremely large. Considering also the previously docu-
mented (Campadelli et al., 2015) robustness and accu-
racy of DANCo, we chose it for the evaluation of the
ID. However, given the appealing properties of TWO-
NN estimator, we considered it a valid aid to auto-
matically set the best neighborhood size k to be con-
sidered when using the DANCo estimator. In detail,
among all the neighborhood sizes that contain less
than 1/10 of the cases, we choose the value minimiz-
ing the distance between the DANCo and the TWO-
NN estimates.
3.1.3 Blocking-ID Estimate
The dimension of the lower dimensional space where
the data should be projected to avoid the curse of
dimensionality should be defined based on the esti-
mated dataset ID. However, as highlighted also in the
previous sections, several ID estimators produce un-
stable global estimates on sparse and noisy datasets
affected by the curse of dimensionality (Ceruti et al.,
2014; Campadelli et al., 2015; Facco et al., 2017).
This is particularly true for NN estimators, which of-
ten suffer from high variance or overestimation when,
e.g., the considered neighborhood size increases. Fur-
thermore, since all the ID estimators contain some
randomness, most of them suffer from an added fac-
tor of variance, particularly evident when working in
high dimensions.
To account for such variance and obtain more re-
liable estimates a classical blocking method may be
used (Facco et al., 2017). Under the ID estimation set-
ting, the blocking can be applied feature-wise by: (1)
considering randomly sampled feature sets (blocks)
of increasing size; (2) estimating the ID on each
block, and (3) estimating a global blocking-ID (and
its standard deviation) as the mean (and total standard
deviation) of all the block IDs (and their standard de-
viations). In more detail, to compute the blocking-ID
we first define the dimension of the smallest block as
L(0) =
ˆ
d ∗ 2, being
ˆ
d the DANCo ID estimate com-
puted on the input dataset. Though we are aware that
the first ID estimate might be biased, it can be a valid
aid to guarantee that also smaller blocks can contain
enough information. Next, we iterate over the block
dimensions and, at the j
th
iteration, we increase the
considered block dimension to L( j) = L(0) ∗ j and
we estimate a mean ID (and its standard deviation)
for blocks composed of L( j) features by the follow-
ing steps:
1. compose n
try
(random) blocks, each with L( j)
randomly drawn features;
2. estimate the DANCo ID of each random block;
3. compute the mean and the (within) standard devi-
ation of the obtained estimates, which essentially
provide an estimate of the ID that would be ob-
tained if the data was represented by L( j) ran-
domly selected features
4
.
We keep increasing the block dimension and es-
timating each mean block-ID with its within-block
standard-devation for n
blocks
iterations, until the con-
sidered block includes the whole feature-set. An
unbiased blocking-ID for the whole dataset may be
then computed by averaging all the block-IDs com-
puted during each iteration, and by computing the to-
4
We set n
try
= 51 to reduce time costs of the algorithm;
however, the higher the value, the higher the precision of
the estimate.
Intrinsic-Dimension Analysis for Guiding Dimensionality Reduction in Multi-Omics Data
247
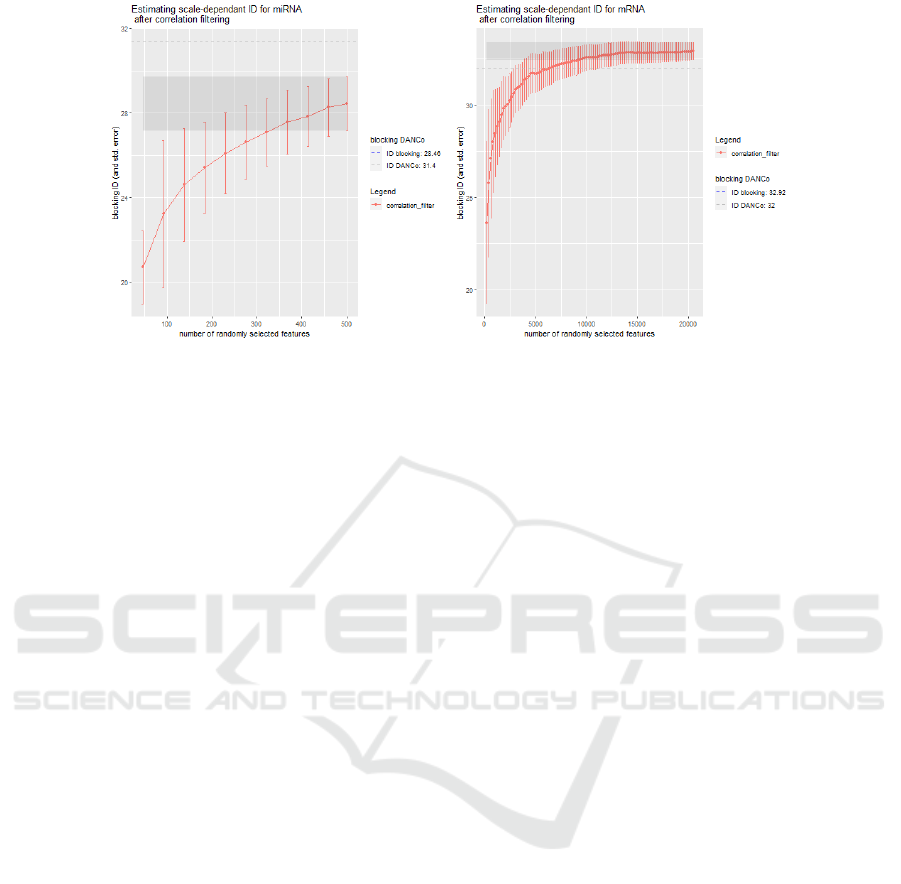
Figure 3: Cumulative mean and total standard deviation of the Block-IDs computed by using the DANCo estimator (left:
miRNA, right: mRNA view). The grey dashed line shows the initial global ID estimate computed by DANCo on the entire
dataset. The shaded area highlights the ID values that are one standard deviation away from the global blocking-ID (cor-
responding to the last point of the cumulative distribution). Observing the shaded area, we note that, for e.g. the miRNA
view, randomly selected feature-blocks with dimensions higher than ≈ 330 obtain ID estimates that are less than one standard
deviation away from the blocking ID estimate. The cumulative mean distribution on mRNA (and its total standard deviation)
confirms that the data may be represented by a much smaller feature set (that the available one) without losing too much
information. Indeed, as we start from the smallest blocks (≈ 200 randomly selected features), the cumulative mean keeps
increasing until the block dimension becomes approximately equal to 9000. At this stage, the feature set contains enough
feature to properly represent the data-structure. Indeed, the block ID remains stable and the total standard deviation at each
point has a small reduction, suggesting that the addition of more features does not improve informativeness.
tal standard deviation to account for both the within
and the between-blocks variance. This value is es-
sentially representing the mean ID estimate (and its
fluctuation) that would be obtained on a dataset com-
posed by randomly sampling a number of features
that is equal to (or lower than) the dimension of the
whole dataset. The idea behind the blocking method
is that, assuming that some features are mostly carry-
ing noise and/or redundant information, the random
under-sampling of features that is performed to com-
pose blocks with varied and increasing dimensions,
as well as the evaluation of the ID for different block
dimensions, is able to reduce (by averaging) biasing
effects due to noise and redundancy. Thus, instead of
limiting our analysis to the global blocking-ID esti-
mate, we compute the cumulative mean of the block-
IDs and the corresponding total standard deviation.
Figure 3 shows the distributions we obtained on the
miRNA and mRNA views in our dataset. The j
th
point in the plot shows the mean (and its total stan-
dard deviation) computed over all the blocks with di-
mension lower or equal to L( j). In practice, for each
block dimension, we obtain an estimate of the ID (and
its variability) that would be obtained if we randomly
selected blocks of dimension equal to L( j). Hence,
the comparison between the final blocking-IDs (the
last point on the cumulative curve) and the cumula-
tive means computed for smaller blocks allows choos-
ing the number of features that should be (even ran-
domly) retained in order to obtain an ID estimate that
is no more than one standard deviation away from
the global blocking-ID estimated. In simpler words,
we automatically analyze the cumulative mean plot to
find the number of features that suffices to represent
the information in the dataset.
This dimension is used as the target dimension for
the FS step described in the following Section 3.2.
3.2 Hierarchical Feature Clustering
Though correlation filtering removes redundancy in
the data, the number of retained features may be still
high, so that any (linear and non-linear) dimension-
ality reduction step would incur in the curse of di-
mensionality. To further reduce data dimensionality,
feature clustering can be an insightful step, which not
only allows exploring the relationships between fea-
tures, but also selects a lower dimensional subspace
composed of representative features that are either
cluster medoids or singletons (that is, features that
do not belong to any cluster). Feature clusters were
composed by an agglomerative hierarchical clustering
method (Cai et al., 2014) named Genie (Gagolewski,
2021). Genie guarantees robustness with respect to
noise and boundary points by computing pairwise-
points distances by the mutual reachability distance
(Campello et al., 2013). It applies a Single Link-
age (SL) criterion (Nielsen, 2016) to merge closer
BIOINFORMATICS 2023 - 14th International Conference on Bioinformatics Models, Methods and Algorithms
248

clusters but provides a strategy to penalize the for-
mation of small clusters. Indeed, at each iteration of
the algorithm, the inequality between the cluster car-
dinalities is evaluated by the Gini index. If the in-
equality is above a certain threshold Genie starts fa-
voring the merge of the smallest clusters with their
NN clusters. In high dimension the computational
costs of Genie becomes impracticable; hence we im-
plemented a distributed-hierarchical algorithm (Ap-
pendix B) using Genie to extract a number of fea-
ture clusters (i.e. the dimension of the reduced space)
equal to the smaller block dimension whose block-
ID estimate is within one standard deviation from the
global block-ID.
3.3 Dimensionality Reduction
The lower-dimensional dataset can now be obtained
by embedding the dataset derived by feature cluster-
ing into a lower-dimensional space whose dimension
is set to be equal to 2· target ID, being target ID
the blocking-ID estimated by DANCo after correla-
tion filtering. In bioinformatics, the method com-
monly used for DR is the Principal Component Anal-
ysis - PCA (Gerbrands, 1981), generally solved in
high-dimensional spaces by its approximated Singu-
lar Value Decomposition - SVD (Gerbrands, 1981).
Both PCA and SVD projections are often ineffec-
tive (Mahmud and Fu, 2019) due to their sensitivity
to noise and outliers. Moreover, the linear projec-
tion of PCA onto a space with dimension much lower
than (or equal to) the sample size causes loss of in-
formation. Finally, the computation of PCA/SVD on
massive datasets may be prohibitive. To avoid all the
aforementioned problems, randomized PCA (RPCA)
exploits the theories of randomness and probabilis-
tic matrix algorithms (Drineas and Mahoney, 2016;
Erichson et al., 2016) to derive a smaller space catch-
ing all the relevant information. Considering that
both PCA and RPCA compute novel dimensions
whose meaning is difficult to interpret (Erichson et al.,
2016), the CUR decomposition (and its more promis-
ing randomized version RCUR) has been proposed
(Mahoney and Drineas, 2009; Halko et al., 2011;
Voronin and Martinsson, 2017) as an interpretable DR
alternative to PCA and RPCA. It factorizes the ini-
tial matrix A ∈ R
n×p
into 3 matrices: C ∈ R
n×k
,U ∈
R
k×k
,R ∈ R
k×p
where C and R are formed by a small
subset of columns and rows from the original dataset,
which are chosen based on their capability of main-
taining the original structure of the dataset. Com-
pletely different DR approaches are UMAP (McInnes
et al., 2018) and t-SNE (Van der Maaten and Hin-
ton, 2008), which find a non-linear embedding into
a lower dimensional space that maintains the original
(local and global) dataset structure, by optimizing a
function that preserves the distances within the data
neighborhoods.
Since RPCA, RCUR, UMAP, and t-SNE have
shown their promise, we compared them for DR.
Among the computed projected views we then se-
lected the one whose DANCo-ID is most similar to
the target ID.
4 PRELIMINARY RESULTS
Table 1: ID estimates (and standard deviations) for the
views in our dataset. Asterisks (*) refer to the blocking-ID
estimate, while the red values refer to the target ID.
View Corr* Clust* DR
miRNA 28.46 28.83 23.73
± 1.27 ± 2.35 ± 1.49 (RCUR)
mRNA 32.92 36.3 30.27
± 0.49 ± 0.55 ± 3.95 (RCUR)
In Table 1 the IDs estimated after all the consecutive
steps of our algorithm are shown, highlighting that,
for both the views, the ID remains approximately sta-
ble
5
. In Figure 4 we show the scatter plots of the
first two components of the different embedded space
computed by the four DR algorithms. For both the
views, RCUR is the DR method that produces an ID
estimation more consistent with the previously com-
puted ID. Indeed, for the miRNA view we have an
agreement with the target ID within ≈ 2 standard de-
viations, while for the mRNA view the final ID esti-
mate is within 1 standard deviation of the target ID,
showing a significant consistency of our pipeline,
even for largely sparse datasets. Remarkably, RCUR
is the only DR method that completely preserves data
interpretability for it finds a reduced space that is a
subset of the original features. While our prelimi-
nary results show the promise of our proposal, fu-
ture works are aimed at its thorough comparison with
SOTA DR approaches, and at the evaluation of dif-
ferent ID-estimation methods within our blocking-ID
5
It’s worth mentioning that the blocking-ID estimate for
mRNA view after clustering, higher than the target one, can
be addressed to the fact that in the hierarchical clustering
step we used the correlation matrix as similarity measure,
and thus dismissing highly similar (i.e. correlated) tran-
scriptomic features, significant from a biological perspec-
tive (Allocco et al., 2004), could slightly increase noise.
However, hierarchical clustering for reducing correlation
bias in mRNA data is an efficient method already proposed
in previous analysis (Park et al., 2007).
Intrinsic-Dimension Analysis for Guiding Dimensionality Reduction in Multi-Omics Data
249
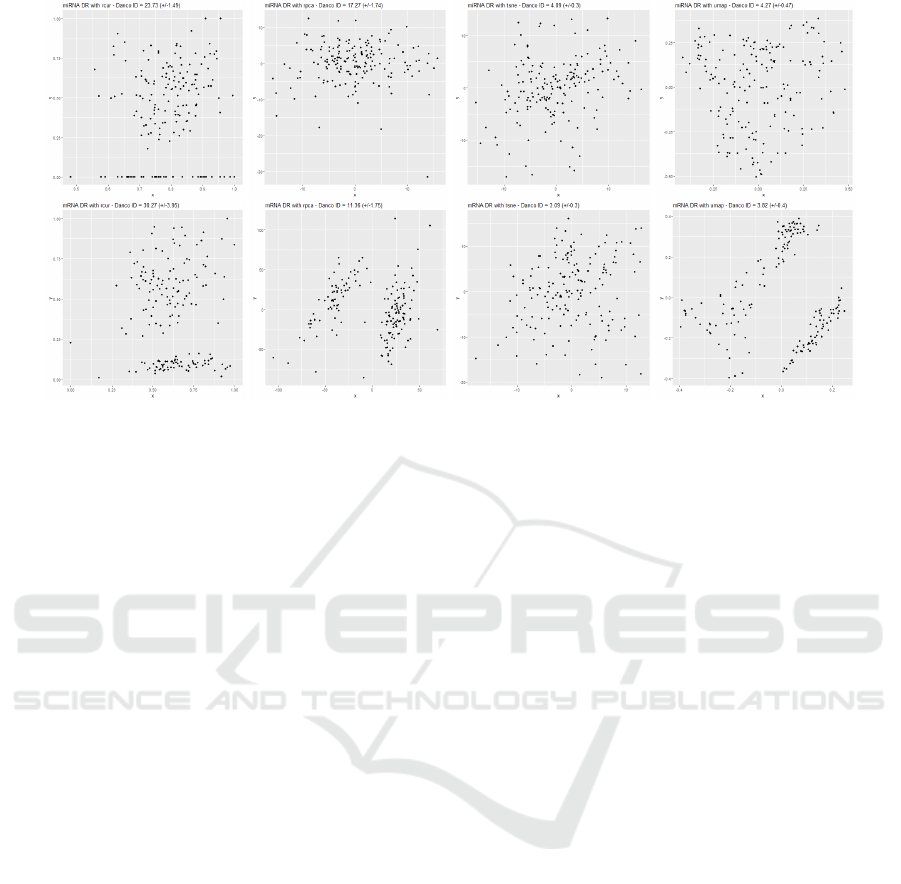
Figure 4: Plot of the first 2 components of miRNA (top) and mRNA (bottom) embedded views. In the case of RCUR these
are two features from the original dataset (therefore for better visualizing the reduced space, a RPCA transformation can be
applied on RCUR reduction).
estimation. The aim is to choose the most performant
ID-estimation approach to produce tractable multi-
views, to be used for patient subtypes identification.
Furthermore, the computational complexity strongly
depends on the blocking-ID step and thus has an es-
timated lower bound of Ω(n
blocks
· n
try
· D
4
· NlogN).
This requires future works to improve code optimiza-
tion and parallelization.
REFERENCES
Allocco, D., Kohane, I., and Butte, A. (2004). Quantifying
the relationship between co-expression, co-regulation
and gene function. BMC bioinformatics, 5:18.
Cai, R., Zhang, Z., Tung, A. K., Dai, C., and Hao, Z. (2014).
A general framework of hierarchical clustering and its
applications. Information Sciences, 272:29–48.
Campadelli, P., Casiraghi, E., Ceruti, C., and Rozza, A.
(2015). Intrinsic dimension estimation: Relevant tech-
niques and a benchmark framework. Mathematical
Problems in Engineering, 2015.
Campello, R. J. G. B., Moulavi, D., and Sander, J. (2013).
Density-based clustering based on hierarchical den-
sity estimates. In Pei, J., Tseng, V. S., Cao, L., Mo-
toda, H., and Xu, G., editors, Advances in Knowledge
Discovery and Data Mining, pages 160–172, Berlin,
Heidelberg. Springer Berlin Heidelberg.
Ceruti, C., Bassis, S., Rozza, A., Lombardi, G., Casiraghi,
E., and Campadelli, P. (2014). Danco: An intrinsic
dimensionality estimator exploiting angle and norm
concentration. Pattern recognition, 47(8):2569–2581.
Drineas, P. and Mahoney, M. W. (2016). Randnla: random-
ized numerical linear algebra. Communications of the
ACM, 59(6):80–90.
Erichson, N. B., Voronin, S., Brunton, S. L., and Kutz, J. N.
(2016). Randomized matrix decompositions using r.
arXiv preprint arXiv:1608.02148.
Facco, E., d’Errico, M., Rodriguez, A., and Laio, A. (2017).
Estimating the intrinsic dimension of datasets by a
minimal neighborhood information. Scientific reports,
7(1):1–8.
Franc¸ois, D., Wertz, V., and Verleysen, M. (2007). The con-
centration of fractional distances. IEEE Transactions
on Knowledge and Data Engineering, 19(7):873–886.
Gagolewski, M. (2021). genieclust: Fast and robust hierar-
chical clustering. SoftwareX, 15:100722.
Gerbrands, J. J. (1981). On the relationships between svd,
klt and pca. Pattern recognition, 14(1-6):375–381.
Gliozzo, J., Mesiti, M., Notaro, M., Petrini, A., Patak, A.,
Puertas-Gallardo, A., Paccanaro, A., Valentini, G.,
and Casiraghi, E. (2022). Heterogeneous data integra-
tion methods for patient similarity networks. Briefings
in Bioinformatics.
Halko, N., Martinsson, P.-G., and Tropp, J. A. (2011).
Finding structure with randomness: Probabilistic al-
gorithms for constructing approximate matrix decom-
positions. SIAM review, 53(2):217–288.
Hughes, G. (1968). On the mean accuracy of statistical pat-
tern recognizers. IEEE transactions on information
theory, 14(1):55–63.
Johnsson, K. (2011). Manifold Dimension Estimation for
Omics Data Analysis: Current Methods and a Novel
Approach. Lund University.
Lv, J. (2013). Impacts of high dimensionality in finite sam-
ples. The Annals of Statistics, 41(4):2236–2262.
Mahmud, M. S. and Fu, X. (2019). Unsupervised classifica-
tion of high-dimension and low-sample data with vari-
ational autoencoder based dimensionality reduction.
In 2019 IEEE 4th International Conference on Ad-
BIOINFORMATICS 2023 - 14th International Conference on Bioinformatics Models, Methods and Algorithms
250

vanced Robotics and Mechatronics (ICARM), pages
498–503. IEEE.
Mahoney, M. W. and Drineas, P. (2009). Cur matrix decom-
positions for improved data analysis. Proceedings of
the National Academy of Sciences, 106(3):697–702.
McInnes, L., Healy, J., and Melville, J. (2018). Umap: Uni-
form manifold approximation and projection for di-
mension reduction. arXiv preprint arXiv:1802.03426.
Meng, C., Zeleznik, O. A., Thallinger, G. G., Kuster, B.,
Gholami, A. M., and Culhane, A. C. (2016). Di-
mension reduction techniques for the integrative anal-
ysis of multi-omics data. Briefings in bioinformatics,
17(4):628–641.
Nanga, S., Bawah, A. T., Acquaye, B. A., Billa, M.-I.,
Baeta, F. D., Odai, N. A., Obeng, S. K., and Nsiah,
A. D. (2021). Review of dimension reduction meth-
ods. Journal of Data Analysis and Information Pro-
cessing, 9(3):189–231.
Nguyen, L. H. and Holmes, S. (2019). Ten quick tips for ef-
fective dimensionality reduction. PLoS computational
biology, 15(6):e1006907.
Nicora, G., Vitali, F., Dagliati, A., Geifman, N., and Bel-
lazzi, R. (2020). Integrated multi-omics analyses in
oncology: a review of machine learning methods and
tools. Frontiers in oncology, 10:1030.
Nielsen, F. (2016). Introduction to HPC with MPI for Data
Science. Undergraduate Topics in Computer Science.
Springer.
Park, M., Hastie, T., and Tibshirani, R. (2007). Averaged
gene expressions for regression. Biostatistics (Oxford,
England), 8:212–27.
S
¨
odergren, A. (2011). On the distribution of angles between
the n shortest vectors in a random lattice. Journal of
the London Mathematical Society, 84(3):749–764.
Solorio-Fern
´
andez, S., Carrasco-Ochoa, J. A., and
Mart
´
ınez-Trinidad, J. F. (2020). A review of unsuper-
vised feature selection methods. Artificial Intelligence
Review, 53(2):907–948.
Trunk, G. V. (1979). A problem of dimensionality: A sim-
ple example. IEEE Transactions on pattern analysis
and machine intelligence, PAMI-1(3):306–307.
Van der Maaten, L. and Hinton, G. (2008). Visualizing data
using t-sne. Journal of machine learning research,
9(11).
Voronin, S. and Martinsson, P.-G. (2017). Efficient al-
gorithms for cur and interpolative matrix decompo-
sitions. Advances in Computational Mathematics,
43(3):495–516.
APPENDIX
A. Pairwise Correlation Analysis
For the computation of pairwise correlations, we pre-
ferred the Spearman correlation coefficient since its
assumption of monotonic relationships between vari-
ables is weaker than Pearson’s requirement of lin-
ear relationships. We considered as highly-correlated
pairs of features with a correlation coefficient > 0.8.
Between correlated variables, we discarded the one
whose mean absolute pairwise-correlation with re-
spect to all the other features is higher. Since the
application of pairwise-correlation filtering is com-
putationally demanding, we implemented a parallel-
distributed algorithm that (1) splits the feature-set into
subsets, (2) filters each subset, (3) recomposes the fil-
tered feature-set, (4) shuffles the remaining features
and reiterates until a maximum number of iterations
has been reached or no high correlation has been re-
moved from any of the feature subsets. This pro-
cedure allows distributing the filtering of the feature
subset into multiple cores.
B. Distributed-Clustering Through Genie
To optimize the feature clustering, we apply a parallel
algorithm to iteratively cluster the feature set until the
space dimension is greater than the desired number
of clusters, C . In more detail, the following steps are
applied.
1. To limit the computational cost of Genie, the
current D-dimensional data X ∈ ℜ
m×D
(being
m the number of cases) is randomly split into
N lower-dimensional subsets subX
i
∈ ℜ
m×d
, i ∈
{
1,. .., N
}
, d = 1000, N = ⌊
D
d
⌋. The subsets are
distributed across multiple cores.
2. On each core, Genie is applied to cluster the fea-
ture space and obtain c clusters and the relative
medoids (c is chosen at the beginning of the al-
gorithm in order to ensure a maximum number of
iterations are applied).
3. The N × c medoids are recollected to recompose
the reduced feature space X ∈ ℜ
m×(N×c)
. If the
new dimension is still (N × c) > C , the process
restarts from step 1 to apply a further reduction.
Intrinsic-Dimension Analysis for Guiding Dimensionality Reduction in Multi-Omics Data
251
