
Correlating EEG Signals and Electrode Locations by Means of
Multidimensional Scaling
Luc
´
ıa Rodr
´
ıguez-Giraldo and Juan P. Ugarte
a
Grupo de Investigaci
´
on en Modelamiento y Simulaci
´
on Computacional - GIMSC, Universidad de San Buenaventura,
Keywords:
Multichannel EEG, Dimensional Reduction, Procrustes Algorithm.
Abstract:
The adoption of physiological data, such as electroencephalograms (EEG), is undergoing a growing interest in
addressing the characterization of human emotions. However, the setup of recording electrodes that allows a
proper study of emotions remains to be determined. This work proposes a method for processing multichannel
EEG signals by means of multidimensional scaling (MDS), looking for patterns related to the electrodes spatial
setup. We analyze the SEED-IV database consisting of 1080 trials, each one having 62 simultaneous EEG
recorded during four different emotions induction. A low dimensional representation of each set of 62 EEG
signals is obtained through the MDS algorithm. The resulting MDS maps evinced a pattern of points that
is correlated with the recording electrodes sites in 68% of the trials from SEED-IV database. Among these
trials, those recorded during the neutral emotion induction are slightly prevalent than the remaining emotions.
Furthermore, it was determined that the electrodes spatial distribution can be successfully recovered through
the MDS analysis with an EEG minimum duration of 45 s. These results suggest that the proposed analysis
based on the MDS algorithm shed some light upon the information content of simultaneous EEG signals and
its correlation with the underlying cerebral structures.
1 INTRODUCTION
Emotions are biological states that are reflected in
neuropsychological changes and affect human behav-
ior. Distinct mental illnesses and neuropsychiatric
disorders, such as depression and autism, are related
to emotional states (Jia et al., 2020).
The adoption of physiological electroencephalo-
grams (EEG) has recently received special attention
for tackling the study of emotions. The EEG sig-
nals represent the dynamics of voltage potential, orig-
inated from the electrical activity of neurons. Cur-
rent technology enables the simultaneous recording
of multiple EEG by deploying a set of electrodes on
the scalp with high temporal resolution (Doma and
Pirouz, 2020). The spatial distribution of the record-
ing sites obeys to correlations with underlying cere-
bral structures. Accordingly, electrodes placement
is defined by standards, such as the 10-20 or 10-10
systems, looking for consistency across multicentric
experiments. The resulting spatial resolution can be
defined in terms of the number of electrodes of the
recording setup. In the case of emotions assessment,
a
https://orcid.org/0000-0001-8008-3528
establishing the EEG recording sites that provide rel-
evant information remains as an open question. In
addition, the number of electrodes used for effec-
tive characterization of human emotions varies among
studies. A recent review article found that, in the last
12 years, more than the 60% of the reviewed papers
processed 32 or more simultaneous EEG signals, al-
though the trend aims to reduce the number of record-
ing electrodes (Rahman et al., 2021). On this regard,
traditional EEG processing schemes secure a fixed set
of recording sites for all assessed subjects. However,
the complexity of the human brain behavior and in-
ter subject variability often leads to variations in the
subset of electrodes that provide useful information
(Gannouni et al., 2021; Ozel and Akan, 2021). For
instance, an initial step for addressing this problem
would be evaluating the correlation of the recorded
EEG and the underlying brain region.
Bearing these ideas in mind, this paper proposes
a strategy for processing multichannel EEG signals
by means of multidimensional scaling (MDS). The
MDS algorithm reduces the dimensionality of a set
of objects by preserving the distances between pair of
objects. Thus, the MDS analysis is used to obtain a
Rodríguez-Giraldo, L. and Ugarte, J.
Correlating EEG Signals and Electrode Locations by Means of Multidimensional Scaling.
DOI: 10.5220/0011750200003414
In Proceedings of the 16th International Joint Conference on Biomedical Engineering Systems and Technologies (BIOSTEC 2023) - Volume 4: BIOSIGNALS, pages 309-316
ISBN: 978-989-758-631-6; ISSN: 2184-4305
Copyright
c
2023 by SCITEPRESS – Science and Technology Publications, Lda. Under CC license (CC BY-NC-ND 4.0)
309

low dimensionally representation of the set of simul-
taneously recorded EEG signals. For this purpose, the
SEED-IV database of multichannel EEG signals cap-
tured during emotions induction is used. The MDS
maps are analyzed looking for patterns related to the
electrodes spatial setup. In this line of thought, this
paper is organized as follows. Section 2 describes the
SEED-IV database, the preprocessing stage and the
mathematical tools. Section 3 presents and discusses
the MDS results. Finally, the conclusions of the work
are summarized in section 4.
2 METHODOLOGY
2.1 SEED-IV Database
The SEED-IV (Zheng et al., 2019) is a subset of the
SEED database that includes EEG signals from a to-
tal of 15 healthy, right-handed participants, aged 20
to 24 years. The signals were recorded during a trial
where a subject watched a film clip with high emo-
tional content. The clips were chosen in order to ob-
tain 4 target emotion categories: happy, sad, fear and
neutral emotions. A total of 72 film clips were split
into 3 different sessions. Each session consisted of 24
trials (6 per emotion) and each session was performed
on a different day. Each subject was evaluated in all 3
sessions and a total of 1080 recordings were obtained.
The ESI NeuroScan system was used to capture sig-
nals from 62 channels. The raw EEG data signals in
the database have a sampling frequency of 200 Hz and
varying recording duration. The database characteris-
tics are shown in Table 1.
Table 1: Characteristics of SEED-IV dataset.
No. of participants 15
Gender Female (8), Male (7)
Age range 20 - 24 years
Device ESI NeuroScan system
Sample rate 200 Hz
Acquisition method
International 10-10 system,
62 channels
Target emotions Happy, sad, fear and neutral
No. of sessions 3
No. of trials per session 24
No. of trials per emotion 270
No. of records 1080
Signals duration range 43 - 260 s
The 62 simultaneously recorded channels are spa-
tially arranged according to the international 10-10
system as depicted in Figure 1. The lobes underly-
ing the electrodes are FP (Frontopolar), AF (Anterior
Frontal), F (Frontal), FC (Frontal Central), C (Cen-
tral), CP (Central Parietal), P (Parietal), PO (Parietal
Occipital), O (Occipital), T (Temporal) and Z (Mid-
line). Odd and even numbers refer to the left and right
hemisphere, respectively. A color code was defined to
distinguish between recording electrodes by the un-
derlying lobes, namely, {FP+AF, F, FC, C, CP, P, PO,
CB+O, FT+T+TP, midline}.
!
"
#
#
"
$
%
&
'
!
(# ( (" ($ )%)& (' (! (
*
(+
*#
*
(+
(#
)%
($
("
(
(
(!
('
)&
(#
#
*#
(
)%
)&
($
("
(
(!
('
%
"
$
!
'
&
*"
*%
*$
*!
*'
*&
Figure 1: Electrode placement according to international
10-10 system.
2.2 Preprocessing and Mathematical
Tools
Let x
′
i,c
[n] be a discrete EEG raw signal, where
i = 1, . . . ,1080 corresponds to the i-th trial of the
database, c = 1, . . . , 62 represents the c-th channel per
trial and n = 1, . . . , N stands for the discrete samples
of the signal x
′
i,c
. The raw EEG data are normalized
using the following equation:
x
i,c
[n] =
x
′
i,c
[n] − µ
i,c
σ
i,c
, (1)
where x
i,c
[n] is the normalized signal, µ
i,c
and σ
i,c
are
the arithmetic mean and standard deviation of x
i,c
[n],
respectively. The i-th trial can be represented by a
62 × N dimensional matrix, where N is the number of
samples of x
i,c
.
2.2.1 Multidimensional Scaling (MDS)
The MDS technique is used as an exploratory data
analysis by mapping objects from a high dimensional
space, in this case, signals, into a low dimensional
space while preserving the distances between all pairs
of objects (Torgerson, 1952). The MDS algorithm
estimates the coordinates of a M-dimensional space
so that, the distances between pair of objects remain
equal to those distances measured at a N-dimensional
space, where M < N. Thus, for the i-th trial, a 62-
square symmetric matrix D
pq
, p, q ∈ {1, 2, ..., 62}
BIOSIGNALS 2023 - 16th International Conference on Bio-inspired Systems and Signal Processing
310

is calculated, whose elements correspond to the dis-
tances between x
i,p
and x
i,q
. The matrix D
pq
is used
as input to the stress function S (Xu et al., 2004), de-
fined as follows:
S =
v
u
u
u
u
u
u
t
∑
pq
ˆ
D
pq
− D
pq
2
∑
pq
ˆ
D
pq
4
, p ̸= q , (2)
where
ˆ
D
pq
are the predicted Euclidean distances
between the pair of low dimensional objects ˆx
i,p
[m]
and ˆx
i,q
[m], m = 1, . . . , M. The coordinates of ˆx
i,c
[m]
are estimated so that S is minimized. Here, M = 2 or
M = 3 can be used in order to visualize the data in
two- or three-dimensional charts.
In this work, D
pq
corresponds to the Jaccard
distance (Cha, 2007) defined by the following
expression:
D
pq
=
N
∑
n=1
(x
i,p
[n] − x
i,q
[n])
2
N
∑
n=1
x
i,p
[n]
2
+
N
∑
n=1
x
i,q
[n]
2
−
N
∑
n=1
x
i,p
[n]x
i,q
[n]
.
(3)
The MDS analysis allows visualizing the EEG record-
ings captured during a single trial through two or
three-dimensional maps. The interpretation of such
charts is based on the emerging patterns determined
by the relative distance between points.
2.2.2 Procrustes Method
The Procrustes method adjusts an object, defined by a
set of Cartesian coordinates, to a reference object by
applying linear transformations, such as rotation, re-
flection, translation and scaling (Kendall, 1989). The
Procrustes distance d ∈ [0, 1] is a measure of dissimi-
larity between the adjusted objects by quantifying the
degree of fit. This method is useful for finding pat-
terns in a group of objects that have similar d (Warheit
et al., 1992).
3 RESULTS AND DISCUSSION
The signal x
i,c
[n] corresponding to the trials i =
1, . . . , 1080 are processed by the MDS technique us-
ing the Jaccard distance D
pq
to generate the distance
matrix D
pq
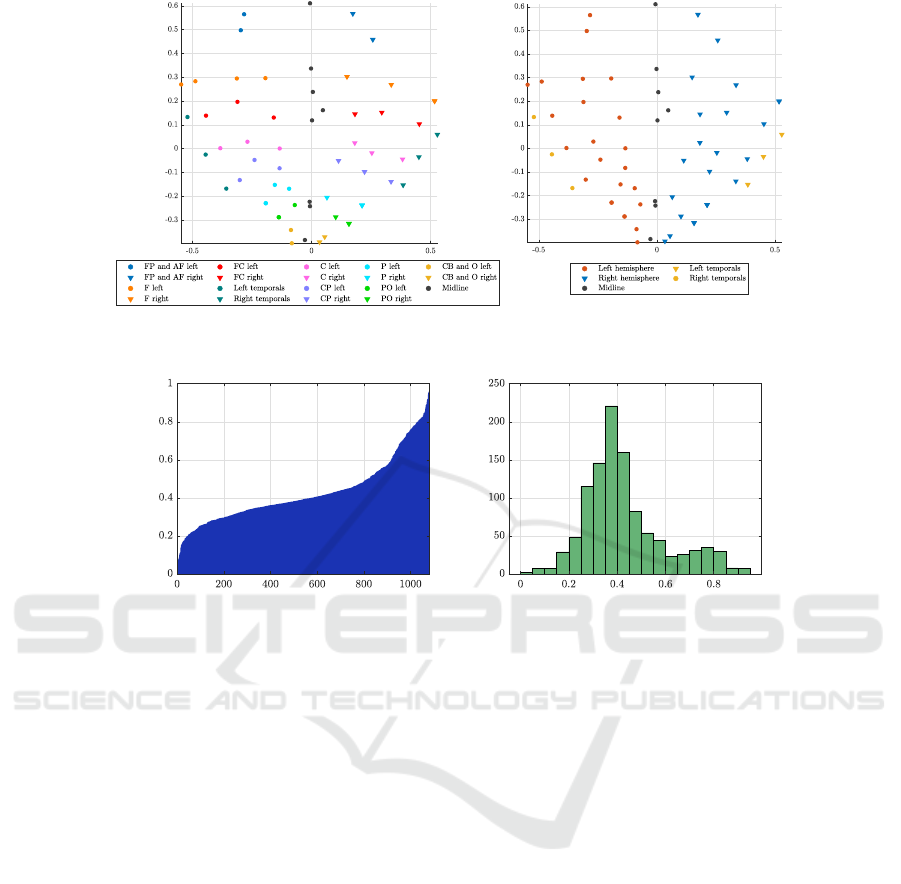
. Figure 2 shows the MDS map corre-
sponding to a representative trial. Each point stands
for a low dimensional depiction of a single-channel
EEG recording. In Figure 2A, colors were assigned
to each point following the color code presented in
Figure 1. It can be verified that the points distribu-
tion agrees with the electrodes placement. Figure 2B
depicts the same set of points from Figure 2A but, in
this case, different colors distinguish the brain hemi-
spheres and the midline. Since neighboring channels
record activity from a common brain region, the cor-
responding EEG signals have high similarities (i.e.,
low values of D
pq
) at a global level. Still, the magni-
tude of D
pq
of neighboring signals is high enough to
keep dissimilarities at a local level.
The rest of the trials are processed using the
MDS analysis and then superimposed through the
Procrustes algorithm. The quality of the Procrustes
result can be assessed by means of the Procrustes dis-
tance d. The low the value of d, the better the align-
ment between the sets of points. Figure 3 shows the
values of d sorted in increasing order and the cor-
responding histogram chart. It can be verified that
approximately 80% of the trials result in values of
d < 0.5, which indicates that a significant portion of
trials generates an MDS pattern that agrees with the
electrodes spatial distribution. However, it was ob-
served that the range 0.45 < d < 0.5 corresponds to
MDS maps, where some electrodes, such as temporal
and midline electrodes, have a significant deviation
from their true spatial location. Thus, the criterion
C
1
: d ≤ 0.45 is adopted as a proper Procrustes out-
come.
Figure 4A shows the Procrustes superimposed tri-
als of the first session that meet the C
1
criterion.
The chart allows identifying clusters composed by
electrode locations that capture information from the
same brain lobe in each hemisphere. Moreover, Fig-
ure 4B evinces that the hemispheres are separated by a
dividing line composed by the midline electrodes. On
the other hand, Figures 4C and 4D depict the charts of
the trials that do not meet C
1
(i.e., d > 0.45), in which,
the patterns of electrodes placement and hemispheres
and midline are lost. Figure 5 illustrates the MDS
maps from a representative trial from the set having
d > 0.45. It is evident that the resulting patterns do
not match the spatial distribution of electrodes, nor
the hemispheres and midline. Additional numerical
experiments on the trials not meeting C
1
using differ-
ent distances, evinced no correlations between the re-
sulting MDS loci and the electrodes placement. From
Figure 4B, it is noteworthy that, the clusters represent-
ing the left and right hemispheres (denoted by colors
orange and blue, respectively) are intermingled with
points from the opposite hemisphere. A second cri-
terion, C
2
, is deviced with the purpose of filtering the
trials that generate such artifact. The centroids of the
clusters, related to the temporal lobes, are calculated
Correlating EEG Signals and Electrode Locations by Means of Multidimensional Scaling
311
A
B
Figure 2: MDS maps of a representative trial. The charts A and B use different colors for distinguishing among electrodes
placement and left and right hemispheres, respectively.
A
B
Figure 3: A. Procrustes distance d vs Trials of all dataset, sorted in increasing order. B. Histogram of Procrustes distance d
for the entire dataset.
using the k-means algorithm. The clusters of the tem-
poral lobes are set as the reference since their record-
ing positions are far from the midline. The two re-
sulting centroids are considered representatives of the
left and right hemispheres. The trials having inter-
mingled hemispheres have at least one point whose
distance to the centroid of the belonging hemisphere
is larger than the distance to the other centroid. Such
trials are discarded.
Figures 6A and 6B portray the superimposed
MDS maps applying the C
2
criterion. Figures 6C and
6D depict the trials filtered by C
2
. Both criteria are
applied to the data from the two remaining sessions,
obtaining similar MDS maps to those described for
session 1. For the sake of parsimony, these maps are
not included.
Figure 7A, left and middle, depicts the super-
imposed MDS maps of the full database by means
of Procrustes and then processed through the filter-
ing criteria C
1
and C
2
. It can be observed that the
electrodes spatial distribution agrees with the MDS
emerging clusters. Figure 7A right, shows the MDS
maps by adopting a color code that corresponds
to the sets {FP+AF, F+FC, C+CP, P+PO, O+CB,
midline,temporals}. One can observe that the clus-
ters agree with the spatial distribution of the 10-20
electrode placing system.
The charts shown in Figure 7B enclose the trials
filtered by the C
2
criterion. Despite this, the clus-
ter patterning that agrees with the electrodes spatial
distribution and hemispheres is discernible. Figure
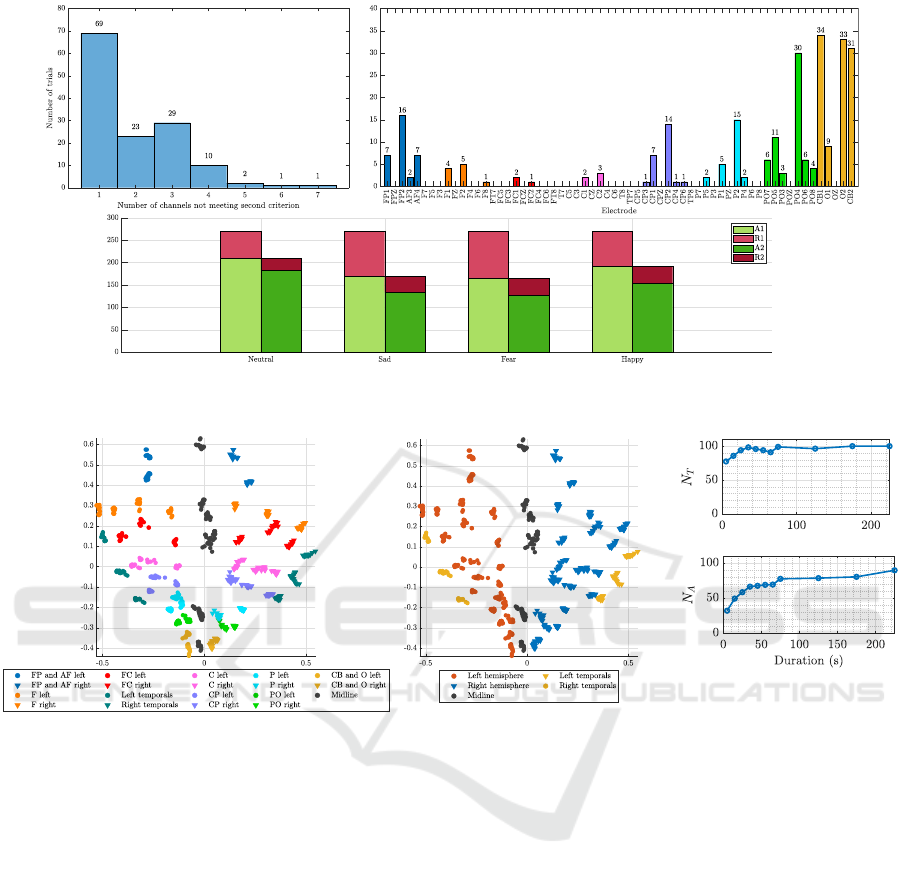
8A illustrates the histogram of the number of chan-
nels per trial filtered by the C
2
criterion among the
entire database. From a total of 135 discarded trials,
51% (69 trials) contains a single channel identified by
C
2
, whereas ≈ 90% (121 trials) contains between 1
and 3 channels identified by C
2
. Additionally, Fig-
ure 8B shows the recurrence of channels detected by
C
2
. It can be seen that parietal occipital and occipital
channels are the most recurrent, whereas the frontal,
frontal central and central electrodes are the less re-
current in failing the C
2
criterion. The remaining
channels present an intermediate low degree of recur-
rence. These results suggest that criterion C
2
is able
to identify EEG signals whose MDS mapping does
not match with the underlying recording site. How-
ever, such mismatch does not imply that the spatial
pattern of the remaining signals is not correlated with
the corresponding recording sites, as one can observe
in Figure 7B. This behavior may be related to spe-
cific conditions of the corresponding recording sites.
For example, the electrodes positions CB1 and CB2,
BIOSIGNALS 2023 - 16th International Conference on Bio-inspired Systems and Signal Processing
312
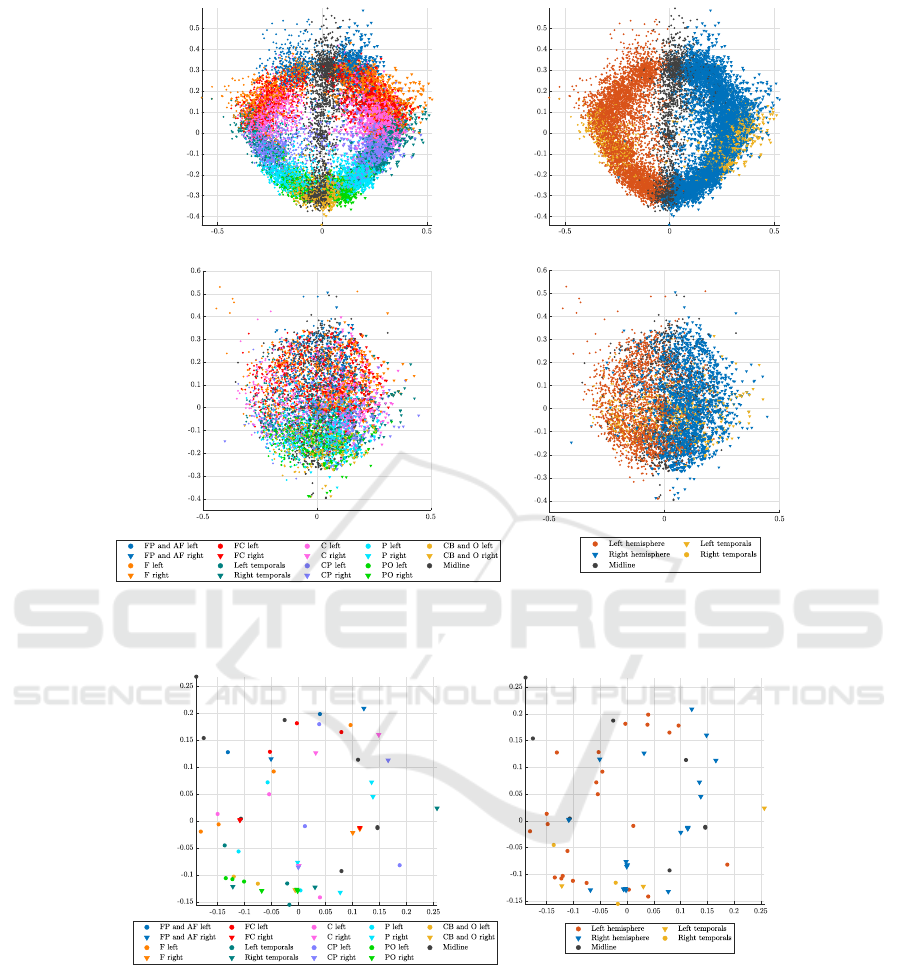
A B
C
D
Figure 4: Procrustes superimposed MDS maps corresponding to all trials of session 1 from the SEED-IV database. The charts
A and B depict the maps that met the C
1
criterion. The charts C and D show the maps filtered by C
1
. Different colors are used
for distinguishing among electrodes placement and left and right hemispheres.
A
B
Figure 5: MDS maps of a representative trial from the set having d > 0.45. The charts A and B use different colors for
distinguishing among electrodes placement and left and right hemispheres, respectively.
which are among the most recurrent channels accord-
ing to Figure 8B, are usually discarded in EEG studies
due to the brain’s electrical activity is not accurately
reflected. On the other hand, criterion C
1
is sensitive
to the trials not preserving the electrodes placement
patterns. Thus, C
1
provides a global assessment of the
MDS map quality, whereas C
2
evaluates local spatial
behavior. Figure 8C summarizes the results of apply-
ing the criteria C
1
and C
2
. Neutral emotion has the
lowest number of trials (22.6%) filtered by C
1
. Re-
garding the C
2
criterion, the number of filtered trials
is similar for all 4 emotions, emphasizing that, neu-
tral emotion again has the lowest number of trials dis-
carded.
As a complementary experiment, the effect of the
EEG signals duration on the MDS outcome is as-
sessed. First, the EEG recordings of the trial used as
the Procrustes reference are analyzed. These signals
Correlating EEG Signals and Electrode Locations by Means of Multidimensional Scaling
313
A B
C
D
Figure 6: Procrustes superimposed MDS maps corresponding to all trials of session 1 from the SEED-IV database. The charts
A and B depict the maps that met the C
2
criterion. The charts C and D show the maps filtered by C
2
. Different colors are used
for distinguishing among electrodes placement and left and right hemispheres.
A
B
Figure 7: Procrustes superimposed MDS maps corresponding to all trials of the SEED-IV database. The chart A depicts
the maps that met the C
1
and C
2
criteria. The chart C shows the maps filtered by C
1
and C
2
. Different colors are used for
distinguishing among electrodes placement, left and right hemispheres, and brain regions.
have a duration of 177 s, which is a value close to the
mode of signals durations of the entire dataset. Sev-
eral numerical tests evinced that the duration of the
EEG signals can be reduced up to 45 s without affect-
ing the MDS outcome. This result can be seen in Fig-
ures 9A and 9B, in which, the MDS maps obtained
BIOSIGNALS 2023 - 16th International Conference on Bio-inspired Systems and Signal Processing
314
A
B
C
Figure 8: A. Histogram of the number of channels per trial filtered by C
2
criterion. B. Number of points per channel not
meeting C
2
criterion. C. Number of trials filtered and not filtered by C
1
and C
2
criteria according to the evoked emotions.
A
B
C
D
Figure 9: Charts A and B depict the MDS maps of the trial used as the Procrustes reference with a sample reduction from
177 s to 45 s. Different colors distinguish among electrodes placement (A) and left and right hemispheres (B). In chart C, N
T
represents the percentage of trials not filtered by C
1
after each duration reduction with respect to the case with no reduction.
In chart D, N
A
represents the percentage of trials not filtered by C
1
and C
2
after each duration reduction with respect to the
case with no reduction.
from signals with durations of 45, 55, 65, . . . , 175s,
are superimposed by means of Procrustes. One can
observe a good alignment of the individual MDS
maps, which supports the robustness of the proposed
method to variations in the durations of the EEG
recordings.
The signals duration reduction was performed on
the entire database. Since the recording duration of
the database is not uniform, the trials were sorted ac-
cording to their duration from largest (≈ 275 s) to
shortest (≈ 40 s). The test values are from 225 s to
75 s in reducing steps of 50 s, and from 75 s to 5s
in reducing steps of 10 s. Each duration test value is
applied to all trials that have a correspondingly larger
duration and, thus, can be reduced to such duration.
We use the number of trials resulting from filtering
criteria C
1
and C
2
as a figure-of-merit. Figure 9C de-
picts the percentage of trials not filtered by C
1
after
each duration reduction with respect to the case with
no reduction (N
T
). It can be seen that the EEG dura-
tion can be reduced up to 45 s without affecting the
MDS outcome regarding the C
1
criterion. Similarly,
Figure 9D shows the scenario after applying C
1
and
C
2
in which the shorter duration without affecting the
MDS outcome is 65 s. According to Figure 8B, the
most recurrent channels being detected by the C
2
cri-
terion are located near the midline (i.e., PO4, CB1,
CB2, O2). Thus, it is expected that variations of the
duration of the corresponding EEG recordings gener-
ate displacements of its representation in the MDS lo-
cus (as it can be observed in Figure 9). Therefore, the
MDS outcome is less robust to EEG duration reduc-
tions when assessing the criterion C
2
(up to ≈ 65 s),
compared with criterion C
1
(up to ≈ 45 s). However,
Correlating EEG Signals and Electrode Locations by Means of Multidimensional Scaling
315

such differences are not significant if we consider that
the trials not meeting the C
2
criterion present a clus-
tering behavior that is correlated with the electrodes
placement. Moreover, the fact of a better robustness
of the MDS outcome against signals reduction when
assessing the C
1
criterion, confirms the effectiveness
of the proposed method in establishing correlations
between the EEG recordings and the electrodes spa-
tial distribution.
4 CONCLUSIONS
In this work, the raw multichannel EEG recordings
from the SEED-IV database were analyzed using the
MDS technique combined with the Procrustes algo-
rithm. To the best of our knowledge, this is the first
work establishing a direct link between EEG record-
ings and recording electrodes position.
Regarding multichannel EEG studies, an issue
that remains unsolved is related to determining the
number of electrodes and the recording sites that pro-
vides relevant information on emotions. It is a com-
mon practice defining a fixed set of electrodes sites
on the scalp for studying a given population. Re-
cent investigations pose a subject-specific setup of
EEG recording sites (Gannouni et al., 2021; Ozel
and Akan, 2021). Our results suggest that the EEG
time series from most of the SEED-IV trials con-
tain information of their underlying recording locus,
so that the electrodes spatial distribution can be re-
covered. This outcome may support the importance
of defining a set of EEG recording sites specific to
each subject. Moreover, the proposed methodology
sheds some light upon the information content of si-
multaneous EEG signals and its correlation with the
underlying cerebral structures. We did not focus on
the 32% trials of the database from which the elec-
trodes position cannot be recovered by means of the
MDS analysis. Our next research work will aim to
unveil the causes and implications of such outcome.
Although we did not observe a clear correlation be-
tween proper Procrustes alignment and evoked emo-
tions, the recordings obtained during neutral emotion
induction show a slightly superior alignment capacity
with regard to remaining emotions. Further studies
are needed to assess the significance of such differ-
entiated behavior. Additionally, we analyzed multiple
EEG recordings corresponding to 15 subjects (72 tri-
als per subject), which may generate a self-bias due to
similar cognitive patterns of the same subject. There-
fore, the proposed methodology requires further vali-
dation with a larger population.
REFERENCES
Cha, S.-H. (2007). Comprehensive survey on dis-
tance/similarity measures between probability density
functions. City, 1(2):1.
Doma, V. and Pirouz, M. (2020). A comparative analysis
of machine learning methods for emotion recognition
using EEG and peripheral physiological signals. Jour-
nal of Big Data, 7(1):1–21.
Gannouni, S., Aledaily, A., Belwafi, K., and Aboalsamh, H.
(2021). Emotion detection using electroencephalogra-
phy signals and a zero-time windowing-based epoch
estimation and relevant electrode identification. Sci
Rep, 11(1):7071.
Jia, Z., Lin, Y., Cai, X., Chen, H., Gou, H., and Wang, J.
(2020). SST-EmotionNet: Spatial-Spectral-Temporal
based Attention 3D Dense Network for EEG Emotion
Recognition. In MM 2020 - Proceedings of the 28th
ACM International Conference on Multimedia, pages
2909–2917. Association for Computing Machinery,
Inc.
Kendall, D. G. (1989). A Survey of the Statistical The-
ory of Shape. https://doi.org/10.1214/ss/1177012582,
4(2):87–99.
Ozel, P. and Akan, A. (2021). Channel contributions of
eeg in emotion modelling based on multivariate adap-
tive orthogonal signal decomposition. IETE Journal
of Research, 0(0):1–12.
Rahman, M. M., Sarkar, A. K., Hossain, M. A., Hossain,
M. S., Islam, M. R., Hossain, M. B., Quinn, J. M., and
Moni, M. A. (2021). Recognition of human emotions
using eeg signals: A review. Computers in Biology
and Medicine, 136:104696.
Torgerson, W. S. (1952). Multidimensional scaling: I. The-
ory and method. Psychometrika, 17(4):401–419.
Warheit, K. I., Rohlf, F. J., and Bookstein, F. L. (1992). Pro-
ceedings of the Michigan Morphometrics Workshop.
Systematic Biology, 41(3):392.
Xu, B., Kajimoto, H., Konyo, M., Saga, S., and Hatzfeld
(2004). Perceptual scaling of the gloss of a one-
dimensional series of painted black samples. Textile
Chemist & Colorist, 29(3):1–18.
Zheng, W. L., Liu, W., Lu, Y., Lu, B. L., and Cichocki, A.
(2019). EmotionMeter: A Multimodal Framework for
Recognizing Human Emotions. IEEE Transactions on
Cybernetics, 49(3):1110–1122.
BIOSIGNALS 2023 - 16th International Conference on Bio-inspired Systems and Signal Processing
316
