
Simulating the Effects of Melanin and Air Gap Depth on the
Accuracy of Reflectance Pulse Oximeters
Miodrag Bolic
a
School of Electrical Engineering and Computer Science, University of Ottawa, 800 King Edward Avenue, Ottawa, Canada
Keywords: PPG, Skin Pigmentation, Skin Color, Melanin, Racial Bias, Motion Artifacts, Monte Carlo Simulation,
Oxygen Saturation, Reflectance Pulse Oximeter.
Abstract: The work aims to understand the effects of skin color and air gap depth on the accuracy of oxygen saturation
estimation. In this paper, this is done by simulating light propagation through the tissue. It is very important
to understand light propagation through the tissue when designing a reflectance pulse oximeter to know what
tissue layers are illuminated by the LEDs, how to position the emitter and the detector depending on the
measurement site, and what kind of signal is expected at the photodetector. This knowledge could also
contribute to developing robust pulse oximeters whose accuracy does not depend on a subject’s skin color.
Our simulation results confirm a larger variation of SpO
2
for lower saturation levels for dark-skinned subjects
if the SpO
2
calibration curve is mainly obtained based on measurements from light-skinned subjects. Also, if
the device is calibrated with a small air gap, increasing the air gap will result in overestimated SpO
2
.
1 INTRODUCTION
The major difficulty when using pulse oximeter
devices is motion artifacts. Besides motion artifacts,
pulse oximeters are inaccurate in poorly oxygenated
patients (Webster, 1997). This is because there is a
lack of data for fitting the parameters of the models
used in pulse oximeters for patients whose oxygen
saturation levels are below 70%. A similar lack of
data for calibrating the SpO
2
curve has been noticed
for darker-skinned individuals, which might suggest
the existence of racial bias. There has been significant
interest in racial bias in pulse oximetry. A recent
review analyzed the influence of skin pigmentation
on the accuracy of pulse oximeters (Fuentes-
Guajardo, 2022). It was pointed out that there is
growing evidence that pulse oximeters are less
accurate in dark-skinned individuals at oxygen
saturation levels lower than 80%, resulting in
overestimations of the oxygen saturation.
Development of tools for simulating light
propagation through non-homogeneous tissues based
on Monte-Carlo methods allowed for computational
approaches in analyzing the effects of different
parameters and skin properties on the distribution of
light in the tissue. One of the first works analyzing
a
https://orcid.org/0000-0002-8013-8645
light propagation through homogeneous and non-
homogeneous tissue is (Tuchin, 1997). More recent
works include (Reuss, 2004), (Reuss, 2005) and
(Chatterjee, 2017).
In this paper, we address issues of estimating
oxygen saturation levels in reflectance pulse
oximeters for people of different skin colors and, in
the case of the different distances between the probe
and the tissue, using a model-based design. We
simulate light propagation through the tissue using
Monte Carlo simulation-based library called
MCMatlab (Marti, 2018).
The pulse oximeter probe contains LEDs and a
photodetector placed on the same side of the tissue so
that the pulse oximeter operates in the reflectance
mode. LEDs with 660 nm and 940 nm wavelengths
were used. Six layers of skin with different optical
properties were simulated. In addition, we added an
air gap between the skin and the simulated probe. The
light from the LED gets scattered through the tissues,
and the photodetector collects only a small percentage
of it. We simulated different blood volumes during
the systolic and diastolic instants of the cardiac cycle,
as well as different oxygen saturation levels of blood.
All these parameters affect the percentage of light
collected by the photodetector. After obtaining the
64
Bolic, M.
Simulating the Effects of Melanin and Air Gap Depth on the Accuracy of Reflectance Pulse Oximeters.
DOI: 10.5220/0011749300003414
In Proceedings of the 16th International Joint Conference on Biomedical Engineering Systems and Technologies (BIOSTEC 2023) - Volume 1: BIODEVICES, pages 64-71
ISBN: 978-989-758-631-6; ISSN: 2184-4305
Copyright
c
2023 by SCITEPRESS – Science and Technology Publications, Lda. Under CC license (CC BY-NC-ND 4.0)

fraction of illuminated light from the photodetector
for the light at 660 nm and 940 nm, we computed the
ratio of the fractions of illuminated light (called the
ratio of ratios) and used it to estimate the oxygen
saturation SpO
2
(Bolic, 2023).
We were especially interested in:
• Analyzing the effects of different levels of
melanin on estimated SpO
2
,
• Analyzing the effect of changing the air gap
depth on estimated SpO
2
.
The analysis showed the following results:
• For a given setup, the slope of estimated SpO
2
vs.
the ratio of ratios curve differs for different
melanin levels. This might explain why there is a
bias in estimating oxygen saturation in darker
skin individuals.
• Changing the air gap causes large changes in the
ratio of ratios which then results in inaccurate
SpO
2
estimates.
Besides the Introduction, the paper contains four
additional sections. Section 2 provides an overview
of the state-of-the-art. Section 3 describes the
simulation setup. Section 4 presents the results.
Finally, the discussion of the results, conclusion, and
future directions are presented in Section 5.
2 BACKGROUND
In this section, we will review the state-of-the-art
from several points of view, including racial bias in
pulse oximetry, simulation of light propagation
through the tissue, and simulation of the effects of
skin pigmentation and motion artifacts on pulse
oximetry.
The existence of melanin in the skin significantly
increases the absorption of light and reduces the
fraction of illuminated light received at the detector.
The absorbance of 660 nm light by melanin is
hundreds of times greater than the absorbance of light
at the same wavelength by blood- and melanin-free
tissues.
Evaluating the accuracy of existing pulse
oximeters for darker skin patients was mainly
performed by comparing the pulse oxygen saturation
against the reference SaO
2
measurements. The
experiments were done on subjects whose oxygen
saturation levels were controlled. The results are
mixed, but several studies showed an overestimated
SpO
2
at lower saturation levels (Bickler, 2005) for
darker skin patients.
Light propagation simulators have been
developed, including MCMatlab (Marti, 2018), and
used to simulate the effect of melanin on SpO
2
accuracy. Monte Carlo simulations were performed to
simulate a transmittance-based pulse oximeter
(Arefin, 2022) for different skin color subjects.
Virtual patients’ finger tissues were generated by
modifying the parameters of the tissue. Oxygen
saturation was in the range of 70% to 100% for each
simulated patient (Arefin, 2022). Monte Carlo light-
tissue interaction model that investigated changes in
melanin level was proposed for reflectance pulse
oximetry (Al-Halawani, 2022). The results show only
the photon penetration depth and absorbance and not
the effect of melanin on the ratio of ratios and SpO
2
estimation.
It is important to control the pressure when
attaching the reflectance probe to the skin. It was
shown that over the range of pressure applied to the
pulse oximetry probe, the DC amplitude and the
normalized pulse area changed significantly (Teng,
2004).
Motion artifacts can be caused even by small
movements, such as typing if the probe is placed on
the wrist, or breathing if the probe is placed on the
shoulder. Motion artifacts can corrupt the signal in
different ways. They can cause baseline shift and/or
induce changes in the morphology of the signal.
Motion artifacts result mainly from the changes in the
depth of the air gap between the probe and the tissue
with motion. The changes in depth cause changes in
the amount of light absorbed in the tissue as well as
the amount of light scattered and reflected from the
tissue. Motion artifacts are mainly low-frequency
interference. The work that included air gap changes
in the Monte Carlo model assumed three types of
motion: fast arm swing, slow arm swing and typing
(Zhou, 2020). The sensor was used in reflectance
mode and was placed on the wrist. Recently, several
works have been done on characterizing the type of
noise or motion artifacts of photoplethysmogram
(PPG) signals obtained when people perform
different activities such as sitting, walking and
running (Cajas, 2020).
3 THE MODEL AND
SIMULATION SETUP
3.1 Simulating Light Propagation
Through the Tissue
The first step in simulating light propagation through
the tissue is to describe the experiment, which
includes the modeled tissue and its properties, the
Simulating the Effects of Melanin and Air Gap Depth on the Accuracy of Reflectance Pulse Oximeters
65
light source and the detector. In the next step, the light
is simulated as photons that are absorbed or randomly
scattered as they travel through the medium. The rate
of absorption and scattering depends on the
absorption and scattering coefficients of each layer of
the skin. This light distribution is described by the
solution to the radiative transfer equation, which is
solved using Monte Carlo (MC) methods (Wilson,
1983).
Using tools such as MCMatlab, the
implementation of the radiative transfer equation
solver is provided so that the user only needs to
describe the experiment and interpret the simulation
results. MCMatlab is an open-source Matlab-based
software for modeling light interaction with
biological tissue. MCMatlab includes the radiative
transfer equation solver for finding the light
distribution in complex media and a thermal solver,
which was not used here. It is user-friendly and
contains many examples that can be modified and
adjusted to a particular problem. However, even
though the authors claim significant improvements in
computational time compared with other tools (Marti,
2018), MCMatlab is based on Monte Carlo
simulations and takes significant time to complete a
simulation.
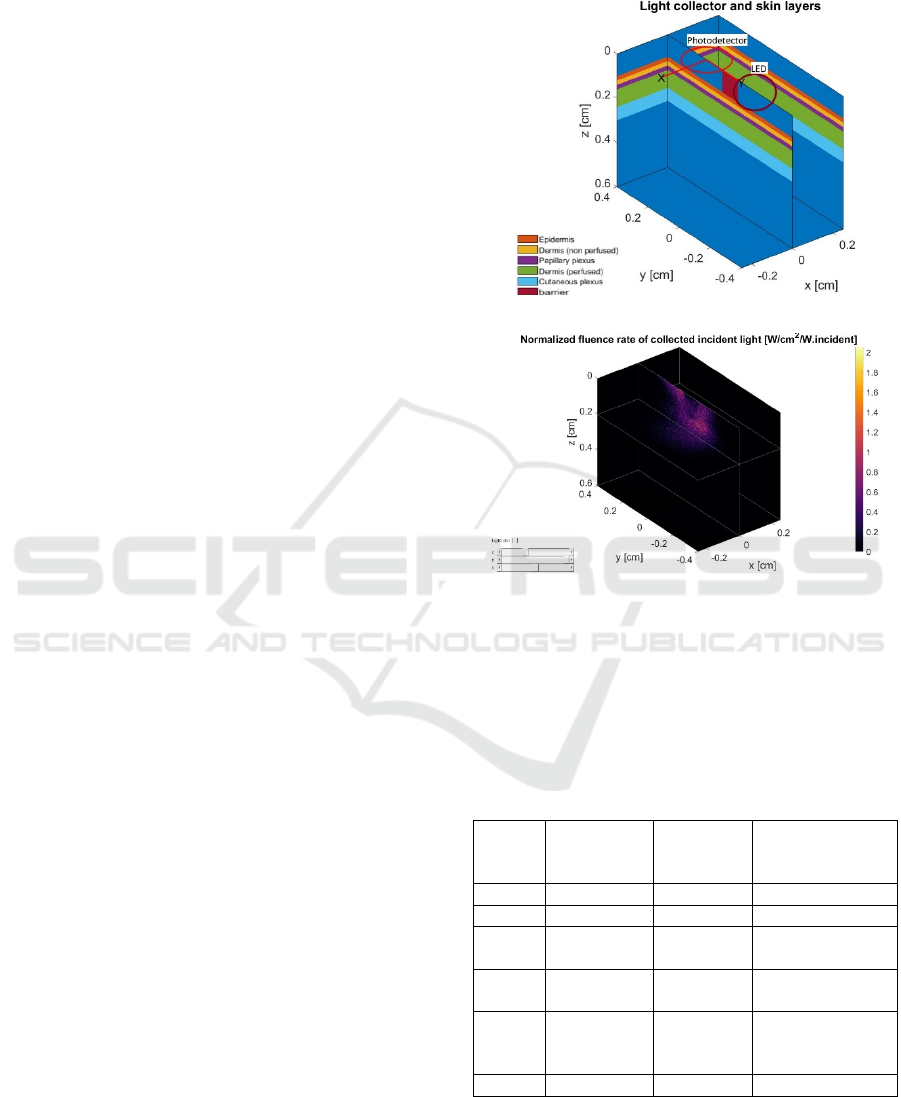
The simulation is mainly based on the work
described in (Reuss, 2004) and (Reuss, 2005). The
simplified model of a reflectance PPG probe consists
of an emitter and a detector. The wavelengths of 660
nm and 940 nm were used in the simulation. Emitter
and detector separation was set to 3 mm. The emitter
(LED) is centered at the coordinates (-0.15 cm, 0 cm,
0 cm) while the detector is placed at (0.15 cm, 0 cm,
0 cm) and normal to the tissue surface – see Figure
1a). On the emitter side, a Gaussian beam of a radial
width of 4 mm was simulated. The Gaussian beam
was selected because it approximates noncollimated
LED (the light does not have parallel rays). The
detector was simulated with a diameter of 2 mm.
Tissue is modeled using several layers and
presented as a cuboid in a 3D Cartesian coordinate
system. The thicknesses and blood volume
distributions in the tissue layers are adapted from
(Reuss, 2005). Human skin is divided into epidermis,
dermis and hypodermis (Figure 1a)). The optical
barrier between the LED and the photodetector is also
modeled and shown in red in Figure 1a). The blue
color layer around the barrier represents the air gap.
Figure 1b) shows the normalized fluence rate of
the collected light at the photodetector. This example
is simulated for 660 nm wavelength, with 10 min
simulation duration, which allows for simulating
about 10
photons. We can see a non-uniform
distribution of light.
a)
b)
Figure 1: a) Modeled skin layers and b) normalized fluence
rate of the collected light. The figure is obtained by running
a modified example provided by MCMatlab (Marti, 2018).
3.2 Modeling Changes in Blood
Volume
Table 1: Sublayers of the skin together with their thickness
and diastolic blood volume.
Layer
# (i)
Layer
names
Sublayer
Thickness
(mm)
Blood volume (
%)
1 Epidermis 0.2 0
2 Dermis 0.2 0
3 Papillary
p
lexus
0.2 0.0556
4 Dermis
(perfused)
0.8 0.0417
5 Cutaneous
plexus
0.6 0.2037 in
diastole, 0.2454
in systole
6 Hypoderm. 8 0.0417
Since each layer is uniformly thick and has the same
area, their relative volumes are expressed only by
their thicknesses. Modeled thickness 𝑑
of skin layer
BIODEVICES 2023 - 16th International Conference on Biomedical Electronics and Devices
66

𝑖 and the relative volume of blood 𝐵
in each layer are
presented in Table 1.
The total blood fraction 𝐵
is defined as the mean
concentration of blood in the total tissue volume
during the diastolic stage, and it is assumed to be 5%.
Therefore, the values of the diastolic blood volume
and the depth of the tissue are selected in a way that
the total blood fraction ends up being 5% by
computing the total blood fraction as:
𝐵
=(𝑑
𝐵
)/𝑑
(1)
where 𝑑
=
∑
𝑑
.
Software packages for simulating light
propagation through the tissue do not automatically
include information about the parameters that change
over time. Therefore, modifications must be done to
address variables that change over time, such as
arterial blood volume. The systole was simulated by
increasing blood volume only in the skin layer that
contains larger blood vessels. The increase in blood
volume per different sublayers was based on the work
of Reuss (2005). The arterial pulsation was simulated
by blood volume increase in the cutaneous plexus
layer only by adding the arterial blood. The pulse
fraction 𝐵
is defined as the fraction of the total
volume displaced by the arterial pulse, which is
assumed to be 0.25%. The relative volume of systole
in the cutaneous plexus layer is then computed as
𝐵
=𝐵
+𝐵
𝑑
/𝑑
= 0.2037 + 0.0025 ⋅ 10mm/
0.6mm = 0.2454%. In this way, the relative volume
of blood in the cutaneous plexus changed from 𝐵
=
0.2037% to 𝐵
= 0.2454%. In all other layers, the
relative volume of blood is the same during systole
and diastole.
In this simulation, about 84% of incident light hits
the cuboid boundaries, and 16% is absorbed within
the cuboid. Out of the total incident light hitting the
boundaries of the cuboid, about less than 1% is
detected by the detector placed on the skin’s surface.
Selected simulation parameters for dermis layers
include the water content W = 0.65, Mie scattering
coefficient 1.0, and anisotropy g=0.9.
3.3 Modeling the Level of Melanin
The level of melanin is initially set to 0.3%
(Chatterjee, 2017), which is ten-fold below what is
commonly found in lightly-pigmented human skin.
The reason was to collect a larger illumination
fraction than the one collected for the skin with larger
levels of melanin. The other melanin levels that are
simulated are 3%, 8%, 12% and 16%. The barrier and
the airgap depths were kept close to zero, which
simulated the situation without the air gap.
The experiment is set to take 20 minutes to obtain
one data point on the graph in Figures 2-3. In Figure
2, there are 44 data points resulting in an 8-hour long
simulation. These experiments were done for
mentioned five levels of melanin. Ideally, the
experiment should run for more than 20 minutes per
point and be repeated multiple times to reduce the
results’ variability. The reason for variability is that
the photodetector actually collects a very small
percentage of light, and if the experiment is short, the
illumination fraction will vary a lot.
3.4 Modeling Changes in Air Gap
Depth
The effect of different amounts of pressure applied to
the probe is simulated by changing the depth of the
air gap. Simulation is performed starting with the air
gap of 0.05 mm, which corresponds to the situation
without the air gap, to 0.2 mm, which corresponds to
a small air gap for a smartwatch. The barrier between
the LED and the photodetector is simulated as well.
Without the barrier, the majority of light collected by
the photodetector would be reflected from the skin
surface. Motion artifacts are commonly simulated as
changes in the air gap depth; therefore, this simulation
could be further extended to the simulation of motion
artifacts. The melanin level was set to 0.3%.
4 RESULTS
4.1 Oxygen Saturation vs. the Level of
Melanin
Figure 2 was obtained by simulating the interaction
of light with the tissue for the experimental setup
described previously when oxygen saturation was set
to 60%, 70%, 80%, 90%, 95% and 100%. The blood
volume was changed in the cutaneous plexus layer to
simulate the increase of blood volume during the
systole. Therefore, there are two different curves for
each wavelength, one obtained during systole and
another obtained during the diastole period of the
cardiac cycle. Figure 2a) shows the relative
values of the illumination fraction
𝐼
(
)
,𝐼
(
)
,𝐼
(
)
, and 𝐼
(
)
vs. SpO
2
for a melanin level of 3% that corresponds to lighter
skin color. I
(
)
and I
(
)
are the relative intensity of
light for a particular wavelength (red 660 nm and
infrared 940 nm) detected during systole or diastole.
Simulating the Effects of Melanin and Air Gap Depth on the Accuracy of Reflectance Pulse Oximeters
67
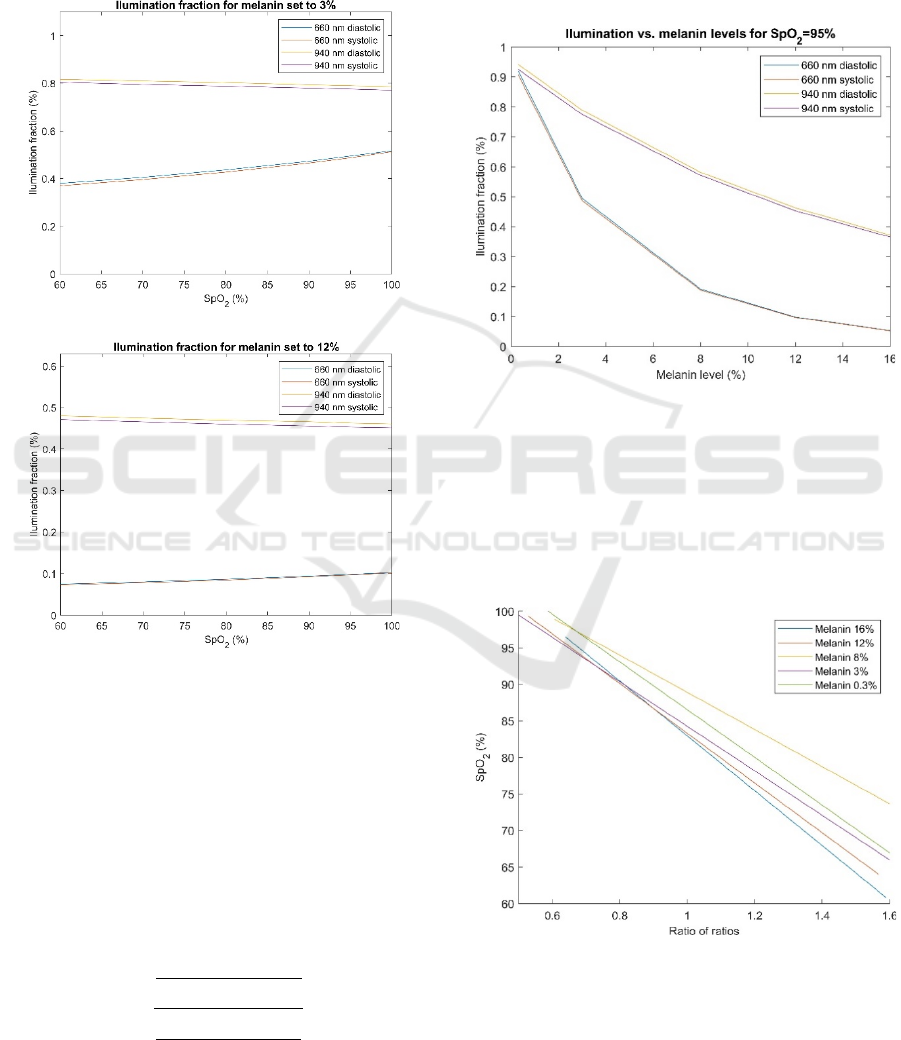
Figure 2b) shows the relative values of
𝐼
(
)
,𝐼
(
)
,𝐼
(
)
, and 𝐼
(
)
vs. SpO
2
for a melanin level of 12% that corresponds to darker
skin color. The illumination fractions are reduced
when the melanin level is increased because more
light gets absorbed with increased melanin levels.
a)
b)
Figure 2: Illumination fractions of light versus oxygen
saturation levels obtained at the detector for 660 nm and
940 nm wavelengths for the melanin levels of a) 3% and b)
12%.
Figure 3 shows the illumination franctions for the
case when melanin levels take values of 0.3%, 3%,
8%, 12% and 16% for oxygen saturation of 95%. The
illumination fractions for both wavelengths are
reduced when the melanin level is increased.
The ratio of ratios 𝑅 is computed as
𝑅=
𝐼
(
)
−𝐼
(
)
𝐼
(
)
𝐼
(
)
−𝐼
(
)
𝐼
(
)
We use the illumination fraction instead of the
light intensity to compute 𝑅. After 𝑅 is computed,
𝑆𝑝𝑂
is estimated using regression. An example of
linear regression is shown below:
𝑆𝑝𝑂
=𝐶
+𝐶
⋅𝑅
where 𝐶
and 𝐶
are regression coefficients.
Figure 3: Illumination fraction of light versus the level of
melanin for 95% oxygen saturation level obtained at the
detector for 660 nm and 940 nm wavelengths.
For each ratio of ratios obtained using different
levels of melanin, we fit different curves. Fitted
curves of SpO
2
versus the ratio of ratios for each level
of melanin, are shown in Figure 4. The fitted curve
for a melanin level of 8% (yellow line) is an outlier.
Figure 4: SpO
2
versus the ratio of ratios computed for
different melanin levels.
Next, let us consider the following scenario. The
simulated data was collected for the case of a low
level of melanin (3%), and the regression curve SpO
2
BIODEVICES 2023 - 16th International Conference on Biomedical Electronics and Devices
68
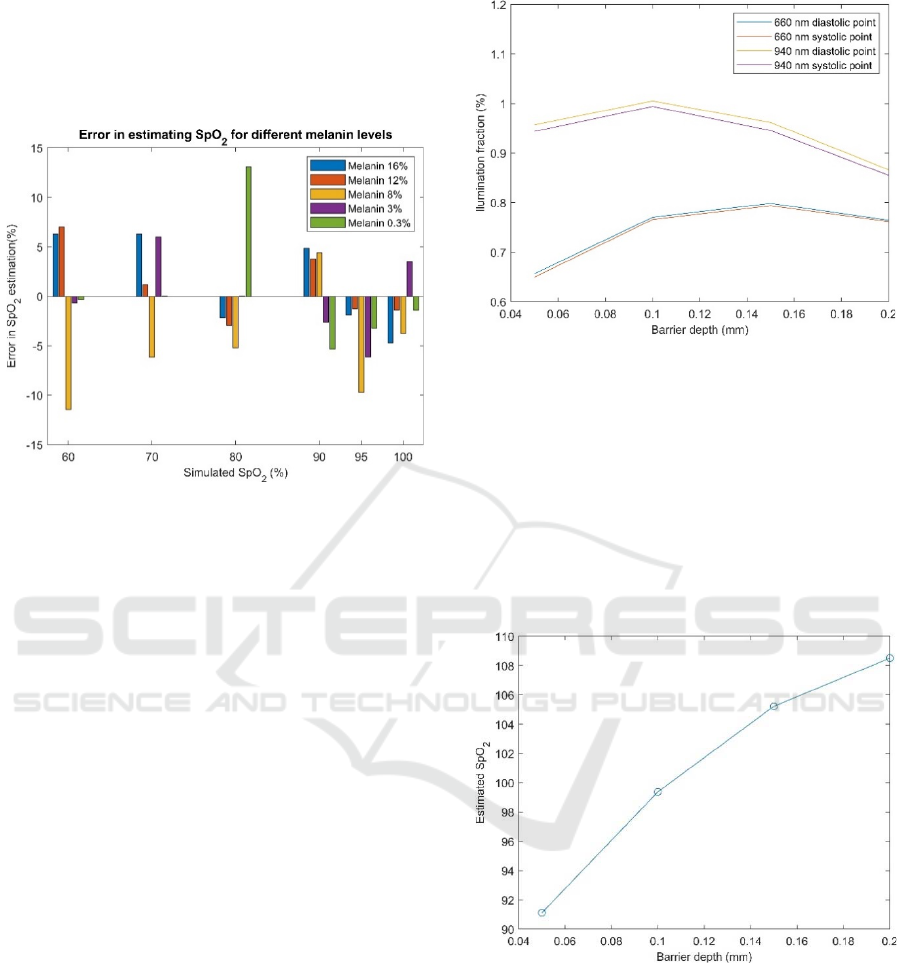
vs. the ratio of ratios was fitted for this melanin level.
Then, new simulated data (illumination fraction at
660 nm and 940 nm at systolic and diastolic
instances) was collected for subjects with other
melanin levels.
Figure 5: Error in estimated SpO
2
versus simulated (ground
truth) SpO
2
computed for different melanin levels.
To compute the SpO
2
for these subjects, the
regression coefficients computed for the subject with
3% melanin were used. The error between the
computed oxygen saturation levels versus true,
simulated oxygen saturation when melanin levels
take values of 0.3%, 3%, 8%, 12% and 16% are
shown in Figure 5. The abscissa is the simulated SpO
2
at the saturation levels of 60%, 70%, 80%, 90%, 95%
and 100%. The ordinate shows the SpO
2
errors for
these simulated levels of oxygen saturation. There are
several outliers in the figure, including a large outlier
at SpO
2
=80% for a melanin level of 0.3%. The
number of outliers could have been reduced if the
simulation time was longer.
4.2 Oxygen Saturation Changes with
Air Gap Depth Changes
Figure 6 shows the change of the illumination fraction
for both red and infrared light at the points of minimum
and maximum blood volume (diastolic and systolic
points) for an oxygen saturation level of 95% and a
very low level of melanin. The ratio of AC and DC
components decreases with the increase of the air gap.
The ratio of ratios is computed from Figure 6 and
used to estimate SpO
2,
which is shown in Figure 7.
Since the SpO
2
is fitted using a curve based on almost
no air gap, we see that the SpO
2
gets overestimated as
the depth of the air gap increases. The simulation was
performed with SpO
2
=95%. As can be seen in Figure
Figure 6: Simulated changes in the illumination fraction
with an increased air gap between the probe and the tissue
for SpO
2
=95%.
7, for larger values of the air gap, we are getting
oxygen saturation levels of more than 100%, which is
not possible. In a realistic device, an algorithm would
limit the SpO
2
level to a maximum of 100%. Devices
are normally calibrated for a fixed air gap depth.
However, when the air gap depth changes due to
motion artifacts, it causes significant changes in the
ratio of ratios and errors in estimating SpO
2
.
Figure 7: Estimated SpO
2
for the air gap depth of 0.05 mm,
0.1 mm, 0.15 mm and 0.2 mm with a simulated barrier
placed between the emitter and the detector for SpO
2
=95%.
The estimated values of SpO
2
for larger air gaps are outside
the bounds (larger than 100%).
5 DISCUSSION AND
CONCLUSIONS
This work builds on the modeling works of (Reuss,
2005) and the simulator design of (Marti, 2018). It
Simulating the Effects of Melanin and Air Gap Depth on the Accuracy of Reflectance Pulse Oximeters
69

analyzes the effects of melanin and the depth of the
air gap on the ratio of ratios and the accuracy of SpO
2
estimates. The main observations from this work and
future directions are discussed next.
It can be observed from Figure 4 that the slopes of
SpO
2
vs. the ratio of ratios curves are different for
different skin colors. Therefore, if we could estimate
the tone of the subject’s skin, we would be able to
adjust the curves or select the appropriate regression
curve for calibration. In addition, if the SpO
2
calibration curve computed for subjects with a lower
level of melanin is used for subjects with a larger level
of melanin, the results from Figure 5 do not confirm
that the overestimation would occur. This might be
because of outliers of SpO
2
estimates at 0.3% and 8%
melanin levels. The results, however, show variability
with an increased level of melanin.
The illumination is significantly reduced with the
increased level of melanin, as shown in Figure 3. It
drops faster for red than for infrared light. This
information can be used to increase the radiated
power of the LEDs in case a darker skin color is
detected.
In reflectance pulse oximetry, it is difficult and
sometimes impossible to control how well the probe
is attached to the skin. This can result in a varying air
gap. Increasing the air gap results in an increased
level of reflection of light from the surface of the skin,
resulting in less light propagating in the tissue and a
weaker AC component of the signal. Figure 6 shows
changes in illumination fraction at the photodetector
with increasing the air gap and barrier depth. Figure
7 shows changes in the estimated SpO
2
for the same
case. Therefore, the pressure applied to the device
should be controlled and constant to allow for a fixed
air gap. Also, motion artifacts cause varying air gaps;
therefore, they should be detected, and the signal
obtained during motion artifacts should be removed
from the analysis.
The study can be extended in several ways. One is
to repeat measurements for different points and to run
Monte Carlo simulations longer to get less noisy data.
We can also modify the tissue model to more
precisely reflect the body site where the probe is
attached. For example, the optical properties and
thickness of the skin layers on the finger, ear, wrist,
neck, or forehead (which are some of the typical sites)
are different.
The simulated depth of the blood vessels can be
modified based on the selected site. In the simulation,
we assume that the blood volume changes occur only
in the cutaneous plexus. It was also observed
(Mannheimer, 2004) that placing the reflectance
pulse oximetry probe directly over a larger blood
vessel can degrade SpO
2
estimation accuracy. This
can also be modeled.
Future work will also include building an end-to-
end pulse oximeter simulator that will include the
model of the LEDs and driving circuits, the model of
the tissue and light propagation and the model of the
photodiode and the front-end electronics. This will
allow us to understand further how noisy the signal is
in case of small levels of illumination of the
photodetector and to perform sensitivity analysis to
understand what components/parameters of the
system affect the output the most.
REFERENCES
Al-Halawani, R., Chatterjee, S. & Kyriacou P.A. (2022).
Monte Carlo Simulation of the Effect of Human Skin
Melanin in Light-Tissue Interactions. 2022 44th Annual
International Conference of the IEEE Engineering in
Medicine & Biology Society (EMBC).
Arefin, M.S., Dumont, A.P. & Patil, C.A.(2022). Monte
Carlo based simulations of racial bias in pulse oximetry.
Proc. SPIE 11951,Design and Quality for Biomedical
Technologies XV, 1195103.
Bickler, P.E., Feiner, J.R & Severinghaus, J.W., (2005).
Effects of Skin Pigmentation on Pulse Oximeter
Accuracy at Low Saturation, Anesthesiology, 102:
715–9.
Bolic M. (2023). Pervasive Cardiovascular and Respiratory
Monitoring Devices: Model-Based Design. Elsevier.
Cajas, S. A., Landínez, M. A. & López, D. M. (2020)
Modeling of motion artifacts on PPG signals for heart-
monitoring using wearable devices. 15th International
Symposium on Medical Information Processing and
Analysis, 11330(3).
Chatterjee, S. & Phillips, J. P. (2017). Investigating optical
path in reflectance pulse oximetry using a multilayer
Monte Carlo model. Clinical and Preclinical Optical
Diagnostics, edited by J. Quincy Brown, Ton G. van
Leeuwen, Proc. of SPIE-OSA, 10411.
Fuentes-Guajardo, M., Latorre, K., León, D. & Martín-
Escudero, P. (2022). Skin Pigmentation Influence on
Pulse Oximetry Accuracy: A Systematic Review and
Bibliometric Analysis. Sensors, 22(3402).
Hartmann, V., Liu, H., Chen, F., Qiu, Q., Hughes, S. &
Zheng D. (2019). Quantitative Comparison of
Photoplethysmographic Waveform Characteristics:
Effect of Measurement Site. Front Physiol., 10(198).
Mannheimer, P.D., et al. (2004). The Influence of Larger
Subcutaneous Blood Vessels on Pulse Oximetry.
Journal of Clinical Monitoring. 18, 179-88.
Marti, D., Aasbjerg, R. N., Andersen P. E. & Hansen A. K.
(2018). MCmatlab: an open-source, user-friendly,
MATLAB-integrated three-dimensional Monte Carlo
light transport solver with heat diffusion and tissue
damage. Journal of Biomedical Optics, SPIE, 23, 1-6..
BIODEVICES 2023 - 16th International Conference on Biomedical Electronics and Devices
70

Reuss, J. L., Siker, D. (2004). The pulse in reflectance pulse
oximetry: Modeling and experimental studies. Journal
of Clinical Monitoring and Computing, 18, 289–299.
Reuss, J.L. (2005). Multilayer modeling of reflectance
pulse oximetry. IEEE Trans Biomed Eng., 52(2), 153-
159.
Teng, X.F. & Zhang, Y.T. (2004). The effect of contacting
force on photoplethysmographic signals. Physiological
Measurement, 25(5), 1323-1335.
Tuchin, V.V. (1997). Light scattering study in tissues.
Physics—Uspekhhi, 40(5), 495–515.
Webster J. G. (Ed.) (1997). Design of Pulse Oximeters. IOP
Publishing Ltd.
Wilson, B.C. & Adam, G. (1983). A Monte Carlo model for
the absorption and flux distributions of light in tissue.
Med. Phys., 10(6), 824 – 830.
Zhou, C.C., Wang, J.Y., Qin, L.P. & Ye, X.S. (2020)
Model Design and System Implementation for the
Study of Anti-motion Artifacts Detection in Pulse
Wave Monitoring. Proceedings of the 13th
International Joint Conference on Biomedical
Engineering Systems and Technologies, 1, 102-109.
Simulating the Effects of Melanin and Air Gap Depth on the Accuracy of Reflectance Pulse Oximeters
71
