
Towards a Robust Solution for the Supermarket Shelf Audit Problem
Emmanuel F. Mor´an
a
, Boris X. Vintimilla
b
and Miguel A. Realpe
c
ESPOL Polytechnic University, Escuela Superior Politecnica del Litoral, ESPOL, CIDIS,
Campus Gustavo Galindo Km. 30.5 V´ıa Perimetral, P.O. Box 09-01-5863, Guayaquil, Ecuador
Keywords:
Retail, Supermarket, Shelves Auditing, Deep Learning, Supermarket Dataset.
Abstract:
Retail supermarket is an industrial sector with repetitive tasks performed using visual analysis by the store’s
operators. Tasks such as checking the status of the shelves can contain multiple sequential sub-tasks, each of
which needs to be performed correctly. In recent years, there has been some intents to create a solution for the
tasks mentioned without been complete solution for retails. In this article, a first realistic approach is proposed
to solve the supermarket shelf audit problem. For this, a workflow is presented to deliver compliance level
with respect t o the expected store’s planogram.
1 INTRODUCTION
In recent years, A I has begun to be implemented in
a wide number of fields, including medicine (Chua
et al., 2021), agriculture (Zhang et al., 2020), finance
(Patil et al., 2022), among others. We address a topic
that to date and to the best our knowledge, has n ot
been fully analyzed in the public liter ature: Retail Su-
permarket Shelves Auditin g.
Shelves Auditing can be defined as the process of
comparing the curr ent state of shelves against the ex-
pected state according to a planogram (a visual model
for distributing super market products on their respec-
tive shelves). To make this comparison, human oper-
ators must carry out visual check s following the pro-
tocol of the store in order to validate the status of the
shelves. As result of these visual processes, a percent-
age of comp liance between the actual shelves and the
planogram is calculated. Finally, by averaging these
values of all the shelves in the sales area, a store com-
pliance percentage can be obtained.
In this article, a new proposal to solve the super-
market shelf audit problem by defining an acquisition
method for a new dataset and a workflow to process it
will be discussed.
a
https://orcid.org/0000-0001-6915-7370
b
https://orcid.org/0000-0001-8904-0209
c
https://orcid.org/0000-0001-8711-5596
2 SUPERMARKET ISSUES
Many problems in retail supermarkets have been iden-
tified and reported in the literature (Pettigrew et al.,
2005) (Li and Wang, 1970) (Jedlickova, 2016). This
section will fo c us on the issues that involve product
placement in the shelves, since these pr oblems are re-
lated to the fact that produ ct positioning is done by
humans, inevitably leading to some errors.
2.1 Outdated Price Tags
This problem refers to price tags th a t are outdated
(printed or digital) or are in poor condition (torn,
stained, poorly printed, etc.). Price tags are one of
the most impor ta nt objects on the shelves, since they
allow to know what product is being displa yed, its
description, w eight or size and price. If price tags
are out of date, it is impossible for customers to co r-
rectly iden tify the product or to know the real price of
the product. An outdated price on the price tag can
have two negative repercu ssions: If the actual price
is lower than what is displayed (for example, a prod-
uct that should have a special offer), it is probably
not attractive to customers, and therefore sales may
be lost. On the other hand, if the r eal price is higher
than th e one shown, the customer may feel cheated
when checking out. This last one could have legal
repercu ssion as it can be consider a consumer scam.
An option for this to not scale is to sell the product at
the seen price (losing money).
A conventional solution could be dig i-
tal/electronic price tags (Cochoy and Soutjis,
912
Morán, E., Vintimilla, B. and Realpe, M.
Towards a Robust Solution for the Supermarket Shelf Audit Problem.
DOI: 10.5220/0011747000003417
In Proceedings of the 18th International Joint Conference on Computer Vision, Imaging and Computer Graphics Theory and Applications (VISIGRAPP 2023) - Volume 4: VISAPP, pages
912-919
ISBN: 978-989-758-634-7; ISSN: 2184-4321
Copyright
c
2023 by SCITEPRESS – Science and Technology Publications, Lda. Under CC license (CC BY-NC-ND 4.0)

2020). These are price tags tag can massively
change their content (price, description, code, etc),
but sadly implementing this is expensive, and most
of the retails could not afford. Someone could
also think to use RFID technology to easily catch
informa tion from a price tag, but this technology is
not conventional for this p a rticular use since it is
normally use for identifying product in the supply
chain (Tao et al., 20 22;
ˇ
Skiljo et al., 2020) and ease
inventory in categories with high margin of gain like
clothes and b ottles with alcoholic b everages such as
whiskey(Cilloni et al., 2019; Khalil et al., 2020).
2.2 Inactive Assortment
Inactive A ssortment is the denomination given to
products that should b e displayed in the sales area
(space wh ere shelves are, and produc ts are disp la yed),
but for so me reason are not. Some of the reason s for
this to happen are: out of stock, stock on the way
but not yet in store, or store decision. Inactive as-
sortment could drive shoppers away as they can’t find
some products.
2.3 Product Breaks
Denomina tion for a partially displayed product on the
shelves. This is considered bad for the presenta tion
because the shelf appears to be em pty. This is differ-
ent from inactive assor tment because product is dis-
played in the shelf tray (shelf area for the produ ct)
but is partially empty. This could happen for many
reasons, such as out of stock, replenishment n ot yet
completed , or simply the product is in stock but not
yet displayed on the shelves due to opera tor error. The
latter is the most common mistake and can be fixed by
manually checking all the pr oducts on the shelves.
2.4 Products in Poor State
A product state is how it is d isp la yed in the shelf and
the envelope o f it. If a product is in poor state it could
drive to a customer to not perform the purchase and
even do not return to the sto re ever again. This could
be fault of operators who have not followed the store
protocols or perhaps some children playing around in
the store.
3 THE PROCESS OF SHELVES
AUDITING
In a supermarket, sh elves auditing c an be defined
as the p rocess of comparing the cur rent state of
the shelves with the expected state according to its
planogram. This comparison is necessary for many
aspects, among them, validating contr actual compli-
ance with suppliers who paid extra for strategic posi-
tioning of their products on the shelves, or to be able
to carry out market analysis, i.e. how certain products
behave if they are placed closer to or further away
from others.
Such comparisons are usually made by su permar-
ket operators, and like any repetitive process per-
formed by a hu man being , it is prone to errors and
time consuming due to its visu al nature.
The following states must be validated during the
audit of the supermarket shelves:
• Presence of all products on each shelf according
to the planogram.
• Presence of product price tags in the correc t posi-
tion.
• Conc ordance between the product and its price tag
accordin g to the define d protocol.
• Product price updated in the price tag.
• Presence of product breaks.
• Product status (correct number of shelf tray fronts,
well-organized products, or others that the super-
market may need) .
All validations mention ed are perfor med during
store opening hours, but these are more extensive be-
fore or after hours of operation due to the absence of
customers. The operator will first check the shelves in
all aisles and try to solve problem s like wrongly posi-
tioned price tag s or products. For other issues, such as
product breaks, the operator first will go to the ware-
house to pick up missing products and then will return
to fill the shelf. This process is tedio us and repetitive
enoug h to lead operators to make mistakes. For this
reason, th ere is a need to automate the step of review-
ing the shelves and looking for existing p roblems in
them, thereby the operator s have this information di-
rectly and can attend to them with quick and precise
solutions.
4 DISCUSSION: A WAY
FORWARD
The remarkable work presented by (Goldman et al.,
2019a ) with their dataset named SKU110k ( G oldman
et al., 2019b) has fueled in itiatives for shelves aud it-
ing solutions such as (Chen et al., 2022) with their
dataset named UniTail, that also includes other pro-
cesses like text detection and recognition, but do not
Towards a Robust Solution for the Supermarket Shelf Audit Problem
913
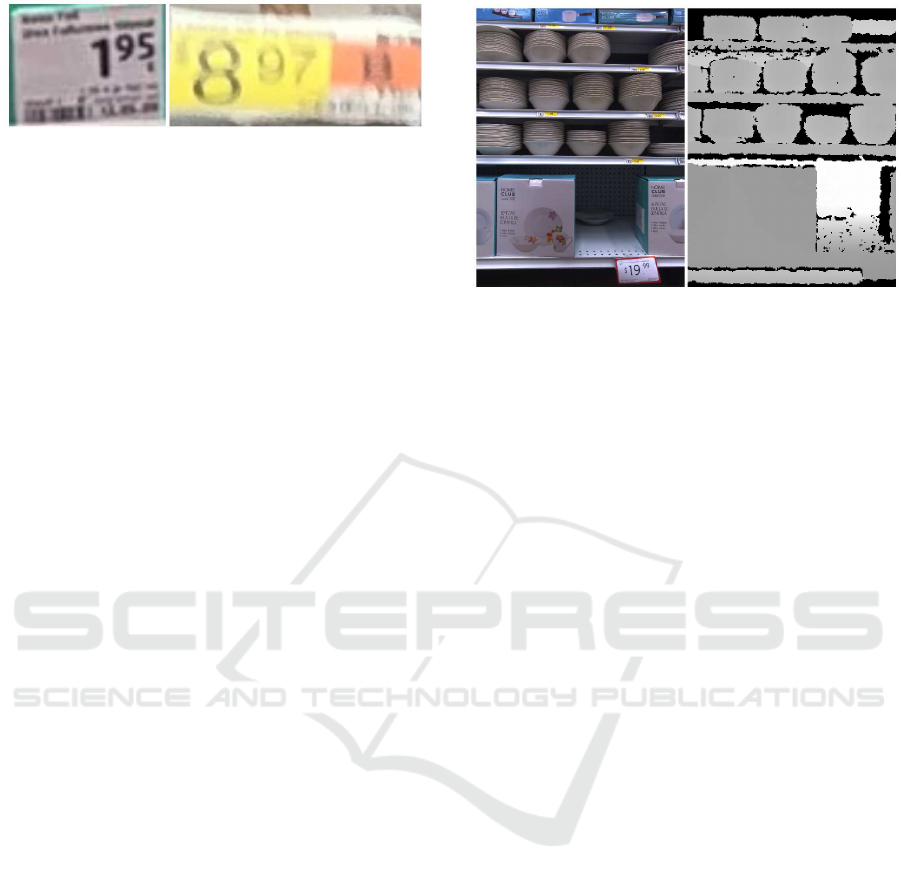
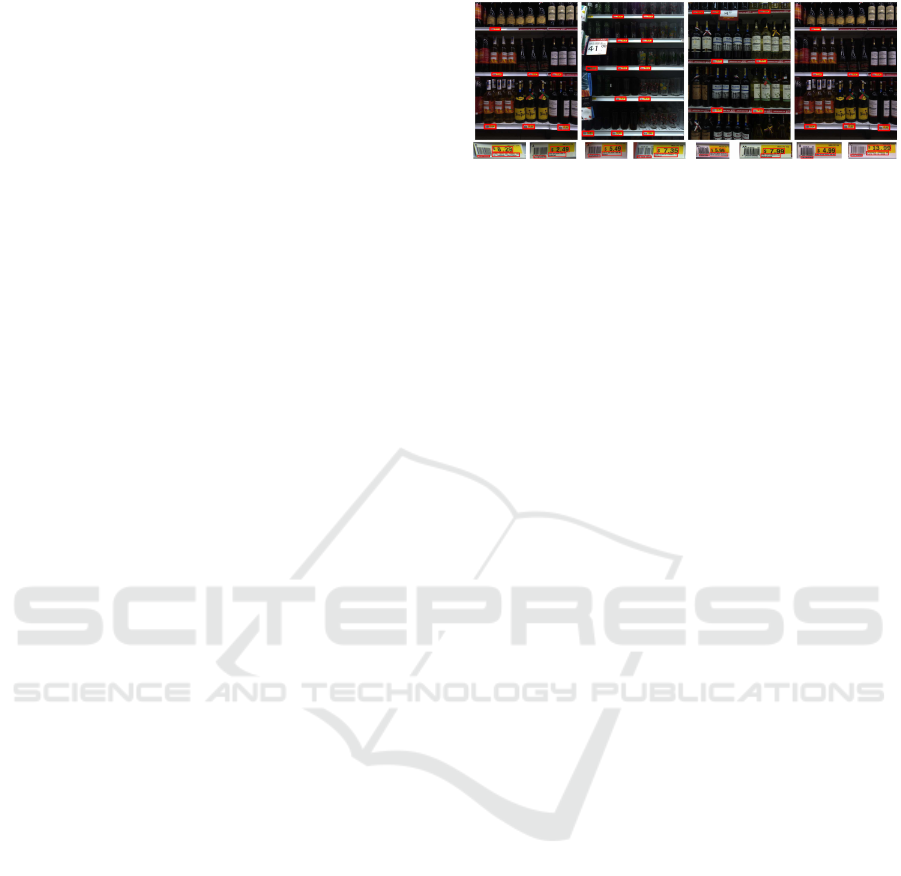
Figure 1: Examples of price tags fr om the SKU110K and
UniDet datasets, from left to right respectively.
provide all the means to solve the problems men-
tioned above in Section 2. For this, it might be bet-
ter to create a dataset capable of addressing all the
requirements in shelf auditing.
As outlined earlier, the price tag is an important
object on the shelves, because it shows the price and
description of the product and is used for limiting
a product’s front space, helping to und erstand if the
product was positioned correctly on the shelves. With
this in mind, datasets like SKU110k and UniDet can-
not be used to validate the mentio ned states since not
all data within the price tag can be collected (read-
ing it, as seen in Figure 1, which means it is not
possible to so lve the problem of outdated prices be-
cause it is impossible to match the object itself with
the databases w here retailers save and update product
prices for transactio ns at checkout.
Furthermore, when using the pr oduct package text
for matching, as done in (Chen et al., 2022), there will
be a considerable number of products that could not
be correctly identified. This is indeed a weakness of
this work. On the other hand, when using the prod uct
price tag, there will always be a full description of the
product, or at least a co de to identify it.
Lastly, not having the price tag localizatio n will
prevent the pip e line from reporting some shelf audit
issues, such as wrongly positioned products.
Current public datasets are the problem because
they were crea te d with little or no knowledge of what
is n eeded to solve the retail problem: Shelf Audit.
Try ing to overcome the whole problem can end up
with pipelines of craft solutions, not generalizable so-
lutions.
4.1 Proposed Dataset
As far as is known, all the approaches that have been
proposed try to solve the shelf audit p roblem using
only RGB images. However, as mentioned above this
is a limitation. For this reason, a new dataset to mee t
all the needs of this problem is proposed in this sec-
tion.
For the dataset, the following aspe cts should be
considered:
1. RGB-UHD Images. RGB is the standard Red-
Green-Blue convention for im a ges, while UHD
Figure 2: Example of proposed images; left: RGB-UHD
image, and right: depth image (this image have been bina-
rized).
means Ultra High Definition images. Figure 2
(left) shows an example for this type o f images,
which are captured using a high definition cam-
era (preferably a resolution of 4k or higher). In
this dataset, the information to be tagged is: the
product and the price tags.
2. Depth Images. these images are captu red by a 3D
camera and allow to obtain the measured depth
from the ca mera lens to the objects (norma lly a
resolution of 640x480 pixels), see Figure 2 (right).
No need for an notations.
3. Positional Information. defines the position or
location information relative to the acq uisition
site. Th is in formation will help understanding
where the image is taken on the store map and
can be delivered in [x,y,z] format, which means
the (x,y) position on the map at (z) meters above
the floor.
4. Planograms. a structure that contains the ex-
pected position of the product on the shelves in
order to compare it with the current position.
5. Master Database. a database to c onsult informa-
tion abou t the produ c ts such as: prices, descrip-
tions, codes, among others. This is comm on in-
formation that all retailers should have.
4.2 Proposed Acquisition System for the
Dataset
For acquiring the proposed dataset, an automated ac-
quisition sy stem is presented (which from now and on
will be referred as ”robot”). This is crucial for reduc-
ing the time consumed by the operators in auditing
the shelves. Using operators to acq uire the informa-
tion will only add more tasks to th em, increasin g time
instead of redu c ing it.
VISAPP 2023 - 18th International Conference on Computer Vision Theory and Applications
914
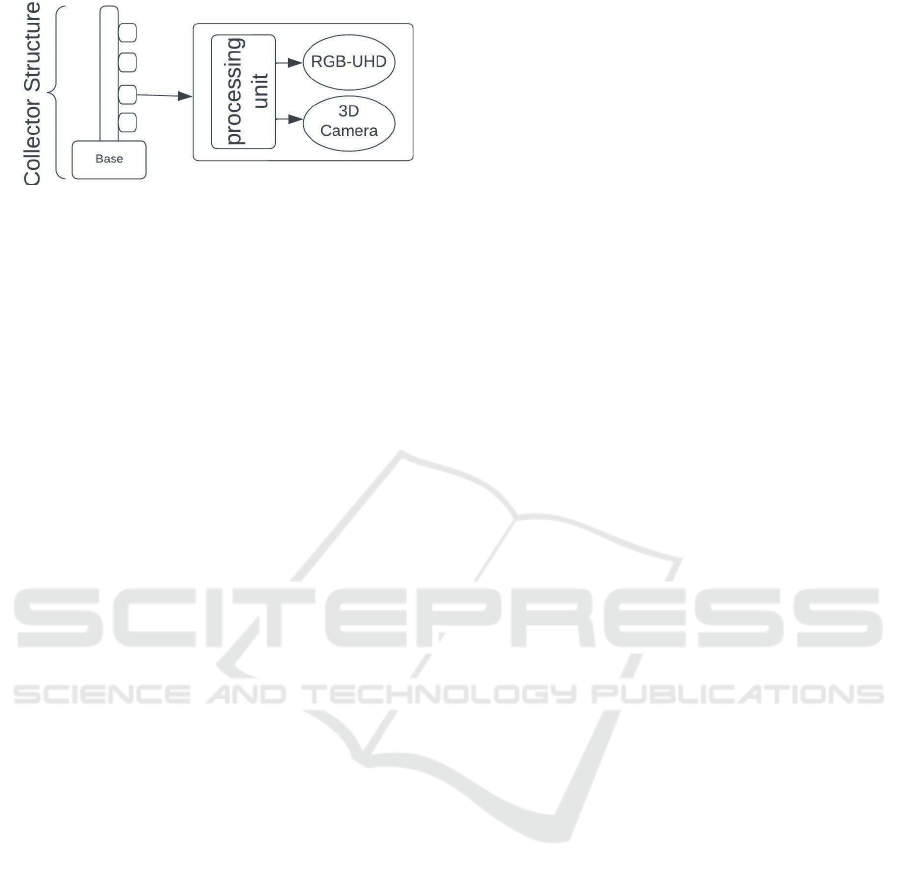
Figure 3: Collector S tructural Design.
Figure 3 shows the pro posed robot. It is not differ-
ent from others already deployed in retail. It is based
on a mobile base (2 or 4 wheels with suspension sys-
tem, battery, and voltage regulation), with a structure
on it, similar to a tower, where the c ollectors are ver-
tically and equidistantly placed. The collectors con-
sist of low compu ta tional resources pro cessing units
(Raspberry Pi 4, Jetson Nano, In tel Nuc, among oth-
ers), a RGB-UHD came ra an d a 3 D Camera.
This robot needs to move autonomously, so it
is recommended to use state-of-the-art robotic soft-
ware for moving it, like ROS(Stanford Ar tificial In-
telligence Laboratory et al., ), ROS2(Macenski e t al.,
2022). This software is able to estimate the positional
informa tion of the robot with respect to the store map
at all times.
An important part of the robot is the way it cap-
tures the information. It goes thro ugh the hall of
the store taken images with the cameras of collec-
tors. This route is performed by doing steps. A set
of images (rgb-uhd and depth ima ges per collector) is
taken every step. Every step is limited by the fields of
views (FOVs) of the cameras. This is done beca use
the main purpose is to acquir e information, so redun-
dancy is introduced during the acquisition. For hori-
zontal redundancy in the images, the distance of each
step is shorter than the FOV of the cameras, and for
vertical redundancy , the collectors are equidistantly
positioned in the tower of the robot. Have redundant
informa tion provides the ce rtainty of not losing infor-
mation at all.
4.3 Proposed Pipeline
All processes, including the inputs and outputs, are
explained below. Figure 4 shows the pip eline of
the pr oposed solution for the shelf auditing problem.
Blue and green block s are inp uts (data acquired a s
mentioned before ) and outputs ( reports) respectively.
Gray blocks are processes that may involve the use of
artificial intelligen ce algorithms such as object detec-
tion, object recognition, clustering, text re cognition,
among others. Yellow blocks are also processes but
guided to validations or estimations, that is, they use
the manipulated and filtered data for creating the re-
port outputs.
It most be m entioned th a t the proposed pipeline
does not try to add new hardware or pr ocesses to
the sto res, like in the case of implementing digi-
tal/electronic price tags or RFIDs to the price tags or
products, since this will create new exp enses to the
retail.
In Figure 5 is shown how the RGB and depth
images are processed during the firsts blocks in the
pipeline. Yellow section r efers to product detection
and recogn ition; blue section refers to price tags de-
tection, item s detection a nd recognition; while the
green section refers to gap detection .
Product Detection. This process requires RGB-UHD
images as input and p roduces RBOXs th at represent
the products as outputs. Each RBOX is defined by
a 7-value list containing the information of the d e-
tection (x axis, y axis, height, width, rota tion angle,
confidence and class). A pre-trained object detection
algorithm could be used to carry o ut this process. To
continue with other processes, crops of the products
should be done, and will be ref erred as uhd-product
images.
Product Recognition. This process requires uhd-
product images as input and produces a text referring
to the product class. The output can be represented
by a descrip tion or a code, but it is recomm end to
use codes instead of description, as the dataset will
be lighter (meaning size, as the code is normally a
shorter string), additio nally, the probability of c hang-
ing products’ descriptions is higher than the one of
changin g codes. A pre- trained multi-classification a l-
gorithm would be needed to carry out this pro cess.
Price Tag Detection. This process requires RGB-
UHD images as input and produ c e RBOXs that re p-
resent the price tags as outp uts. A pre-trained ob-
ject detec tion algorithm for the ta sk of detecting price
tags could be used to c a rry out this process A cu sto m
dataset must be created for this process, since to the
best of our knowledge there is no public dataset cre-
ated for detecting price tags. To continue with other
processes, crops of the price tags should be done, and
will referre d as uhd-price-tag images.
Note that, there is the option of creating a single
detector for price tags and products, but this pipeline
shows them separated ju st to make clear each process
of the pipeline.
Items Detection. This process requires as input uhd-
price-tag images and prod uce RBOXs that represent
the items of the price tags. Items is the denomination
in this article to the important texts in the price tag s
such as, but not limited to, codes, prices and descrip-
tions. A pre-trained object detection algorithm for the
Towards a Robust Solution for the Supermarket Shelf Audit Problem
915
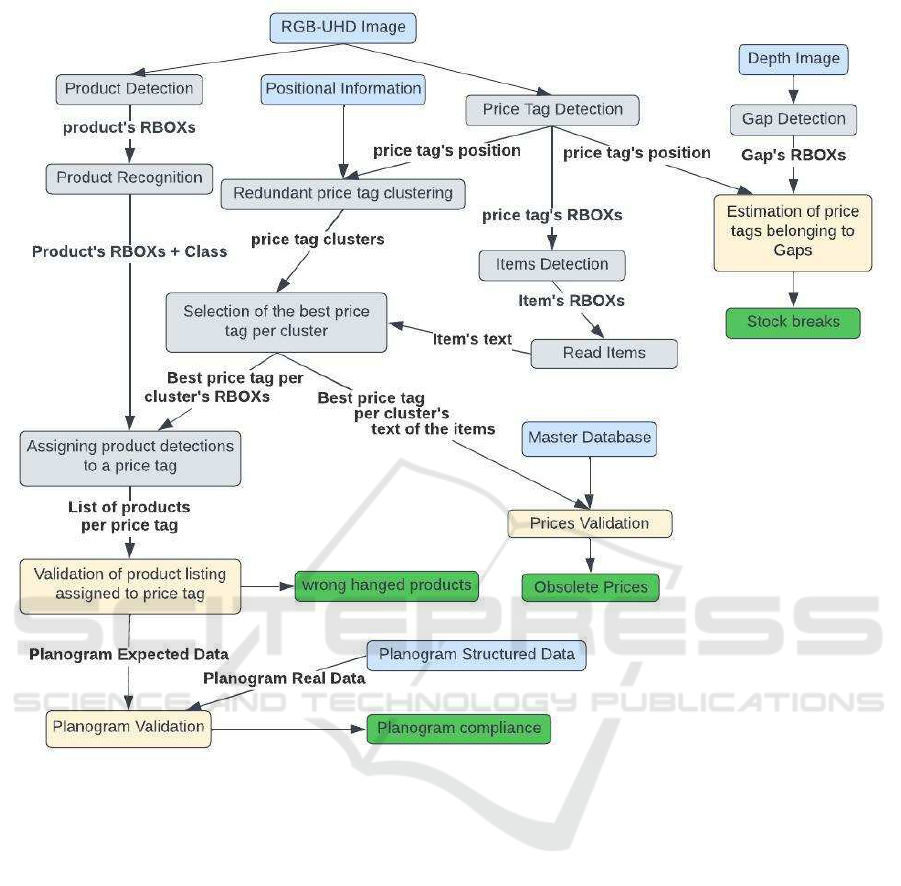
Figure 4: Proposed pipeline to solve the shelves auditing problem.
task of detecting items could be used to ca rry th is pro-
cess and deliver RBOXs of the detection as outputs,
such as text detecto rs. To continue with other pro-
cesses, crops of the items should be done. We will
refer to these as uhd-items images.
Read Items. This pro c ess requires as input the uhd-
items images and produce texts as outputs. The d e-
tected items o f each price tag m ust be read in o r-
der to know what information is shown and subse-
quently contrast that information against the Mas-
ter Database. The items mentioned are texts, thus
the way to read those items is by OCR, for other
items like the barcode a barcode-reader should be im-
plemented (Code 39, Code 128 , GS1-128, EAN-13,
among others). To con tinue with other processes, the
texts generated will be referred as items text.
Gap Detection. This process requires the input of
depth images and produce RBOXs that represent the
gaps in the shelves. Each pixel of the depth im-
age contains the depth measured from the 3D camera
lens. The RBOXs are relative to the d e pth image, and
should be projected to the rgb- uhd images. For ac-
complish this, a co nversion using a translation matrix
should be done.
Redundant Price Tag Clustering. To be able to se-
lect the best of all the price tags (next process) it is
important first to correctly group all the redundant in-
stances of the same object, and then proceed to choose
the best one that r epresents the real instance of the ob -
ject. For this process, spatial information related to
the collection location is required, that is, the infor-
mation of the position where each image is co llec te d
is also saved with r e spect to the reference system of
the sto re. With the help of rotational and translation s
transformations, it is possible to obtain the po sition o f
each o bject’s centroid (x,y) with respect to the refer-
ence system. Finally, using a clustering algorith m that
will have as input the spatial positions of the price tag,
the clusters can be obtained. Initial cluster could fail
given th e dense environment in a shelf, so it is recom-
VISAPP 2023 - 18th International Conference on Computer Vision Theory and Applications
916
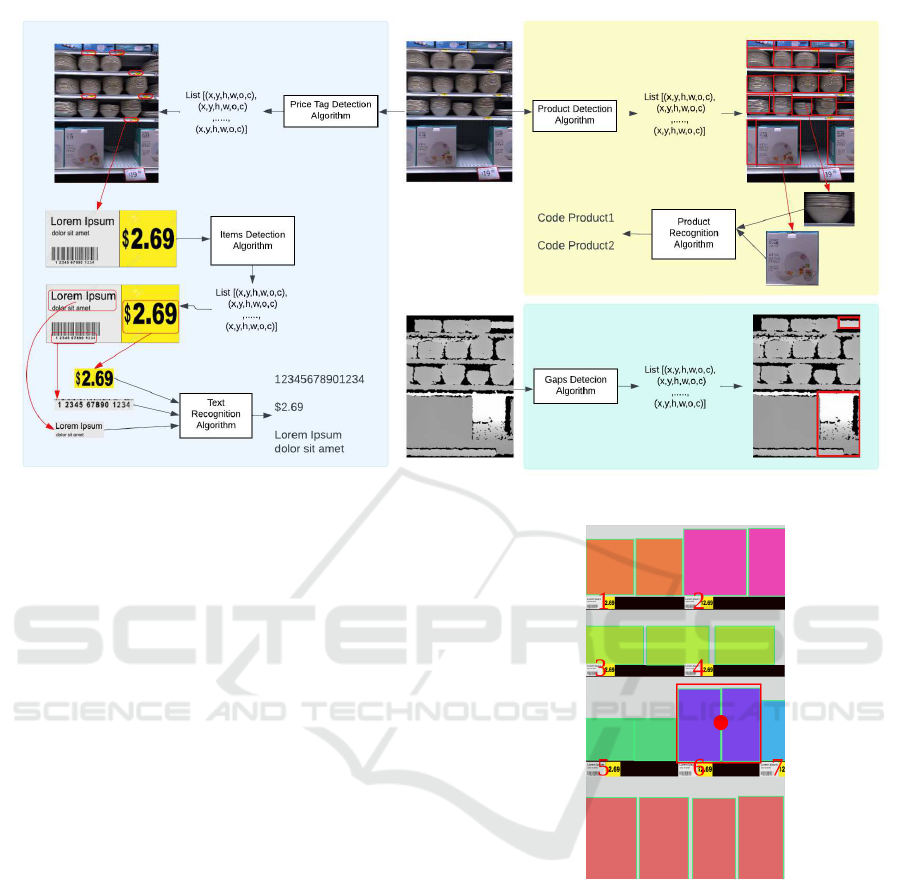
Figure 5: Product Detection Process of the pipeline.
mended to use a sub sequent algor ithm to validate the
items inside the cluster using the items text of each
price tag.
Selection of the Best Price Tag per Cluster. Being
redundant means that multiple captures we re obtained
for the same price tag, and therefore it is necessary
to choose the best of all to be the re presentative of
the group. The selection of th is can be varied, but it
is suggested to do it according to the characteristics
of objectness of the price tag and the confidence of
readings of the items belonging to each price tag using
a weighted average as the metric for ordering. The
output of this process is a list of the price tags.
Prices Validation. The texts of the best price tags
of each generated clu ster are require d as input and to
create a list of products. Then, a comparison between
this list and the data on the master database is done.
The output of this validation process is a new list of
products that have obsolete prices (different from the
price in the database). This report is known as ”obso-
lete prices”.
Assigning Product Detections to a Price Tag. T his
process is quite significant. It serves to spatially group
the products with a specific price tag. Taking into ac-
count the co mmon proto col for the loc a tion of each
price tag by product indicated in section 2, an algo-
rithm can assign each detected product instance to a
particular price tag. A case in Figure 6 can be seen,
price tag 6 assigned with the products with purple
colour. T he way to perform this is by first filtering all
the possible price tags by using the product centroid
and the price tags centroid, only the price tags that
Figure 6: P ositioning of the price tags in a shelf.
are at the left and down the cen troid of the product
continue. Then, the minimum Euclidean distance be-
tween each price tag and the product is selected as the
price tag for the product, a nd the pro duct is assigned
to the price tag. This is simple, yet effective to assign
the product detections to labels. It should be noted
that in the case of the hanged products in the shelv ing
hooks, the price tags are on top of the produc t. So the
logic in this algorithm can be mod ified. For products
in the borders th at do not have an assigned price tag,
they will b e discarded on the premise that be ing in the
border of the images, it is likely that a previous, sub-
sequent, spatially h igher or lower collection iteration
contains the complete vision of the product together
to the price tag in order to be assigned correctly.
Towards a Robust Solution for the Supermarket Shelf Audit Problem
917
Estimation of Price Tags Belonging to Gaps. Sim-
ilar to assigning product detection to a rule, in this
case the previously detected gaps will be assigned to
a particular price tag. In the case o f posts, this process
is also valid, however the reader is rem inded that for
spaces with posts, it is more likely that there ar e gaps
that are not actually used for pro ducts. This proc ess
ends by delivering a report of all the ga ps fou nd, the
location (hall) and a n estimation of the product that
can be according to the price tag to which it was as-
signed. This repor t is known as ”stock breaks”.
Validation of Product Listing Assigned to Price
Tag. This process requires as input the list of prod -
ucts per price tag instanc e (best of each cluster ). Each
Product (RBOX) must match the price tag (product
recogn ition o utput vs item recognition output). In
case of having products that do not agree with the
others, they will be used to carry out the report of
Mis-Positioned Products. This report will deliver a
list of the products and their location (spatial) in the
aisle in order to quickly identify and correct the m.
Its output can also be modified to a structure called
a planogram structure. This output is known as the
”real planogram structu re”.
Planogram Validation. This process requires
two planogram data structures as input. The
real planogram structure (EPR) and the exp ected
planogram structure (EPE). The EPR represents what
is real on the premises, while the EPE represents what
should be implemented. I deally, EPR equals EPE,
however stores are likely to make changes mistak-
enly or intentionally. Therefore, the comparison of
these two structures will deliver a percentage value of
planogram compliance. The com parison can be made
accordin g to th e purpose to be measured, be it at a
granular level of product, categories or others.
5 FUTURE WORK
At the moment, the implementatio n of the acquisition
system and datasets have been accomplish gratefully
thanks to a retail company which is interested in repli-
cating this project in many stores. Th e first attempts
to create the ob solete prices report implementing the
light b lue side of Figure 5 has given satisfactory re-
sults, but we will continue working on this for bet-
ter results. Figure 7 shows results of the implementa-
tions.
Additionally, we will be working in parallel in
the hot topic of produ c t de te c tion and recognition for
closing the gaps between the product and the price
tag’s inform ation and location in the shelf.
Figure 7: Results of implementation.
6 CONCLUSIONS
Retail is an important sector whe re AI can help to re-
duce manual and repetitive tasks. To date, AI is ma-
ture enough to be implemented in real world projects.
We proposed a challenging but reachable pipeline to
solve one of the bigg est problems in retail: shelves au-
diting, to help the retail’s operators in their daily tasks
for maintaining the store at it best for customers. Hav-
ing defined a pipeline, future work is to create it a nd
test it. This might sound easy, but it is far from being
the case. There are many complications like creating
the acquisition system or creating agreements w ith re-
tailers to gather data to elaborate, annotate and pub-
lish datasets.
ACKNOWLEDGEMENTS
This work has been partially supported by the
ESPOL-CIDIS-11-2022 project and Tiendas Industri-
ales Asociadas Sociedad Anonima ( TIA S.A.). The
authors would like to acknowledge TIA S. A ., a lead-
ing grocery retailer in Ecuador, for providing access
to an incredible environment for research and testing.
REFERENCES
Chen, F., Z hang, H., Li, Z., Dou, J., Mo, S., Chen, H.,
Zhang, Y., Ahmed, U., Zhu, C., and Savvides, M.
(2022). Unitail: Detecting, reading, and matching i n
retail scene.
Chua, I. S., Gaziel-Yablowitz, M., Korach, Z. T., Kehl,
K. L., Levi tan, N. A., Arriaga, Y. E., Jackson, G. P.,
Bates, D. W., and Hassett, M. (2021). Artificial intel-
ligence in oncology: Path to implementation. Cancer
Medicine, 10(12):4138–4149.
Cilloni, G., Leporati, R., Rizzi, A., and Romagnoli, G.
(2019). State of the art of item-level rfid deployments
in fashion and apparel retail. International Journal of
RF Technologies, 10:65–88. 3-4.
Cochoy, F. and Soutjis, B. (2020). Back to the future of digi-
tal price display: Analyzing patents and other archives
VISAPP 2023 - 18th International Conference on Computer Vision Theory and Applications
918

to understand contemporary market innovations. So-
cial Studies of Science, 50(1):3–29. PMID: 31630628.
Goldman, E., Herzig, R., Eisenschtat, A., Goldberger, J.,
and Hassner, T. (2019a). Precise detection in densely
packed scenes. In Proceedings of the IEEE/CVF Con-
ference on Computer Vision and Pattern Recognition
(CVPR).
Goldman, E., Herzig, R., Eisenschtat, A., Ratzon, O. , Levi,
I., Goldberger, J., and Hassner, T. (2019b).
Jedlickova, B. (2016). Vertical issues arising from conduct
between large supermarket s and small suppliers in the
grocery market: Law and industry codes of conduct.
Khalil, G., Doss, R., and Chowdhury, M. (2020). A novel
rfid-based anti-counterfeiting scheme for retail envi-
ronments. IEEE Access, 8:47952–47962.
Li, B. and Wang, D. (1970). Configuration issues of cashier
staff in supermarket based on queuing theory.
Macenski, S., Foote, T., Gerkey, B. , Lalancette, C ., and
Woodall, W. (2022). Robot operating system 2: De-
sign, architecture, and uses in the wild. Science
Robotics, 7(66):eabm6074.
Patil, D., Patil, S., Patil, S., and Arora, S. (2022). Finan-
cial forecasting of stock market using sentiment anal-
ysis and data analytics. In Nagar, A. K., Jat, D. S.,
Mar´ın-Ravent´os, G., and Mishra, D. K., editors, In-
telligent Sustainable Systems, pages 423–430, Singa-
pore. Springer Nature Singapore.
Pettigrew, S., Mizerski, K., and Donovan, R. (2005). The
three ”big issues” for older supermarket shoppers.
Stanford Artificial Intelligence Laboratory et al. Robotic
operating system.
Tao, F., Wang, L., Fan, T., and Yu, H. (2022). Rfid adoption
strategy in a r et ailer-dominant supply chain with com-
peting suppliers. European Journal of Operational
Research, 302(1):117–129.
Zhang, Q., Liu, Y., Gong, C., Chen, Y., and Yu, H. (2020).
Applications of deep learning for dense scenes analy-
sis in agriculture: A review. Sensors, 20(5).
ˇ
Skiljo, M.,
ˇ
Soli´c, P., Blaˇzevi´c, Z., and Perkovi´c, T. (2020).
Analysis of passive rfid applicability in a retail store:
What can we expect? Sensors, 20(7).
Towards a Robust Solution for the Supermarket Shelf Audit Problem
919
