
Bioimpedance Simulations for the Monitoring of Fluid Overload in Heart
Failure Patients
Alejandro Pliego Prenda
a
, Alberto Olmo
b
, Alberto Yúfera
c
, Santiago F. Scagliusi
d
,
Pablo Pérez
e
and Gloria Huertas
f
Instituto de Microelectrónica de Sevilla, Universidad de Sevilla, Dto. Tecnología Electrónica, ETSII, Seville, Spain
Keywords:
Bioimpedance, Simulation, Cole Model, Dielectric Properties, in Vivo, Frequencies, Heart Failure.
Abstract:
Heart Failure (HF) is a relevant disease that leads to an overload of fluids (edema) that accumulate in the
pulmonary and systemic vascular territory of the patient. The use of bioimpedance measurements have been
proposed for the monitoring of edema in heart failure patients, being necessary to optimize the design of
electrodes systems in medical medices. In our work we present the modelling of the supramalleolar section of
the leg, and finite element simulations of bioimpedance measurements performed to monitor fluid overload in
lower limbs. Results show the similarity of our simulations with performed experiments, and the validity of
our model to study the optimization in the design process of bioimpedance electrodes.
1 INTRODUCTION
Heart Failure (HF) is a major cause of illness, death,
and use of health care resources. Currently, an esti-
mated 64.3 million people are living with heart failure
worldwide (Groenewegen et al., 2020). HF is charac-
terized by symptoms and signs that result from ab-
normalities in cardiac structure and its function. In
most cases, HF is preceded, not by an acute change
in cardiac activity, but by retention of interstitial fluid
which, accumulating in the pulmonary and systemic
vascular territory, results in systemic congestion that
eventually causes organ dysfunction due to hypoper-
fusion (decreased blood flow through an organ) (Ar-
rigo et al., 2020). However, one of the earliest mani-
festations of heart failure is the accumulation of inter-
stitial fluid in the feet and ankles, as these are regions
farther away from the body center, which hinders ve-
nous return, and for this reason, increased ankle vol-
ume is commonly used as a noninvasive indicator of
arterial stiffness which is closely related to heart fail-
ure (Gupta et al., 2014).
The standard assessment of HF (signs and symp-
a
https://orcid.org/0000-0001-8873-7063
b
https://orcid.org/0000-0001-6388-4462
c
https://orcid.org/0000-0002-1814-6089
d
https://orcid.org/0000-0002-5634-5126
e
https://orcid.org/0000-0001-7283-7254
f
https://orcid.org/0000-0001-5851-2576
toms, imaging tests and measurement of natriuretic
peptides) generally does not reliably predict the ap-
pearance of a decompensation. Other methods for
the edema assessment such as the water displace-
ment method are quite reliable, however they are
time-consuming and require the continuous presence
of medical personnel to carry out the measurement
(Brodovicz et al., 2009).
Recently, the electrical bioimpedance of biolog-
ical materials has been widely used for the char-
acterization of cells, tissues and organs, represent-
ing an excellent marker for obtaining information for
medical diagnosis (Khalil et al., 2014), (Ró
˙
zd
˙
zy
´
nska-
´
Swi ˛atkowska et al., 2015).
The use of bioimpedance measurements have
also been proposed for the monitoring of edema in
heart failure patients. Some electronic devices such
as SFB7 (impedimed, 2022) or MoinstureMeterD
(Delfin Technologies, 2022) have been developed to
be able to determine the water content present in bi-
ological tissues by means of bioimpedance measure-
ments, which are non-invasive methods, but their use
is limited to hospitals as they are non-portable de-
vices. In addition, different wearable devices for
the real time monitoring of acute heart fail patients
have been developed and tested (Puertas et al., 2021).
However, it is necessary to perform a thorough study
of the system of electrodes used, in order to optimize
the bioimpedance monitoring of edema evolution, and
identify the possible use in the prognosis of the dis-
164
Prenda, A., Olmo, A., Yúfera, A., Scagliusi, S., Pérez, P. and Huertas, G.
Bioimpedance Simulations for the Monitoring of Fluid Overload in Heart Failure Patients.
DOI: 10.5220/0011744700003414
In Proceedings of the 16th International Joint Conference on Biomedical Engineering Systems and Technologies (BIOSTEC 2023) - Volume 1: BIODEVICES, pages 164-168
ISBN: 978-989-758-631-6; ISSN: 2184-4305
Copyright
c
2023 by SCITEPRESS – Science and Technology Publications, Lda. Under CC license (CC BY-NC-ND 4.0)

ease.
In our work, we study a specific configuration of
electrodes for the monitoring of fluid overload with
bioimpedance measurements. We model the supra-
malleolar section of the leg, and perform finite ele-
ment simulations of the volume increase due to fluid
accumulation in the extracellular space of muscle tis-
sue (edema), in order to verify the applicability of the
technique and the optimal range of frequencies. A
bioimpedance 4 electrodes system is studied, in or-
der to compare the simulations performed with the
electrical measurements presented in (Puertas et al.,
2021), and validate the utility of our model.
2 MATERIALS AND METHODS
The geometry of the model is based on an idealisation
of the problem, assuming the supramalleolar segment
of the leg as a succession of symmetrical, 15 cm high,
cylinders with the same axis of symmetry. Each one
of these cylinders corresponds to a different type of
tissue and, therefore, their width must obey to a real-
istic physiological ratio.
For this reason, a radius of 10 mm has been taken
to characterise the bone tissue, 25 mm thick for the
muscle tissue, 5 mm thick for the adipose (fat) tis-
sue and 1 mm thick to characterise the dermis (skin)
layer. For these values, a study carried out in COM-
SOL on body thermostimulation was used as a refer-
ence (Kocbach et al., 2011). In addition, a distinction
is made between two different regions of the bone due
to their resistive characteristics: the cortical bone re-
gion, which is more external and 2 mm thick, and the
cancellous bone, with a radius of 8 mm, which is con-
tained inside the previous region (Du et al., 2018). Fi-
nally, four cylinder shaped electrodes with a radius of
5 mm and a height of 1 mm will stay over the skin,
placed at the vertices of a rectangle with 6 cm high
and 3.5 cm wide.
On the other hand, the electrodes material has
been considered to be 304 stainless steel, because this
is the most common type of steel, whose conduc-
tivity and relative permittivity are respectively σ =
1.39 · 10
6
S/m and ε
r
= 1.008 (MatWeb, 2022) prac-
tically constant for all frequencies.
The Cole-Cole equation shows, for a material, its
complex relative permittivity (
ˆ
ε) as the sum of several
terms: the relative permittivity at high frequencies
(ε
∞
), the sum of complex relative permittivity for each
dispersion region (frequency ranges over which con-
ductivity and permittivity are practically linear) and
the term associated with the static ionic conductivity
(Gabriel et al., 1996).
ˆ
ε(ω) = ε
∞
+
4
∑
n=1
∆ε
n
1 + ( jωτ
n
)
(1−α
n
)
+
σ
i
jωε
0
(1)
Where ∆ε
n
, τ
n
and α
n
are respectively the range
of permittivities, the time constant and the distribu-
tion parameter for each relaxation region. σ
i
is the
static ionic conductivity of the material and ε
0
is the
vacuum permittivity. The above data can be found in
Table 1.
ε
r
(ω) = ℜ(
ˆ
ε(ω)) (2)
σ(ω) = ε
0
ωℑ(
ˆ
ε(ω)) (3)
Complex relative permittivity
ˆ
ε(ω) obtained by
(1) contains a material information about its relative
permittivity ε
r
(ω) (real part) and its electrical conduc-
tivity σ(ω) (proportional to the imaginary part) for
any frequency value.
The implementation of the physics requires the
use of the electrical current package provided by
COMSOL. Two of the electrodes were set with a nor-
mal current density J
n
to the surface such that the cur-
rent I supplied to the body was 0.1 and −0.1 mA, tak-
ing into account the radius of the electrode according
to (3), where r is the radius.
Another electrode was connected to ground (V =
0) to measure on the remaining electrode. The electri-
cal isolation of the whole system as well as the con-
servation of current must also be taken into account,
since it is assumed that the system is electrically iso-
lated from the external medium. This simulation has
been studied for a set of frequencies with 17 measure-
ments between 10 Hz and 1000 kHz.
J
n
=
I
πr
2
(4)
Finally, an extremely fine mesh is selected, i.e.
where the tetrahedra on which the equations of the
physical system will be solved will be very small, in
order to obtain the results as accurately as possible.
In the study following to the creation of the COM-
SOL simulation, the surface integral of the current
density at an electrode with initial current conditions
is taken. With this data, the actual current and the
surface integral of the voltage (divided by the area of
the electrode), can be obtained to get the voltage V .
Then, knowing the current and voltage, it is possible
to obtain the bioimpedance measurement, and sepa-
rate its data into the resistance R and the reactance X,
values with which to plot the Cole diagram, showing
the reactance versus resistance values of the system
for a given frequency range.
V
I
= Z = R + jX (5)
Bioimpedance Simulations for the Monitoring of Fluid Overload in Heart Failure Patients
165
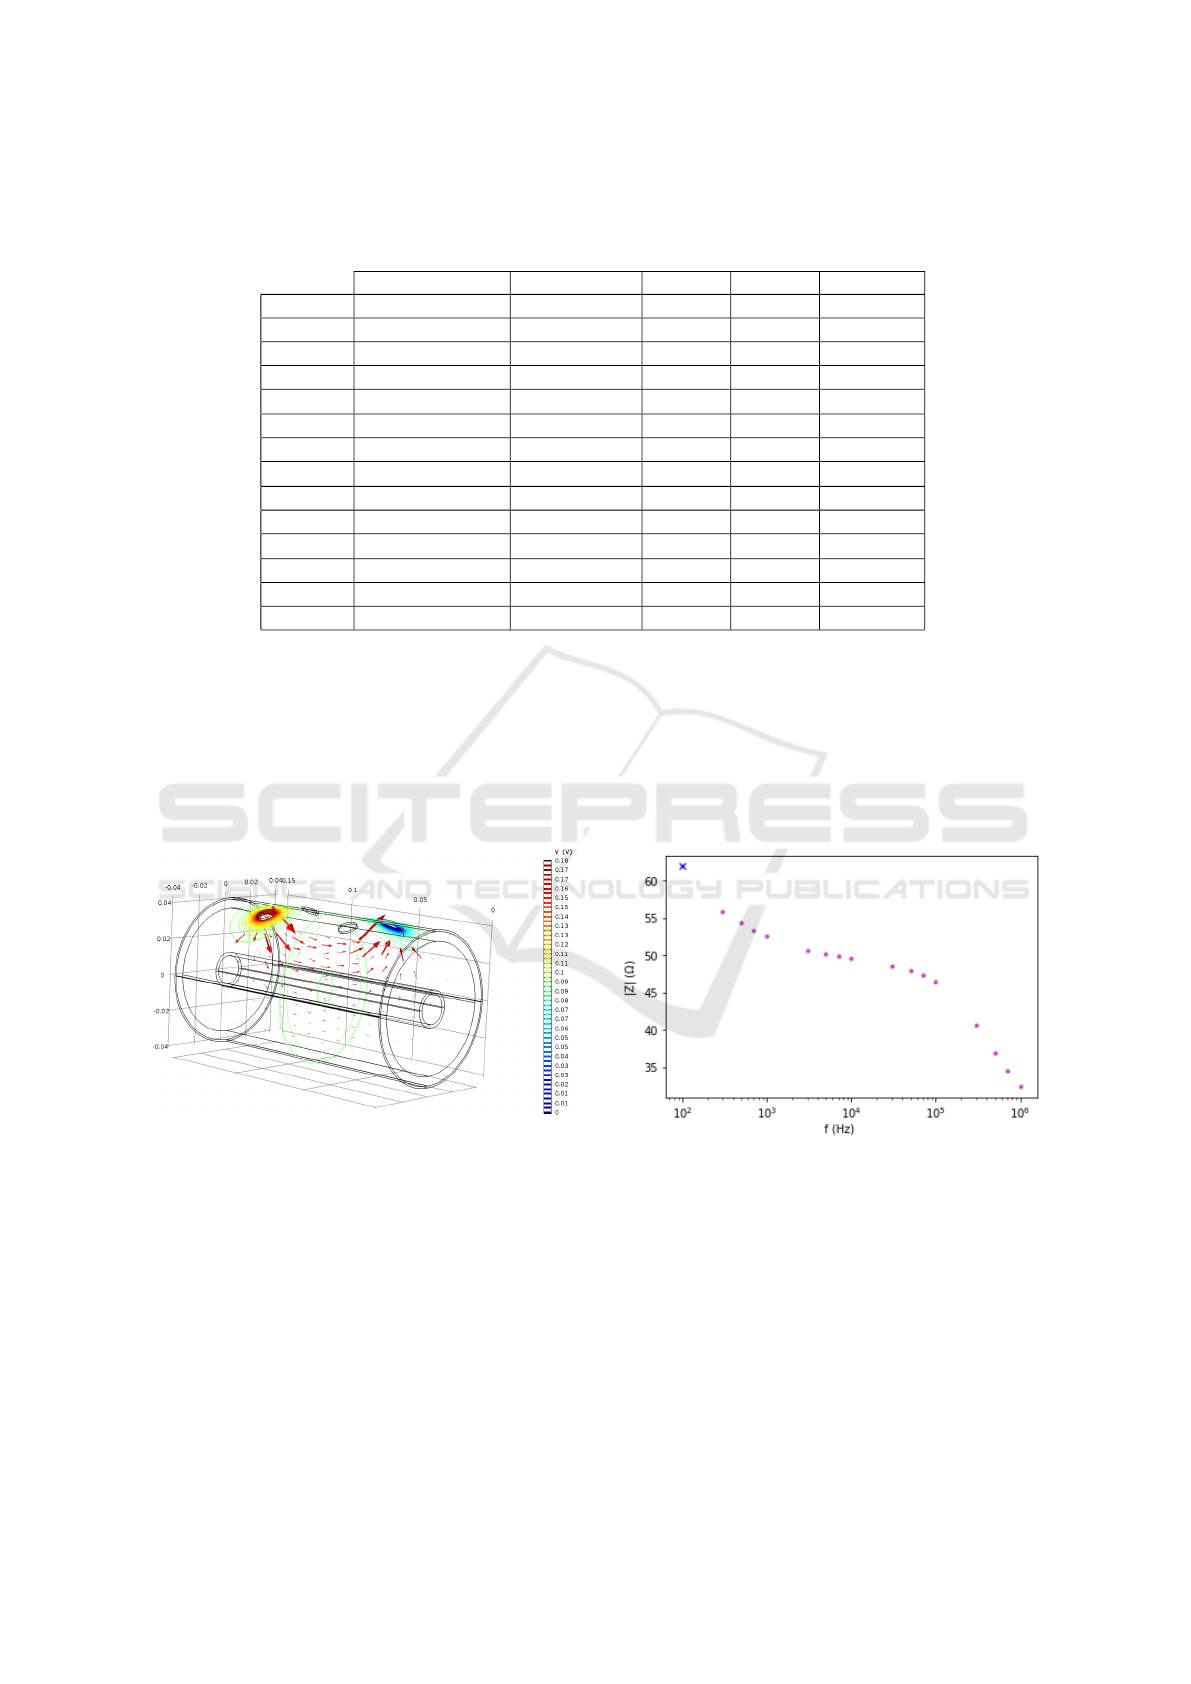
Table 1: Data for each material for the relative permittivity at high frequencies ε
∞
, the static ionic conductivity σ
i
and, for
each one of the scattering regions, the range of permittivities ∆ε
n
, the time constant τ
n
and the distribution parameter α
n
. Of
all the tissue materials available in (Ró
˙
zd
˙
zy
´
nska-
´
Swi ˛atkowska et al., 2015), the following materials have been selected: for
fat, non-infiltrated over infiltrated, and for skin, dry over wet.
Cancellous bone Cortical bone Muscle Fat Skin (dry)
ε
∞
2.5 2.5 4.0 2.5 4.0
∆ε
1
18.0 10.0 50.0 3.0 32.0
τ
1
(ps) 13.26 13.26 7.23 7.96 7.23
α
1
0.22 0.20 0.10 0.20 0.00
∆ε
2
300 180 7 · 10
3
15 1100
τ
2
(ns) 79.58 79.58 353.68 15.92 32.48
α
2
0.25 0.20 0.10 0.10 0.20
∆ε
3
2.0· 10
4
5.0· 10
3
1.2· 10
6
3.3· 10
4
0.0
τ
3
(µs) 159.15 159.15 318.31 159.15
α
3
0.20 0.20 0.10 0.05
∆ε
4
2.0· 10
7
1.0· 10
5
2.5· 10
7
1.0· 10
7
0.0
τ
4
(ms) 15.915 15.915 2.274 7.958
α
4
0.00 0.00 0.00 0.01
σ
i
(S/m) 0.0700 0.0200 0.2000 0.0100 0.0002
3 RESULTS
In Figure 1, a representation of the equipotential
lines for the electric field denoted in coloured lines
is shown, with the direction and relative intensity of
the electric current marked with red arrows.
Figure 1: Equipotential lines for the electric field.
The result shown in Figure 1 is consistent with
what would be expected. A current that is transmitted
mainly through the most superficial layers of the an-
kle, but which penetrates down to the muscle, avoid-
ing the cortical bone region, through which practi-
cally no current circulates since, given its low con-
ductivity, it acts practically as an electrical insulator.
According with the stipulations of the procedure,
the voltage and current data and their associated
impedance for the different frequency values at which
this current is supplied are shown in Table 2.
The different impedance values obtained for the
different frequencies are shown in Figure 2. The Cole
diagram (Figure 3) of the system is obtained by plot-
ting the imaginary part (with opposite sign) against
the real part of the impedance for different frequency
values (Puertas et al., 2021).
Figure 2: Impedance vs frequency sweep.
The Cole diagram (Figure 3) shows the typical
semicircle characterising the material, but with a pro-
longation on the right part, corresponding to lower
frequencies. This prolongation (corresponding to fre-
quencies from 1 Hz to 5 kHz in our simulations) is not
shown in empirical data (Puertas et al., 2021), where
a lower frequency of 1 kHz was used. We can also see
a general increase in the simulated values respect the
experimental ones. Based on empirical data obtained
from in vivo tests on healthy individuals, the semi-
circle should form in a range of resistances between
BIODEVICES 2023 - 16th International Conference on Biomedical Electronics and Devices
166
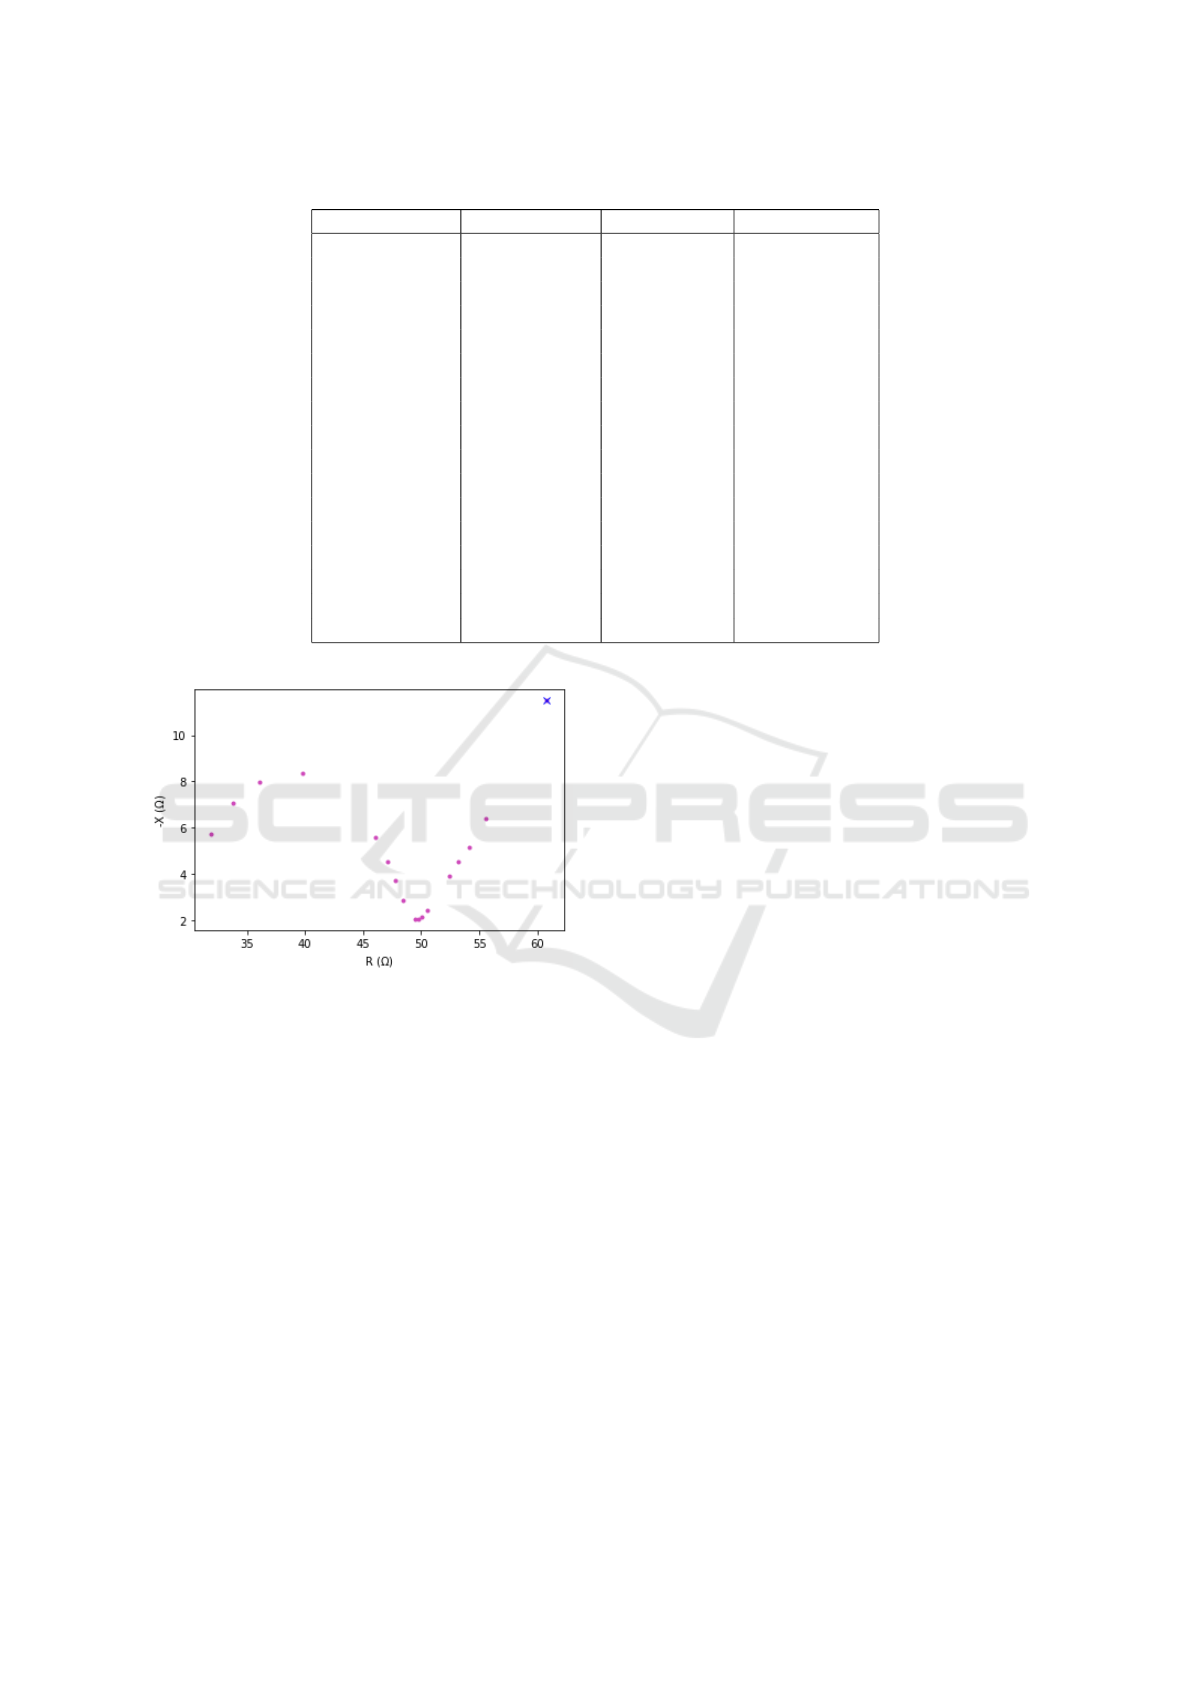
Table 2: Values of voltage (V ), current (I) and impedance (Z) for different frequencies ( f ) obtained by simulation.
Frequency (Hz) Voltage (mV) Current (mA) Impedance (Ω)
1 · 10
2
−6.10+ 1.12 j −0.1002 60.83− 11.49 j
3 · 10
2
−5.57+ 0.64 j −0.1002 55.54− 6.39 j
5 · 10
2
−5.43+ 0.52 j −0.1002 54.12− 5.17 j
7 · 10
2
−5.33+ 0.45 j −0.1002 53.39− 4.52 j
1 · 10
3
−5.25+ 0.39 j −0.1002 52.39− 3.92 j
3 · 10
3
−5.07+ 0.24 j −0.1002 50.46− 2.43 j
5 · 10
3
−5.02+ 0.21 j −0.1002 50.07− 2.17 j
7 · 10
3
−4.99+ 0.21 j −0.1002 49.78− 2.06 j
1 · 10
4
−4.96+ 0.21 j −0.1002 49.49− 2.06 j
3 · 10
4
−4.86+ 0.28 j −0.1002 48.47− 2.84 j
5 · 10
4
−4.79+ 0.37 j −0.1002 47.76− 3.73 j
7 · 10
4
−4.72+ 0.45 j −0.1002 47.08− 4.55 j
1 · 10
5
−4.62+ 0.56 j −0.1002 46.05− 5.60 j
3 · 10
5
−4.00+ 0.83 j −0.1002 39.80− 8.34 j
5 · 10
5
−3.62+ 0.79 j −0.1002 36.04− 7.95 j
7 · 10
5
−3.40+ 0.71 j −0.1002 33.84− 7.08 j
1 · 10
6
−3.21+ 0.57 j −0.1002 31.90− 5.74 j
Figure 3: Cole diagram.
35 and 60 Ω (Puertas et al., 2021). This range is rel-
atively close to the one obtained in our simulations,
validating the use of the implemented model for these
studies.
4 CONCLUSIONS
In our work we propose the use of finite element sim-
ulations for the study of the monitoring of fluid over-
load with bioimpedance measurements in heart fail-
ure patients. We have modelled the supramalleolar
section of the leg, and performed finite element sim-
ulations for the bioimpedance measurements of the 4
electrode system used in (Puertas et al., 2021).
Results show a similar behaviour with the Cole-
Cole model, being only different at lower frequen-
cies. The differences with respect to performed ex-
periments may derive from an excess of idealization
when constructing the model, where perfect contact
between the skin and the electrodes is assumed and
spatial differences due to the asymmetry of the real
leg are not taken into account. On the one hand, it
would be necessary to continue working on improve-
ments to the model to make it more realistic, but on
the other hand, we believe it is necessary to have more
clinical trials that could provide useful measuring for
experimental development.
The supramalleolar section of the leg model pre-
sented can be an interesting model to simulate dif-
ferent types of electrode systems, and optimize the
design of wearable electrodes for the monitoring of
fluid overload in heart failure patients. The use of
the ankle for measuring is advantageous compared to
measurements taken on the whole body or on other
body segments, since the onset of peripheral edema
(as a precursor of HF) is earlier in the lower extrem-
ities of the body and the ankle is also a comfortable
and discreet area to carry a measuring device all day
long, thus allowing for continuous monitoring of the
patient.
Simulation works like ours can be really useful,
not only for this device, but also to improve the de-
sign of other bioimpedance measuring instruments,
allowing to study the most optimal shape and arrange-
ment of the electrodes before designing the prototype,
which will give better results.
Bioimpedance Simulations for the Monitoring of Fluid Overload in Heart Failure Patients
167

5 FUTURE STEPS
The presented model proves that it is possible to
model bioimpedance measurements using the finite
element method and lays the groundwork for future
biomedical device modeling. Our long-term goals
are, firstly, to continue with the cylindrical model, as
it is a simple way to correlate the increase in volume
due to swelling by fluid accumulation with the effect
on the measured bioimpedance, but on the other hand,
we also aim to move towards more realistic models,
where we are considering using cross-sectional im-
ages of the ankle section or even three-dimensional
tomographies of the leg, so that we can carry out stud-
ies thanks to which we can even indicate the best way
of placing the measuring device, taking into account
the proximity of the bones, the fat accumulation in a
certain area or other factors. However, our most im-
mediate objective is to validate the data obtained from
the simulation with experimental results, so that we
can be sure that the model adjusts to the behavior of
the device on healthy individuals and, subsequently,
on diseased patients.
ACKNOWLEDGEMENTS
This work was supported by the Spanish-funded
project: “PRototipado y Ensayo CLÍnico del nuevo
dispositivo portátil HFvolum para la monitorización
en tiempo real de volúmenes en pacientes con in-
suficiencia cardiaca (PRECLI-HF)”, AT 21_00010,
funded by Junta de Andalucía – Consejería de Trans-
formación Económica, Industria, Conocimiento y
Universidades.
REFERENCES
Arrigo, M., Jessup, M., Mullens, W., Reza, N., Shah, A. M.,
Sliwa, K., and Mebazaa, A. (2020). Acute heart fail-
ure. Nature Reviews Disease Primers, 6(1):1–15.
Brodovicz, K. G., McNaughton, K., Uemura, N.,
Meininger, G., Girman, C. J., and Yale, S. H. (2009).
Reliability and feasibility of methods to quantitatively
assess peripheral edema. Clinical medicine & re-
search, 7(1-2):21–31.
Delfin Technologies (2022). https://delfintech.com/ mois-
turemeterd.
Du, W., Zhang, J., and Hu, J. (2018). A method to deter-
mine cortical bone thickness of human femur and tibia
using clinical ct scans. In 2018 IRCOBI conference
proceedings, Athens (Greece), pages 403–412.
Gabriel, S., Lau, R., and Gabriel, C. (1996). The dielectric
properties of biological tissues: Iii. parametric mod-
els for the dielectric spectrum of tissues. Physics in
medicine & biology, 41(11):2271.
Groenewegen, A., Rutten, F. H., Mosterd, A., and Hoes,
A. W. (2020). Epidemiology of heart failure. Euro-
pean journal of heart failure, 22(8):1342–1356.
Gupta, D. K., Skali, H., Claggett, B., Kasabov, R., Cheng,
S., Shah, A. M., Loehr, L. R., Heiss, G., Nambi, V.,
Aguilar, D., et al. (2014). Heart failure risk across
the spectrum of ankle-brachial index: the aric study
(atherosclerosis risk in communities). JACC: Heart
Failure, 2(5):447–454.
impedimed (2022). https://www.impedimed.com/ sfb7.
Khalil, S. F., Mohktar, M. S., and Ibrahim, F. (2014). The
theory and fundamentals of bioimpedance analysis in
clinical status monitoring and diagnosis of diseases.
Sensors, 14(6):10895–10928.
Kocbach, J., Folgerø, K., Mohn, L., and Brix, O. (2011).
A simulation approach to optimizing performance of
equipment for thermostimulation of muscle tissue us-
ing comsol multiphysics. Biophysics and Bioengi-
neering Letters, 4(2):9–33.
MatWeb (2022). http://www.matweb.com/ AISI type 304
stainless steel.
Puertas, M., Giménez, L., Pérez, A., Scagliusi, S. F., Pérez,
P., Olmo, A., Huertas, G., Medrano, J., and Yúfera,
A. (2021). Modeling edema evolution with electrical
bioimpedance: Application to heart failure patients.
In 2021 XXXVI Conference on Design of Circuits and
Integrated Systems (DCIS), pages 1–6. IEEE.
Ró
˙
zd
˙
zy
´
nska-
´
Swi ˛atkowska, A., Jurkiewicz, E., and Tylki-
Szyma
´
nska, A. (2015). Bioimpedance analysis as a
method to evaluate the proportion of fatty and muscle
tissues in progressive myopathy in pompe disease. In
JIMD Reports, Volume 26, pages 45–51. Springer.
BIODEVICES 2023 - 16th International Conference on Biomedical Electronics and Devices
168
