
Leveraging Explainability with K-Fold Feature Selection
Artur J. Ferreira
1,2,3 a
and M
´
ario A. T. Figueiredo
1,2,3 b
1
ISEL, Instituto Superior de Engenharia de Lisboa, Instituto Polit
´
ecnico de Lisboa, Portugal
2
IST, Instituto Superior T
´
ecnico, Universidade de Lisboa, Portugal
3
Instituto de Telecomunicac¸
˜
oes, Lisboa, Portugal
fi
Keywords:
Cancer Detection, Classification, k-Fold Data Split, Explainability, Feature Selection, Leave-One-Out.
Abstract:
Learning with high-dimensional (HD) data poses many challenges, since the large number of features often
yields redundancy and irrelevance issues, which may decrease the performance of machine learning (ML)
methods. Often, when learning with HD data, one resorts to feature selection (FS) approaches to avoid the
curse of dimensionality. The use of FS may improve the results, but its use by itself does not lead to explain-
ability, in the sense of identifying the small subset of core features that most influence the prediction of the
ML model, which can still be seen as a black-box. In this paper, we propose k-fold feature selection (KFFS),
which is a FS approach to shed some light into that black-box, by resorting to the k-fold data partition proce-
dure and one generic unsupervised or supervised FS filter. KFFS finds small and decisive subsets of features
for a classification task, at the expense of increased computation time. On HD data, KFFS finds small subsets
of features, with dimensionality small enough to be analyzed by human experts (e.g, a medical doctor in a
cancer detection problem). It also provides classification models with lower error rate and fewer features than
those provided by the use of the individual supervised FS filter.
1 INTRODUCTION
The use of machine learning (ML) techniques has
been proven successful for different problems. How-
ever, there are still many challenges and open prob-
lems. One that is worthy of attention is feature selec-
tion (FS), which is to find the best set of features for a
given ML model and task (Guyon et al., 2006; Guyon
and Elisseeff, 2003). Despite its long research his-
tory and the emergence of deep learning techniques,
which minimize the need to perform a separate fea-
ture extraction and selection phase, many efforts still
continue within the research for adequate FS tech-
niques (Alipoor et al., 2022; Chamlal et al., 2022;
Huynh-Cam et al., 2022; Jeon and Hwang, 2023; Xu
et al., 2022). When learning with high-dimensional
(HD) data, performing FS becomes a challenge, due
to the curse of dimensionality (Bishop, 1995). The use
of FS improves the results, but its standard use may
not be enough to achieve explainability, in the sense
of identifying the smallest subset of features that most
influence the prediction results of the ML model, on a
given task.
As ML models become more complex, the re-
a
https://orcid.org/0000-0002-6508-0932
b
https://orcid.org/0000-0002-0970-7745
search community has gained interest in their ex-
plainability (Hanif et al., 2021; Tjoa and Guan, 2021;
Xu et al., 2019). Explainable artificial intelligence
(XAI)-based methods are growing in popularity. In
this work, explainability refers to the identification of
the subset of features that is the most decisive for a su-
pervised classification task. The interpretation, that is
the determination of the connection between the cause
(the feature) and the effect (the prediction), is left to
the human expert on the field of the dataset (for in-
stance, a medical doctor for cancer detection).
In this paper, we propose k-fold feature selection
(KFFS), a FS filter approach to leverage the results
of any unsupervised or supervised FS filter. We re-
sort to the k-fold data partition procedure to assess
which features are chosen more often. KFFS shows
improvement as compared to the use of the individual
FS filter. The remainder of this paper is organized as
follows. In Section 2, we overview the state-of-the-
art in FS techniques and explainability on supervised
classification. The proposed approach is described in
Section 3. The experimental evaluation is reported in
Section 4. Finally, Section 5 ends the paper with some
concluding remarks and directions of future work.
458
Ferreira, A. and Figueiredo, M.
Leveraging Explainability with K-Fold Feature Selection.
DOI: 10.5220/0011744400003411
In Proceedings of the 12th International Conference on Pattern Recognition Applications and Methods (ICPRAM 2023), pages 458-465
ISBN: 978-989-758-626-2; ISSN: 2184-4313
Copyright
c
2023 by SCITEPRESS – Science and Technology Publications, Lda. Under CC license (CC BY-NC-ND 4.0)

2 RELATED WORK
In this section, we review related work on the key as-
pects of FS techniques over the past years, as well
as some existing approaches to provide explainability
for classification models. In Subsection 2.1, we de-
scribe the key notation followed in this paper. Subsec-
tion 2.2 overviews the filter FS technique addressed in
the experimental evaluation. Finally, Subsection 2.3
refers to recent works on explainable models.
2.1 Notation and Terminology
Let X = {x
1
,... ,x
n
} be a dataset, with n pat-
terns/instances/examples, on a n × d matrix, in which
the rows hold the patterns and the columns are the
features. Each pattern x
i
is a d−dimensional vector,
where d is the number of features/attributes/variables,
designated as X
i
, with i ∈ {0, .. ., d − 1}. Let
C denote the number of distinct class labels, with
c
i
∈ {1,. .. ,C} denoting the class of pattern i and
y = {c
1
,. .. ,c
n
} is the set of class labels correspond-
ing to the n patterns.
2.2 Feature Selection Filters
It is well-known that the use of FS techniques usu-
ally improves the accuracy of a classifier learnt from
data and allows for faster training. Another benefit
of FS is that it mitigates the effects of the curse of di-
mensionality. Over the past decades, researchers have
come up with many different FS algorithms, which
are usually placed into one of four categories (Guyon
et al., 2006): wrappers; embedded; filters; hybrid.
For recent surveys on FS techniques see the publica-
tions by Remeseiro and Bolon-Canedo (2019),Pudji-
hartono et al. (2022), and Dhal and Azad (2022).
In this work, we focus on filter methods which as-
sess the goodness of a given subset of features using
characteristics of that subset, without resorting to a
specific learning algorithm. These approaches keep
some features and discard others, based on some cri-
terion, which is independent of the subsequent learn-
ing algorithm. Filters are the simplest and fastest
approach, thus one would expect that these meth-
ods would perform worse than the other approaches.
However, in many big-data and HD scenarios, filter
approaches are often the only applicable choice.
Some successful FS filters follow the relevance-
redundacy (RR) framework (Yu and Liu, 2003). In a
nutshell, the RR framework is based on the idea that a
dataset is composed by (weakly or strongly) relevant,
redundant, and non-redundant features. The FS meth-
ods aim to find the most relevant and non-redundant
features. In this work, we consider the use of the fast
correlation-based filter (FCBF), proposed by Yu and
Liu (2003, 2004). FCBF computes feature-class and
feature-feature correlations. It starts by selecting a
set of features that is highly correlated with the class,
with a correlation value above some threshold set by
the user. The features with higher correlation with
the class are called predominant, in the first step. This
correlation is assessed by the symmetrical uncertainty
(SU) (Yu and Liu, 2003) measure, defined as
SU(X
i
,X
j
) =
2I(X
i
;X
j
)
H(X
i
) + H(X
j
)
, (1)
where H(.) denotes the Shannon entropy and I(.)
denotes the mutual information (MI) (Cover and
Thomas, 2006). The SU is zero for independent ran-
dom variables and equal to one for deterministically
dependent random variables, i.e., if one is a bijective
function of the other. In the second step, a redundancy
detection procedure finds redundant features among
the predominant ones. The set of redundant features is
further split in order to remove the redundant ones and
keep those that are the most relevant to the class. In
order to remove the redundant features, three heuristic
criteria are applied.
2.3 Explainability and Interpretability
In recent years, there has been interest in addressing
techniques to provide explainability and interpretabil-
ity (Lou et al., 2013; Ribeiro et al., 2016; Bastani
et al., 2017; Kim et al., 2018; Mothilal et al., 2020;
Lakkaraju and Bastani, 2020). This interest has in-
creased mainly due to the need to interpret deep learn-
ing models, due to their size, complexity, and opacity.
One famous approach is SHapley Additive ex-
Planations (SHAP), a game-theoretic method to ex-
plain the output of any ML model. It connects op-
timal credit allocation with local explanations using
Shapley values, a notion imported from cooperative
game theory. The SHAP values provide insights into
the importance of each feature. A general method
to obtain representative SHAP values was proposed
by Scheda and Diciotti (2022), using nested cross-
validation (CV).
Another approach is local interpretable model-
agnostic explanations) (LIME) (Ribeiro et al., 2016),
which explains the predictions of any classifier with
an interpretable model, locally around the prediction.
The explainable boosting machine (EBM) (Lou et al.,
2013) is a tree-based, cyclic gradient boosting gener-
alized additive model with automatic interaction de-
tection. An EBM model is often as accurate as state-
of-the-art black-box models, while remaining com-
pletely interpretable. Although EBM are often slower
Leveraging Explainability with K-Fold Feature Selection
459

to train than other algorithms, they are extremely
compact and fast at prediction time.
Regarding cancer detection explainability Moor-
thy and Mohamad (2011) proposed a random forest
(RF) method that performs both FS and classification
of microarray data. It aims to find the smallest pos-
sible sets of genes (features) with lowest error rates.
Rostami et al. (2022) introduced a FS method that in-
tegrates the concept of node centrality and commu-
nity detection. That method selects a subset of genes
with the lowest similarity and highest dependency,
showing improvement as compared to previous ap-
proaches.
Another approach for explainability is knowledge
distillation (KD), which transfers knowledge from a
large model to a smaller one (Bastani et al., 2017).
The large model acts as the black-box or teacher. The
smaller model is the explainer or student. Thus, the
student model is learned to imitate the behavior of the
teacher, while being interpretable.
The hybrid FS algorithm filter-dominating hybrid
sequential forward floating search (FDHSFFS) was
proposed by Gan et al. (2014). Qi et al. (2019)
use FDHSFFS embedded with CV methods on four
datasets with dimensionality ranging from 32 to 528
features. They found large differences in the resulting
feature subspace dimensionality, concluding that 2-
fold CV and leave-one-out (LOO) CV are more suit-
able for evaluation with low-dimensional and small
sample datasets, and 10-fold nested CV and 10-fold
CV are more adequate for HD datasets.
In recent work, Szepannek and L
¨
ubke (2022) ad-
dress the partial dependence plots (PDP), which is a
model-agnostic assessment of each feature effect on
the model response. The authors address the degree of
model explainability in a forensic problem extending
the concept of explainability to the multiclass case.
3 PROPOSED APPROACH
In this section, we describe our proposed approach.
First, we state the key ideas that are the basis of
our proposal and then we present it in an algorithmic
style. For a dataset with n instances and d features,
these key ideas are as follows:
• Use of the k-fold data partition procedure with
varying values of k, which can be taken into the
extreme value of n instances, yielding a leave-
one-out (LOO) data partition.
• Apply a generic unsupervised or supervised FS
filter k times (once per fold, on the training data
subset).
• Set an array of d global counters (one per feature)
with the number of times that each feature is cho-
sen on the k folds.
• Keep the features with counters above some
threshold T
h
and discard the others.
• The importance of a feature is proportional to the
number of times it is chosen, on the k folds, by the
FS filter.
We expect that different samplings of the training data
with a FS filter may identify the features that provide
explainability of the data. Features that are chosen
more often will have more impact on the average ML
model performance. Algorithm 1 details KFFS.
4 EXPERIMENTAL EVALUATION
In this section, we report the experimental evaluation
of the proposed method. Subsection 4.1 describes
the public domain datasets along with their respective
tasks as well as the experimental settings. In Sub-
section 4.2, we analyze the behavior of KFFS as a
function of its parameters. Subsection 4.3 reports ex-
perimental results for explainability with cancer de-
tection datasets, while in Subsection 4.4 we address
all the datasets. Finally, Subsection 4.5 discusses the
key findings of the experimental evaluation.
4.1 Datasets and Settings
Table 1 summarizes the main characteristics of the
microarray datasets used in this work. In this table,
we have gathered datasets from different problems,
some with low-dimensionality and the majority with
high-dimensionality. We have included many cancer
detection datasets, since this is an application sce-
nario in which the proposed approach can be poten-
tially most useful. These datasets can be obtained
from different public repositories, such as the Uni-
versity of California at Irvine (UCI) https://archive.
ics.uci.edu/ml/index.php, knowledge extraction evo-
lutionary learning (KEEL), https://sci2s.ugr.es/keel/
datasets.php, and https://csse.szu.edu.cn/staff/zhuzx/
Datasets.html.
Many of these datasets have more features than
instances, that is, n ≪ d, leading to challenging situ-
ations for ML techniques (Bishop, 1995), which are
the ones that we intend to address with KFFS. We
use the FCBF implementation of the Arizona State
University (ASU) repository, https://jundongl.github.
io/scikit-feature/ with its default parameters. The lin-
ear support vector machines (SVM) and the na
¨
ıve
Bayes (NB) classifiers from the Waikato environment
ICPRAM 2023 - 12th International Conference on Pattern Recognition Applications and Methods
460

Algorithm 1: k-Fold Feature Selection (KFFS) for unsupervised or supervised FS.
Input: X: n × d matrix, n patterns of a d-dimensional dataset.
@ f ilter : a FS filter (unsupervised or supervised).
k : an integer stating the number of folds (k ∈ {2,. . .,n}).
T
h
: a threshold (percentage) to chose the number of features.
y : n× 1 class label vector (necessary only in case of a FS supervised filter).
Output: idx: m−dimensional vector with the indexes of the selected features.
1: Allocate the feature counter vector (FCV ), with dimensions 1 × d, such that each position refers to a specific feature.
2: Initialize FCV
i
= 0, with i ∈ {0,.. .,d − 1}.
3: Compute the k data folds in the dataset (different splits into training and test data).
4: For each fold, apply @ f ilter on the training data and update FCV
i
with the number of times @ f ilter selects feature i.
5: After the k data folds are processed, convert FCV to percentage: FCVP ← FCV/k.
6: Keep the indexes of the features that have been selected at least T
h
times (expressed in percentage), idx ← FCVP ≥ T
h
.
7: Return idx (the vector with the indexes of the selected features that have been selected at least T
h
times).
for knowledge analysis (WEKA) tool are used in the
experiments. The evaluation metrics are the test-set
error rate, using LOOCV and the running time of the
FS algorithms. We also perform some statistical sig-
nificance tests to the error rate.
The experiments were carried out in MATLAB
R2018a, on a laptop computer running Windows 10
(64 bit), with 16 GB of RAM and a CPU with 1.7
GHz clock frequency.
4.2 Sensitivity Analysis
In this subsection, we analyze the behavior of KFFS
as functions of its parameters. First, we analyze the
percentage of the number of times a feature is cho-
sen on the LOO procedure by the FCBF filter. Fig-
ure 1 shows these values for the Dermatology and
Colon datasets. On the Dermatology dataset, we ob-
Table 1: Datasets with n instances, d features, and C classes.
Name n d C Problem
Brain-Tumor-1 90 5920 5 Cancer detection
Brain-Tumor-2 50 10367 4 Cancer detection
CLL-SUB-11 111 11340 3 Leukemia detection
Colon 62 2000 2 Cancer detection
Dermatology 358 34 6 Skin disease detection
DLBCL 77 5469 2 Detect B-cell malignancies
GLA-BRA-180 180 49151 4 Glioma grade analysis
GLI-85 85 22283 2 Glioma detection
Hepatitis 155 19 2 Hepatitis survival
Ionosphere 351 34 2 Radio detection
Leukemia 72 7129 2 Leukemia detection
Leukemia-1 72 5328 3 Leukemia detection
Leukemia-2 72 11226 3 Leukemia detection
Libras 360 90 15 Hand movement type
Lymphoma 96 4026 9 Lymphoma detection
Prostate-Tumor 102 10509 2 Prostate tumor detection
SMK-CAN-187 187 19993 2 Lung cancer detection
Sonar 208 60 2 Distinguish sonar signals
SRBCT 83 2308 4 Cancer detection
TOX-171 171 5748 4 Brain tumor detection
Wine 178 13 3 Three wine cultivars
serve that FCBF never selects 13 features in any of the
n = 358 folds. On the n folds, FCBF has selected at
least once 21 features. However, some of these fea-
tures have a small percentage of choice over all the
folds (say, for instance features 9 and 22). For the
Colon dataset, on the n = 62 folds, FCBF selects at
least once 62 features and never selects 1938 features.
We now check the impact of changing the thresh-
old T
h
, for fixed k = n. Figure 2 shows on the left yy-
axis the test-set error rate as a function of the thresh-
old T
h
for the DLBCL dataset, with the SVM classi-
fier. We display the baseline error (no FS, Err=2.60%)
and the error rate attained by FCBF (Err=2.60%) as
well as the average number of features per fold, m =
66. For KFFS, we have considered T
h
∈ {1, .. ., 100}
with @filter=FCBF and k = n. This figure also shows
the average number of selected features m for KFFS,
as functions of the threshold, on the right yy-axis.
As expected, as the threshold increases KFFS selects
fewer features. For T
h
= 80, KFFS attains lower error
rate than the baseline, using m = 48 features. Thus, it
is able to reduce the dimensionality from d = 5469 to
m = 48, with lower error rate and fewer features, as
compared to the single use of FCBF.
We now check on the effect of the choice of the
number of folds k used by KFFS, with threshold T
h
=
40. The range of values considered is k ∈ {2, .. ., 10},
with independent tests for each value of k. Figure 3
(top) shows the test set error rate attained by baseline,
FCBF, and KFFS with FCBF and the number of fea-
tures m per fold, on the Prostate-Tumor dataset. On
the bottom of the figure, we display the running time
of KFFS as a function of k. Regarding the error rate,
using different values of k leads to adequate values,
since there we find several values of k that yield bet-
ter results than those of the baseline and FCBF meth-
ods. The increase of k leads to a linear increase on the
running time, as expected.
Leveraging Explainability with K-Fold Feature Selection
461
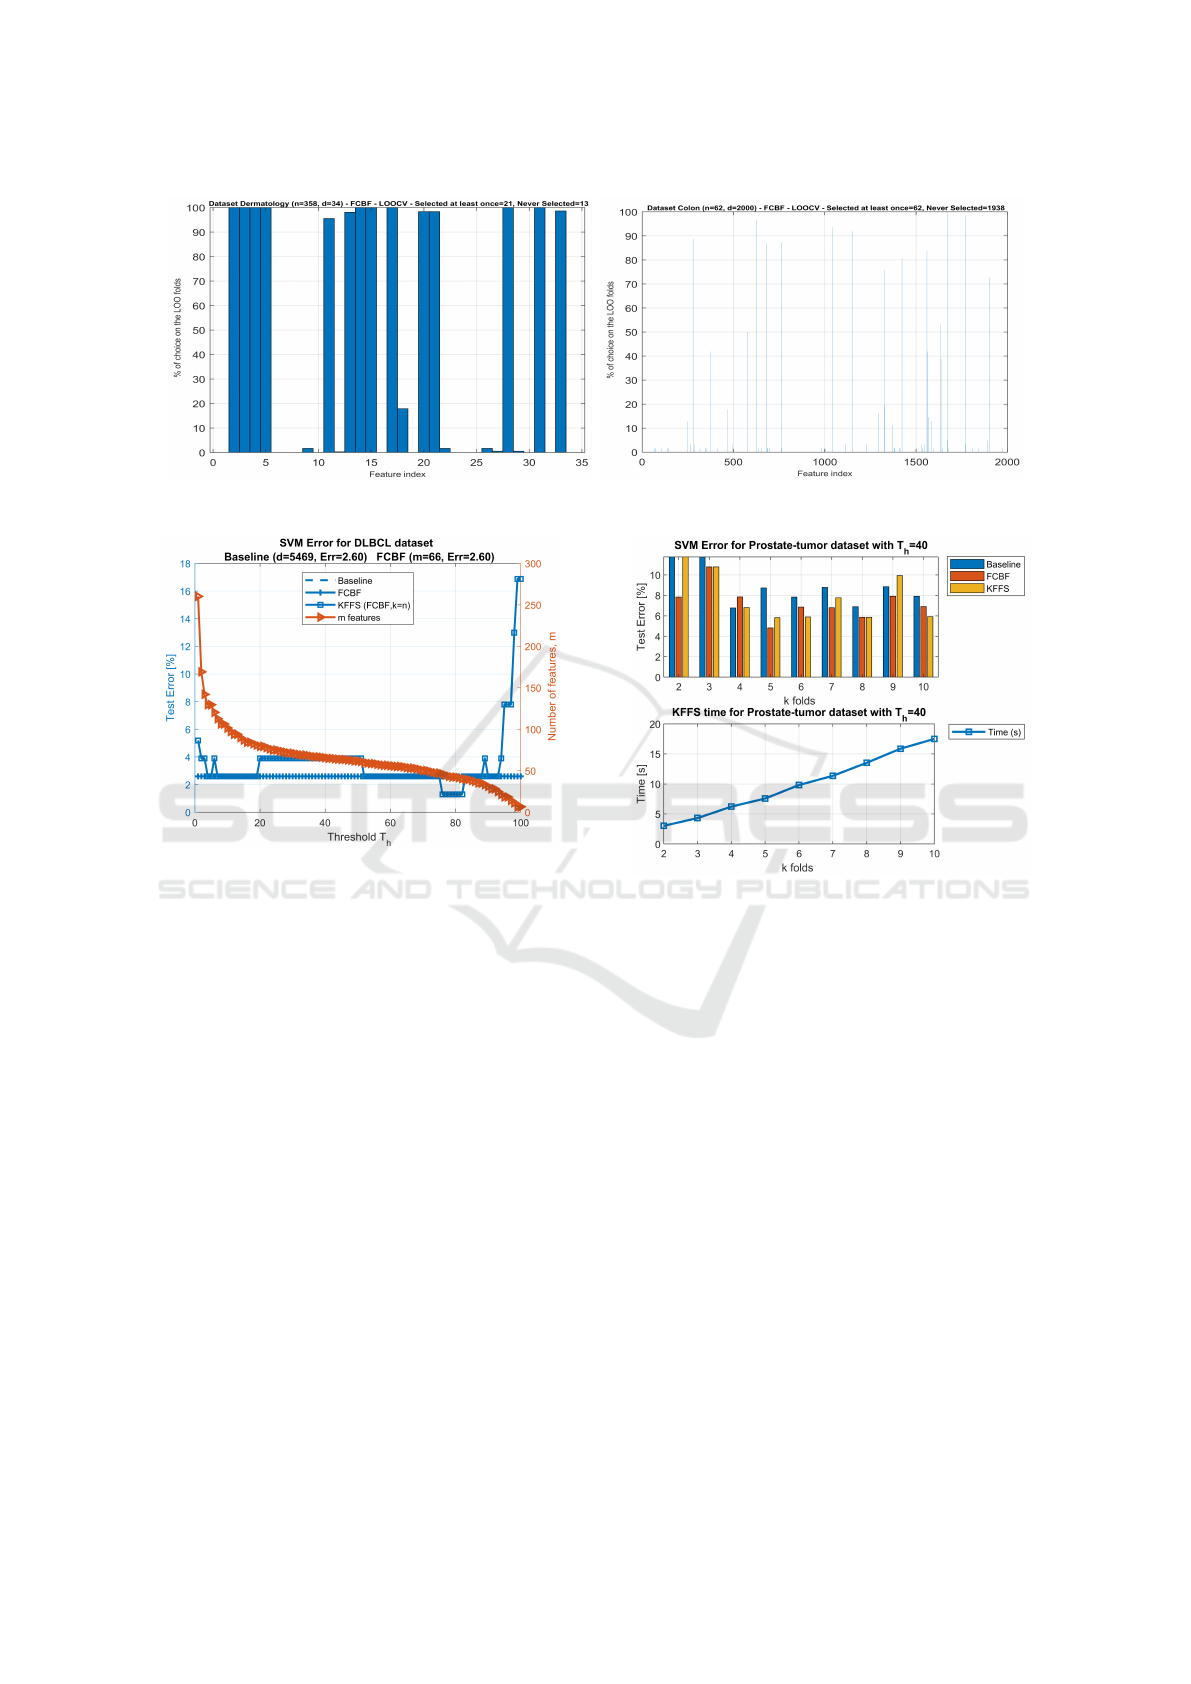
Figure 1: Percentage of choice for each feature by FCBF with the LOO procedure on the Dermatology and Colon datasets.
Figure 2: Test set error rate for baseline (no FS), FCBF, and
KFFS (with @filter=FCBF and k = n) with the SVM classi-
fier on the DLBCL dataset (left yy-axis) as a function of the
threshold T
h
∈ {1,..., 100}. Number of selected features,
m, as a function of the threshold (right yy-axis).
4.3 Cancer Detection and Explainability
Using KFFS with FCBF we apply Algorithm 1, with
k = n, and varying threshold values in the range of
the integers from 1 to 100, to identify the smallest
subset of features with the lower error for cancer de-
tection. For each one of the outputs provided by Al-
gorithm 1 (the idx vector), we use the SVM classifier
with LOOCV and evaluate the generalization error.
Then, we identify the threshold that leads to the low-
est Err using fewer features. The experimental results
are reported in Table 2 and show that, when time is
not a constraint, KFFS finds quite small subsets of
features to provide explainability for cancer detection
data. For all datasets, except Leukemia-1 and TOX-
171, the error rate decreases with the KFFS algorithm.
For all datasets, we get a large decrease on the dimen-
sionality, leading to a human-manageable number of
features. In many cases, the generalization error on
the reduced subspace is much lower than on the orig-
Figure 3: On top, the test set error rate (Err, in %) for
baseline, FCBF, KFFS (with @filter=FCBF and T
h
= 40)
with the SVM classifier on the Prostate-Tumor dataset, for
k ∈ {2, ..., 10}. On bottom, the running time of KFFS in
seconds, as a function of k.
inal space, leveraging the explainability of the data.
The human experts will then provide interpretability
on the causes (features) that lead to a given conse-
quence regarding the presence/absence of cancer and
the type of cancer (classification).
4.4 Evaluation with All Datasets
In this subsection, we report the experimental results
of KFFS with the FCBF filter and k = n, that is, Algo-
rithm 1 with the LOO procedure. Table 3 presents,
for each dataset, the estimates of the error rate of
the linear SVM classifier for the baseline case (no
FS) and for the FCBF use. We also apply KFFS us-
ing FCBF with threshold T
h
∈ {40,50, 60,70, 80}.
In most cases, KFFS yields an improvement of the
results of the FCBF filter. In many cases, the use
of FCBF under the KFFS framework leads to a sig-
nificant reduction on the dimensionality of the data.
ICPRAM 2023 - 12th International Conference on Pattern Recognition Applications and Methods
462

For instance, with T
h
= 60 on the Leukemia-2 dataset
(which has d = 11226), we get m = 61 with Err=0%.
These 61 features would serve to explain leukemia de-
tection and to distinguish between different types of
leukemia (for this dataset, c = 3). These experimental
results also show that the KFFS approach seems to be
preferable for HD datasets. In terms of average error
rate for all datasets, the KFFS algorithm with FCBF
and T
h
= 40 achieves the best results.
Table 4 reports a similar test as in Table 3, now us-
ing the NB classifier. Again, using the NB classifier,
we observe a dramatic reduction on the dimensional-
ity and a statistical significant decrease on the clas-
sification error. In terms of average error rate for all
datasets, the KFFS algorithm with FCBF and T
h
= 40
achieves the best results.
4.5 Discussion
We have found that the output of KFFS is sensitive to
the setting of the threshold parameter. In many HD
datasets, by choosing appropriate thresholds, KFFS
can lead to smaller subsets of features with lower er-
ror than both the baseline version and the one pro-
vided by the use of FCBF. Regarding the number of
folds, k, we have found that the running time of the
algorithm increases linearly with it. For k = 10, i.e.
feature assessment with 10-fold CV in KFFS, we at-
tain adequate results with many datasets. Even with
Table 2: The lower Err (with LOOCV) with fewer features
(m) and the best threshold T
h
found by KFFS (with k = n
and @ f ilter =FCBF), on cancer detection datasets. The
evaluation is performed with the SVM classifier, with vary-
ing thresholds T
h
∈ {1,2, . ..,100}. For the error rates,
the Friedman test p-value is p = 0.0075 (≤ 0.05), and the
paired-sample t-test is t = 0.0013 (≤ 0.05), thus having sta-
tistical significance.
Baseline SVM KFFS (FCBF, k = n)
Dataset d Err Best T
h
m Err
Brain-Tumor-1 5920 10.00 20 132 5.56
Brain-Tumor-2 10367 22.00 78 32 10.00
CLL-SUB-11 11340 18.92 17 125 5.41
Colon 2000 17.74 83 9 12.90
DLBCL 5469 2.60 89 36 0.00
GLA-BRA-180 49151 27.22 93 24 17.78
GLI-85 22283 8.24 99 9 3.53
Leukemia 7129 1.39 88 24 0.00
Leukemia-1 5327 2.78 2 157 4.17
Leukemia-2 11225 4.17 87 36 0.00
Lymphoma 4026 4.17 82 177 2.08
Prostate-Tumor 10509 8.82 100 11 3.92
SMK-CAN-187 19993 27.27 54 39 20.32
SRBCT 2308 0.00 87 42 0.00
TOX-171 5748 0.00 1 291 1.17
Average 11519.67 10.35 – 76.27 5.79
values lower than 10, KFFS yields adequate results in
some datasets, with fast computation time. In generic
terms, as k tends to n, we assure the best results to-
wards the joint minimization of the size of the sub-
set of features and the generalization error rate, at the
expense of additional computation time. For cancer
detection datasets, our approach is able to find small
subsets of features with very low generalization er-
ror. The resulting size of these subsets allows them to
be interpreted and analyzed by humans. In this case,
time is not the key factor to be considered, since the
aim is to identify the features that explain cancer clas-
sification. On the evaluation of the methods, we also
have found that the use of LOOCV provides better
estimates than those with 10-fold CV.
5 CONCLUSIONS
Learning with high-dimensional data is a challenging
task. High-dimensional feature spaces pose many dif-
ficulties that can be mitigated by using feature selec-
tion techniques. In some problems, it is important to
achieve accuracy in classification but it is also impor-
tant to provide means to explain and interpret the de-
cisions taken by the learned models.
In this paper, we proposed a technique that is
able to successfully perform feature selection on high-
dimensional data and to significantly reduce its di-
mensionality. The technique finds feature subspaces
small enough to be interpreted by a human user (e.g.
a clinical expert, for cancer detection). We resort to
a feature selection filter and the k-fold data partition
procedure. After the k-fold procedure is carried out,
we analyze the fraction of times that each feature is
chosen. The larger this fraction, the more important
that feature is ranked. As compared to the standard
use of one filter, our approach can be seen as adding
counters to the selection of each feature, and then
post-processing those counters to find values above
a threshold to output the final subset of features.
The experimental results on a large number of
datasets with different problems, show that the pro-
posed approach can leverage the results of one sin-
gle filter, by choosing an appropriate threshold, at the
expense of computation time. The extra time taken
in our procedure is the trade-off to find these human
manageable and interpretable feature subsets.
As future work, we intend to compare our pro-
posal with the permutation feature importance tech-
nique. We also plan to combine different filters to ex-
plore the use of union and intersection of the feature
subspaces, provided by each filter.
Leveraging Explainability with K-Fold Feature Selection
463

Table 3: The average number of features (m) and the average test error rate (Err, %) with the linear SVM classifier with
LOOCV, using FCBF and KFFS, with thresholds T
h
∈ {40, 50,60,70,80}. The best result (lower Err with fewer features,
m) in bold face. Regarding the error rates, the Friedman test p-value is p = 9.3161 × 10
−8
(≤ 0.05), thus having statistical
significance.
KFFS using FCBF (k = n)
Baseline SVM FCBF only T
h
= 40 T
h
= 50 T
h
= 60 T
h
= 70 T
h
= 80
Dataset d Err m Err m Err m Err m Err m Err m Err
Brain-Tumor-1 5920 10.00 108.8 15.56 107.0 6.67 101.0 6.67 95.0 7.78 72.0 8.89 51.0 11.11
Brain-Tumor-2 10367 22.00 76.1 20.00 69.0 10.00 62.0 8.00 51.0 8.00 40.0 6.00 31.0 12.00
CLL-SUB-11 11340 18.92 79.9 32.43 76.0 9.91 63.0 13.51 52.0 16.22 44.0 12.61 41.0 14.41
Colon 2000 17.74 14.7 17.74 16.0 9.68 14.0 11.29 12.0 12.90 12.0 12.90 10.0 12.90
Dermatology 34 2.51 14.1 3.91 14.0 3.07 14.0 3.07 14.0 3.07 14.0 3.07 14.0 3.07
DLBCL 5469 2.60 66.5 2.60 63.0 2.60 61.0 2.60 58.0 2.60 56.0 2.60 44.0 2.60
GLA-BRA-180 49151 27.22 173.4 32.22 167.0 21.11 139.0 22.22 112.0 22.78 92.0 22.22 62.0 20.00
GLI-85 22283 8.24 132.6 11.76 132.0 3.53 116.0 4.71 103.0 5.88 88.0 5.88 72.0 5.88
Hepatitis 19 24.52 6.9 20.00 7.0 19.35 7.0 19.35 7.0 19.35 7.0 19.35 7.0 19.35
Ionosphere 34 11.97 4.1 16.81 4.0 16.81 4.0 16.81 4.0 16.81 4.0 16.81 4.0 16.81
Leukemia 7129 1.39 50.6 2.78 51.0 1.39 49.0 1.39 47.0 1.39 44.0 0.00 35.0 1.39
Leukemia-1 5327 2.78 50.4 8.33 48.0 5.56 43.0 5.56 42.0 5.56 37.0 6.94 27.0 5.56
Leukemia-2 11225 4.17 81.3 2.78 83.0 0.00 75.0 0.00 61.0 0.00 53.0 1.39 42.0 1.39
Libras 90 26.67 9.9 42.78 10.0 41.67 10.0 41.67 10.0 41.67 10.0 41.67 10.0 41.67
Lymphoma 4026 4.17 273.7 4.17 272.0 2.08 256.0 3.13 238.0 3.13 218.0 3.13 188.0 2.08
Prostate-Tumor 10509 8.82 71.8 7.84 73.0 5.88 61.0 6.86 55.0 6.86 52.0 5.88 45.0 7.84
SMK-CAN-187 19993 27.27 49.9 32.09 51.0 22.99 41.0 20.32 34.0 25.13 30.0 22.99 26.0 24.60
Sonar 60 22.60 10.0 22.60 12.0 22.12 10.0 21.63 8.0 25.00 8.0 25.00 8.0 25.00
SRBCT 2308 0.00 79.3 0.00 82.0 0.00 78.0 0.00 74.0 0.00 68.0 0.00 59.0 0.00
TOX-171 5748 0.00 83.7 8.77 85.0 4.68 76.0 4.09 67.0 4.68 58.0 4.68 51.0 7.60
Wine 13 1.12 10.0 0.56 10.0 0.56 10.0 0.56 10.0 0.56 10.0 0.56 10.0 0.56
Average 8240.24 11.65 68.94 14.56 68.19 9.98 61.43 10.16 54.95 10.92 48.43 10.60 39.86 11.23
Table 4: The average number of features (m) and the average test error rate (Err, %) with the NB classifier with LOOCV,
using FCBF and KFFS, with thresholds T
h
∈ {40,50,60,70,80}. Best result (lower Err with fewer features, m) in bold face.
Regarding the error rates, the Friedman test p-value is p = 2.2414 × 10
−6
(≤ 0.05), thus having statistical significance.
KFFS using FCBF (k = n)
Baseline NB FCBF only T
h
= 40 T
h
= 50 T
h
= 60 T
h
= 70 T
h
= 80
Dataset d Err m Err m Err m Err m Err m Err m Err
Brain-Tumor-1 5920 10.00 108.8 15.56 107.0 8.89 101.0 8.89 95.0 10.00 72.0 10.00 51.0 13.33
Brain-Tumor-2 10367 30.00 76.1 30.00 69.0 12.00 62.0 12.00 51.0 12.00 40.0 16.00 31.0 14.00
CLL-SUB-11 11340 32.43 79.9 28.83 76.0 14.41 63.0 14.41 52.0 13.51 44.0 14.41 41.0 15.32
Colon 2000 41.94 14.7 22.58 16.0 16.13 14.0 16.13 12.0 14.52 12.0 14.52 10.0 14.52
Dermatology 34 2.51 14.1 3.91 14.0 3.63 14.0 3.63 14.0 3.63 14.0 3.63 14.0 3.63
DLBCL 5469 18.18 66.5 6.49 63.0 3.90 61.0 3.90 58.0 3.90 56.0 3.90 44.0 2.60
GLA-BRA-180 49151 32.22 173.4 33.33 167.0 19.44 139.0 21.11 112.0 19.44 92.0 20.00 62.0 18.33
GLI-85 22283 17.65 132.6 17.65 132.0 5.88 116.0 5.88 103.0 7.06 88.0 4.71 72.0 4.71
Hepatitis 19 15.48 6.9 16.13 7.0 16.77 7.0 16.77 7.0 16.77 7.0 16.77 7.0 16.77
Ionosphere 34 17.38 4.1 11.11 4.0 10.26 4.0 10.26 4.0 10.26 4.0 10.26 4.0 10.26
Leukemia 7129 0.00 50.6 4.17 51.0 0.00 49.0 0.00 47.0 0.00 44.0 0.00 35.0 1.39
Leukemia-1 5327 4.17 50.4 4.17 48.0 4.17 43.0 4.17 42.0 4.17 37.0 4.17 27.0 4.17
Leukemia-2 11225 6.94 81.3 4.17 83.0 1.39 75.0 1.39 61.0 2.78 53.0 2.78 42.0 2.78
Libras 90 35.83 9.9 36.67 10.0 35.56 10.0 35.56 10.0 35.56 10.0 35.56 10.0 35.56
Lymphoma 4026 23.96 273.7 19.79 272.0 14.58 256.0 14.58 238.0 13.54 218.0 13.54 188.0 14.58
Prostate-Tumor 10509 37.25 71.8 7.84 73.0 7.84 61.0 6.86 55.0 6.86 52.0 6.86 45.0 5.88
SMK-CAN-187 19993 39.57 49.9 32.09 51.0 25.13 41.0 26.20 34.0 24.06 30.0 21.93 26.0 23.53
Sonar 60 32.69 10.0 28.85 12.0 31.73 10.0 28.85 8.0 32.69 8.0 32.69 8.0 32.69
SRBCT 2308 0.00 79.3 1.20 82.0 1.20 78.0 1.20 74.0 1.20 68.0 1.20 59.0 1.20
TOX-171 5748 22.81 83.7 22.22 85.0 6.43 76.0 8.77 67.0 10.53 58.0 12.28 51.0 13.45
Wine 13 2.25 10.0 2.25 10.0 2.25 10.0 2.25 10.0 2.25 10.0 2.25 10.0 2.25
Average 8240.24 20.16 68.94 16.62 68.19 11.50 61.43 11.56 54.95 11.65 48.43 11.78 39.86 11.95
ICPRAM 2023 - 12th International Conference on Pattern Recognition Applications and Methods
464

REFERENCES
Alipoor, G., Mirbagheri, S., Moosavi, S., and Cruz, S.
(2022). Incipient detection of stator inter-turn short-
circuit faults in a doubly-fed induction generator using
deep learning. IET Electric Power Applications.
Bastani, O., Kim, C., and Bastani, H. (2017). Interpret-
ing blackbox models via model extraction. ArXiv,
abs/1705.08504.
Bishop, C. (1995). Neural Networks for Pattern Recogni-
tion. Oxford University Press.
Chamlal, H., Ouaderhman, T., and Rebbah, F. (2022). A hy-
brid feature selection approach for microarray datasets
using graph theoretic-based method. Information Sci-
ences, 615:449–474.
Cover, T. and Thomas, J. (2006). Elements of information
theory. John Wiley & Sons, second edition.
Dhal, P. and Azad, C. (2022). A comprehensive survey on
feature selection in the various fields of machine learn-
ing. Applied Intelligence, 52(4):4543–45810.
Gan, J. Q., Awwad Shiekh Hasan, B., and Tsui, C. S. L.
(2014). A filter-dominating hybrid sequential forward
floating search method for feature subset selection in
high-dimensional space. International Journal of Ma-
chine Learning and Cybernetics, 5(3):413–423.
Guyon, I. and Elisseeff, A. (2003). An introduction to vari-
able and feature selection. Journal of Machine Learn-
ing Research (JMLR), 3:1157–1182.
Guyon, I., Gunn, S., Nikravesh, M., and Zadeh (Editors), L.
(2006). Feature extraction, foundations and applica-
tions. Springer.
Hanif, A., Zhang, X., and Wood, S. (2021). A survey
on explainable artificial intelligence techniques and
challenges. In IEEE 25th International Enterprise
Distributed Object Computing Workshop (EDOCW),
pages 81–89.
Huynh-Cam, T.-T., Nalluri, V., Chen, L.-S., and Yang, Y.-
Y. (2022). IS-DT: A new feature selection method for
determining the important features in programmatic
buying. Big Data and Cognitive Computing, 6(4).
Jeon, Y. and Hwang, G. (2023). Feature selection with
scalable variational gaussian process via sensitivity
analysis based on L2 divergence. Neurocomputing,
518:577–592.
Kim, B., Wattenberg, M., Gilmer, J., Cai, C., Wexler, J.,
Vi
´
egas, F., and Sayres, R. (2018). Interpretability
beyond feature attribution: Quantitative testing with
concept activation vectors (tcav). In Dy, J. G. and
Krause, A., editors, ICML, volume 80 of Proceedings
of Machine Learning Research, pages 2673–2682.
PMLR.
Lakkaraju, H. and Bastani, O. (2020). How do I fool you?
manipulating user trust via misleading black box ex-
planations. Proceedings of the AAAI/ACM Conference
on AI, Ethics, and Society, pages 79–85.
Lou, Y., Caruana, R., Gehrke, J., and Hooker, G. (2013).
Accurate intelligible models with pairwise interac-
tions. In Dhillon, I. S., Koren, Y., Ghani, R., Sen-
ator, T. E., Bradley, P., Parekh, R., He, J., Gross-
man, R. L., and Uthurusamy, R., editors, The 19th
ACM SIGKDD International Conference on Knowl-
edge Discovery and Data Mining, KDD, Chicago, IL,
USA, pages 623–631. ACM.
Moorthy, K. and Mohamad, M. (2011). Random forest
for gene selection and microarray data classification.
Bioinformation, 7(3):142–146.
Mothilal, R., Sharma, A., and Tan, C. (2020). Explain-
ing machine learning classifiers through diverse coun-
terfactual explanations. In Proceedings of the 2020
Conference on Fairness, Accountability, and Trans-
parency, pages 607–617. ACM.
Pudjihartono, N., Fadason, T., Kempa-Liehr, A., and
O’Sullivan, J. (2022). A review of feature selection
methods for machine learning-based disease risk pre-
diction. Frontiers in Bioinformatics, 2:927312.
Qi, C., Diao, J., and Qiu, L. (2019). On estimating model in
feature selection with cross-validation. IEEE Access,
7:33454–33463.
Remeseiro, B. and Bolon-Canedo, V. (2019). A review
of feature selection methods in medical applications.
Computers in Biology and Medicine, 112:103375.
Ribeiro, M. T., Singh, S., and Guestrin, C. (2016). Why
should I trust you? explaining the predictions of any
classifier. In HLT-NAACL Demos, pages 97–101. The
Association for Computational Linguistics.
Rostami, M., Forouzandeh, S., Berahmand, K., Soltani, M.,
Shahsavari, M., and Oussalah, M. (2022). Gene se-
lection for microarray data classification via multi-
objective graph theoretic-based method. Artificial In-
telligence in Medicine, 123:102228.
Scheda, R. and Diciotti, S. (2022). Explanations of machine
learning models in repeated nested cross-validation:
An application in age prediction using brain complex-
ity features. Applied Sciences, 12(13).
Szepannek, G. and L
¨
ubke, K. (2022). Explaining artificial
intelligence with care. KI - K
¨
unstliche Intelligenz.
Tjoa, E. and Guan, C. (2021). A survey on explainable ar-
tificial intelligence (xai): Toward medical xai. IEEE
transactions on neural networks and learning systems,
32(11):4793—4813.
Xu, F., Uszkoreit, H., Du, Y., Fan, W., Zhao, D., and Zhu,
J. (2019). Explainable ai: A brief survey on history,
research areas, approaches and challenges. In Natural
Language Processing and Chinese Computing.
Xu, Y., Liu, Y., and Ma, J. (2022). Detection and de-
fense against DDoS attack on SDN controller based
on feature selection. In Chen, X., Huang, X., and
Kutyłowski, M., editors, Security and Privacy in So-
cial Networks and Big Data, pages 247–263, Singa-
pore. Springer Nature Singapore.
Yu, L. and Liu, H. (2003). Feature selection for high-
dimensional data: a fast correlation-based filter solu-
tion. In Proceedings of the International Conference
on Machine Learning (ICML), pages 856–863.
Yu, L. and Liu, H. (2004). Efficient feature selection via
analysis of relevance and redundancy. Journal of Ma-
chine Learning Research (JMLR), 5:1205–1224.
Leveraging Explainability with K-Fold Feature Selection
465
