Seeing Risk of Accident from In-Vehicle Cameras
Takuya Goto, Fumihiko Sakaue and Jun Sato
Nagoya Institute of Technology, Nagoya 466-8555, Japan
{goto@cv., sakaue@, junsato@}nitech.ac.jp
Keywords:
Traffic Accident Prediction, Accident Risk, Risk Visualization, Instance Segmentation, Lane Detection.
Abstract:
In this paper, we propose a method for visualizing the risk of car accidents in in-vehicle camera images by
using deep learning. Our network predicts the future risk of car accidents and generates a risk map image that
represents the degree of accident risk at each point in the image. For training our network, we need pairs of
in-vehicle images and risk map images, but such datasets do not exist and are very difficult to create. In this
research, we derive a method for computing the degree of the future risk of car accidents at each point in the
image and use it for constructing the training dataset. By using the dataset, our network learns to generate risk
map images from in-vehicle images. The efficiency of our method is tested by using real car accident images.
1 INTRODUCTION
In recent years, automated driving and driver assis-
tance systems for automobiles have advanced rapidly,
and advanced safety systems that use cameras for ob-
ject recognition and collision avoidance have been de-
veloped actively. Furthermore, methods for predict-
ing traffic accidents have also been proposed in recent
years (Suzuki et al., 2018; Corcoran and Clark, 2019;
Yao et al., 2019; Bao et al., 2020). However, these
methods can only estimate the risk of the entire scene
in the image, and they cannot map the risk for each
pixel. That is, these methods cannot visualize the risk
in the image.
Thus, we in this paper propose a method for esti-
mating accident risk per pixel and generating risk map
images by using deep learning. Our method takes an
RGB video image as input and uses time series ad-
versarial learning to obtain an image that represents
where in the image the accident poses a danger to
one’s own vehicle. By using our network, the acci-
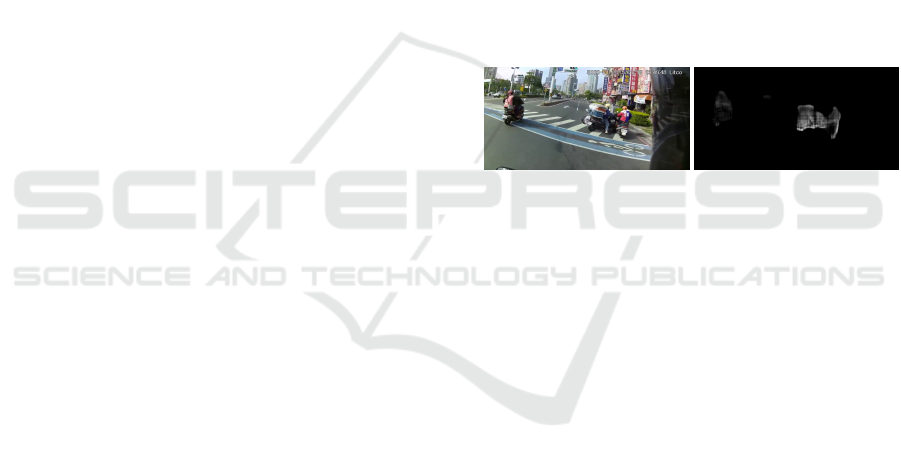
dent risk map shown in Figure 1 (b) is generated from
the RGB image shown in Figure 1 (a).
However, there is no dataset in which camera im-
ages correspond to accident risk maps. In this re-
search, we first propose a method for computing the
degree of the future risk of car accidents at each point
in the image and use it for constructing a training
dataset that consists of pairs of in-vehicle images and
risk map images. We next propose a network that gen-
erates risk map images from in-vehicle images and
train it with the constructed dataset. In order to gen-
erate sequential risk map images from sequential in-
(a) input image (b) risk map image (our
result)
Figure 1: Accident risk map (b) estimated from in-vehicle
image (a) using the proposed method.
vehicle camera images, we develop a network based
on vid2vid (Wang et al., 2018a), a model that extends
cGAN to video sequences. We combine semantic seg-
mentation obtained from PCAN (Ke et al., 2021) and
optic flow obtained from flownet2 (Ilg et al., 2017)
with vid2vid for generating accurate sequential risk
map images from sequential in-vehicle camera im-
ages.
In general, we can say that an object approaching
our vehicle is dangerous, as in the case of car-to-car
accidents and car-to-pedestrian accidents. However,
vehicles approaching our vehicle in other lanes, such
as an oncoming vehicle in another lane, pose little
danger. Therefore, we in this research define a new
measure of future accident risk and compute it for
each point in the image.
There are many different types of in-vehicle cam-
eras and they have different camera parameters. Thus,
the degree of future accident risk must be able to be
computed from images taken by cameras with differ-
ent camera parameters. Therefore, we define a new
measure of future accident risk so that it is invariant
to the camera parameters. Then, we generate risk map
672
Goto, T., Sakaue, F. and Sato, J.
Seeing Risk of Accident from In-Vehicle Cameras.
DOI: 10.5220/0011743900003417
In Proceedings of the 18th International Joint Conference on Computer Vision, Imaging and Computer Graphics Theory and Applications (VISIGRAPP 2023) - Volume 4: VISAPP, pages
672-679
ISBN: 978-989-758-634-7; ISSN: 2184-4321
Copyright
c
2023 by SCITEPRESS – Science and Technology Publications, Lda. Under CC license (CC BY-NC-ND 4.0)
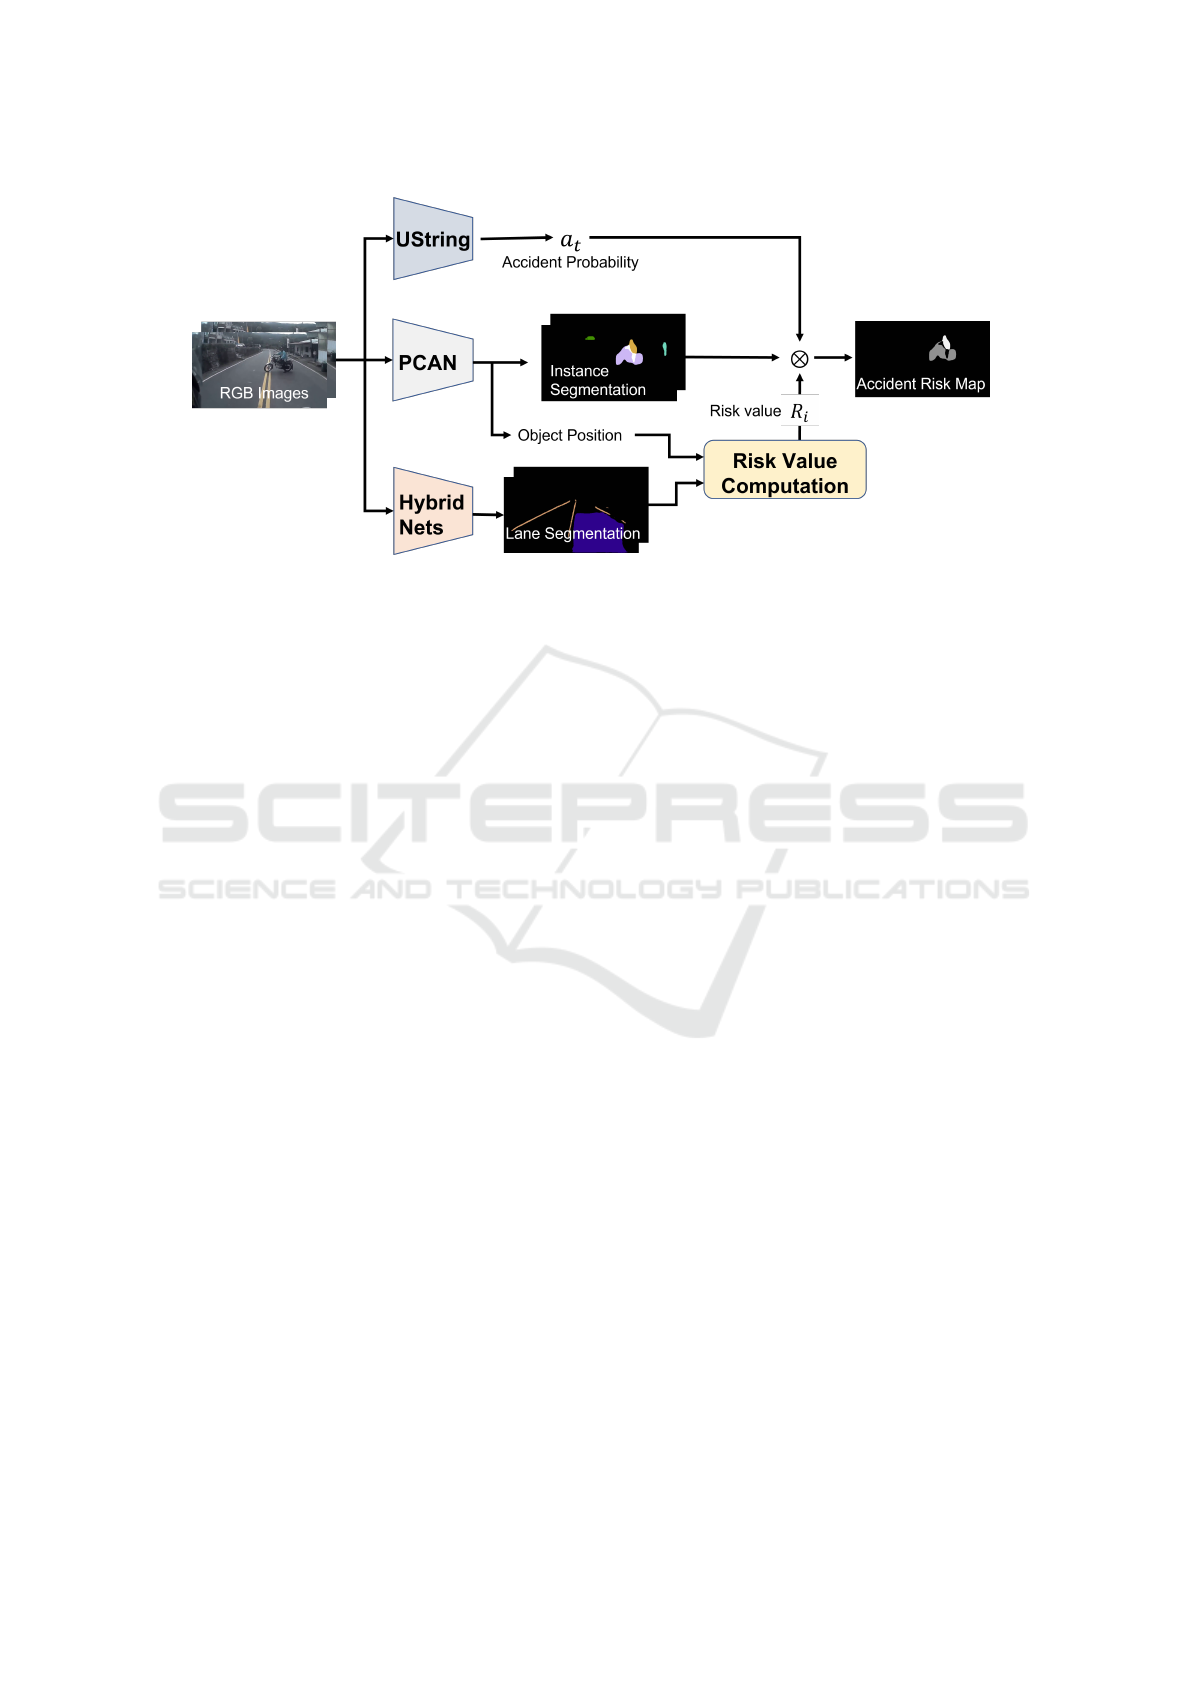
Figure 2: Dataset generation.
images that correspond to the input images by using
the new risk measure and construct a training dataset
using different types of cameras. By training the risk
map generator by using the dataset constructed in this
way, we obtain a risk map generator for various cam-
era parameters.
2 RELATED WORK
Traffic Accident Anticipation (TAA). In order to
predict traffic accidents, the existing methods esti-
mate the likelihood of accidents occurring at each
time step. DSA (Chan et al., 2016) defines candi-
date accident objects in each frame and uses a spatial
attention mechanism for predicting traffic accidents.
Based on the DSA framework, Zeng et al. (Zeng et al.,
2017) realized the localization of accidents by using a
soft-attention RNN. Suzuki et al. (Suzuki et al., 2018)
proposed a method for early accident prediction us-
ing a quasi-recurrent neural network. Corcoran et al.
(Corcoran and Clark, 2019) estimated the risk of traf-
fic accidents using the features of candidate objects as
spatial streams and optical flows as temporal streams.
The two streams of information were multiplied to
achieve accurate estimation. On the other hand, Yao
et al. (Yao et al., 2019) proposed a method to detect
anomalies on the road by predicting the future loca-
tion of each object on the road. UString-Net (Bao
et al., 2020) also proposes a model that takes into ac-
count the estimation of uncertainty when estimating
whether an accident will occur. These methods can
estimate the future risk of the entire scene from the
image, but cannot map the risk for each pixel. Al-
though (Zeng et al., 2017) realized the localization
of accidents, the extracted accident has nothing to do
with the observer (own vehicle), and the observer’s
degree of danger cannot be visualized. Differing from
these existing methods, we propose a new definition
of danger to observers, and propose a method to com-
pute and map the danger for each pixel. Our method
makes it possible to predict and visualize the danger
to the observer, i.e. own vehicle.
Video Instance Segmentation (VIS). In our method,
we use instance segmentation to compute the danger
of each object in the image. The generation of an in-
stance segmentation image from a single image con-
tains two steps, as in Mask-RCNN (He et al., 2017).
It is realized by first detecting the region of interest
(RoI), then adding an object mask and dividing it into
instances. Furthermore, in the case of instance seg-
mentation in moving images, temporal mapping of
each instance is realized as in Track-RCNN (Voigt-
laender et al., 2019) and PCAN (Ke et al., 2021) to
realize segmentation that enables tracking of the same
instance in moving images. In this research, we use
PCAN to perform object recognition in moving im-
ages and compute the danger of each object.
Lane Detection (LD). In our method, we perform
lane detection to compute the accident risk invariant
to camera parameters. The lane detection algorithm
started with the Hough transform (Hassanein et al.,
2015), which detects straight lines in a physics-based
manner, and LaneNet (Wang et al., 2018b) used deep
learning to detect individual lanes as instances. Enet-
SAD (Hou et al., 2019) greatly improves the accu-
racy by using the Attention mechanism so that the
model can self-learn. In addition to lane detection,
as in Hybrid-Nets (Vu et al., 2022), we can further
improve the accuracy of lane detection by segment-
ing the range of the roadway and multitask learning
with object detection. In this research, lane detection
Seeing Risk of Accident from In-Vehicle Cameras
673
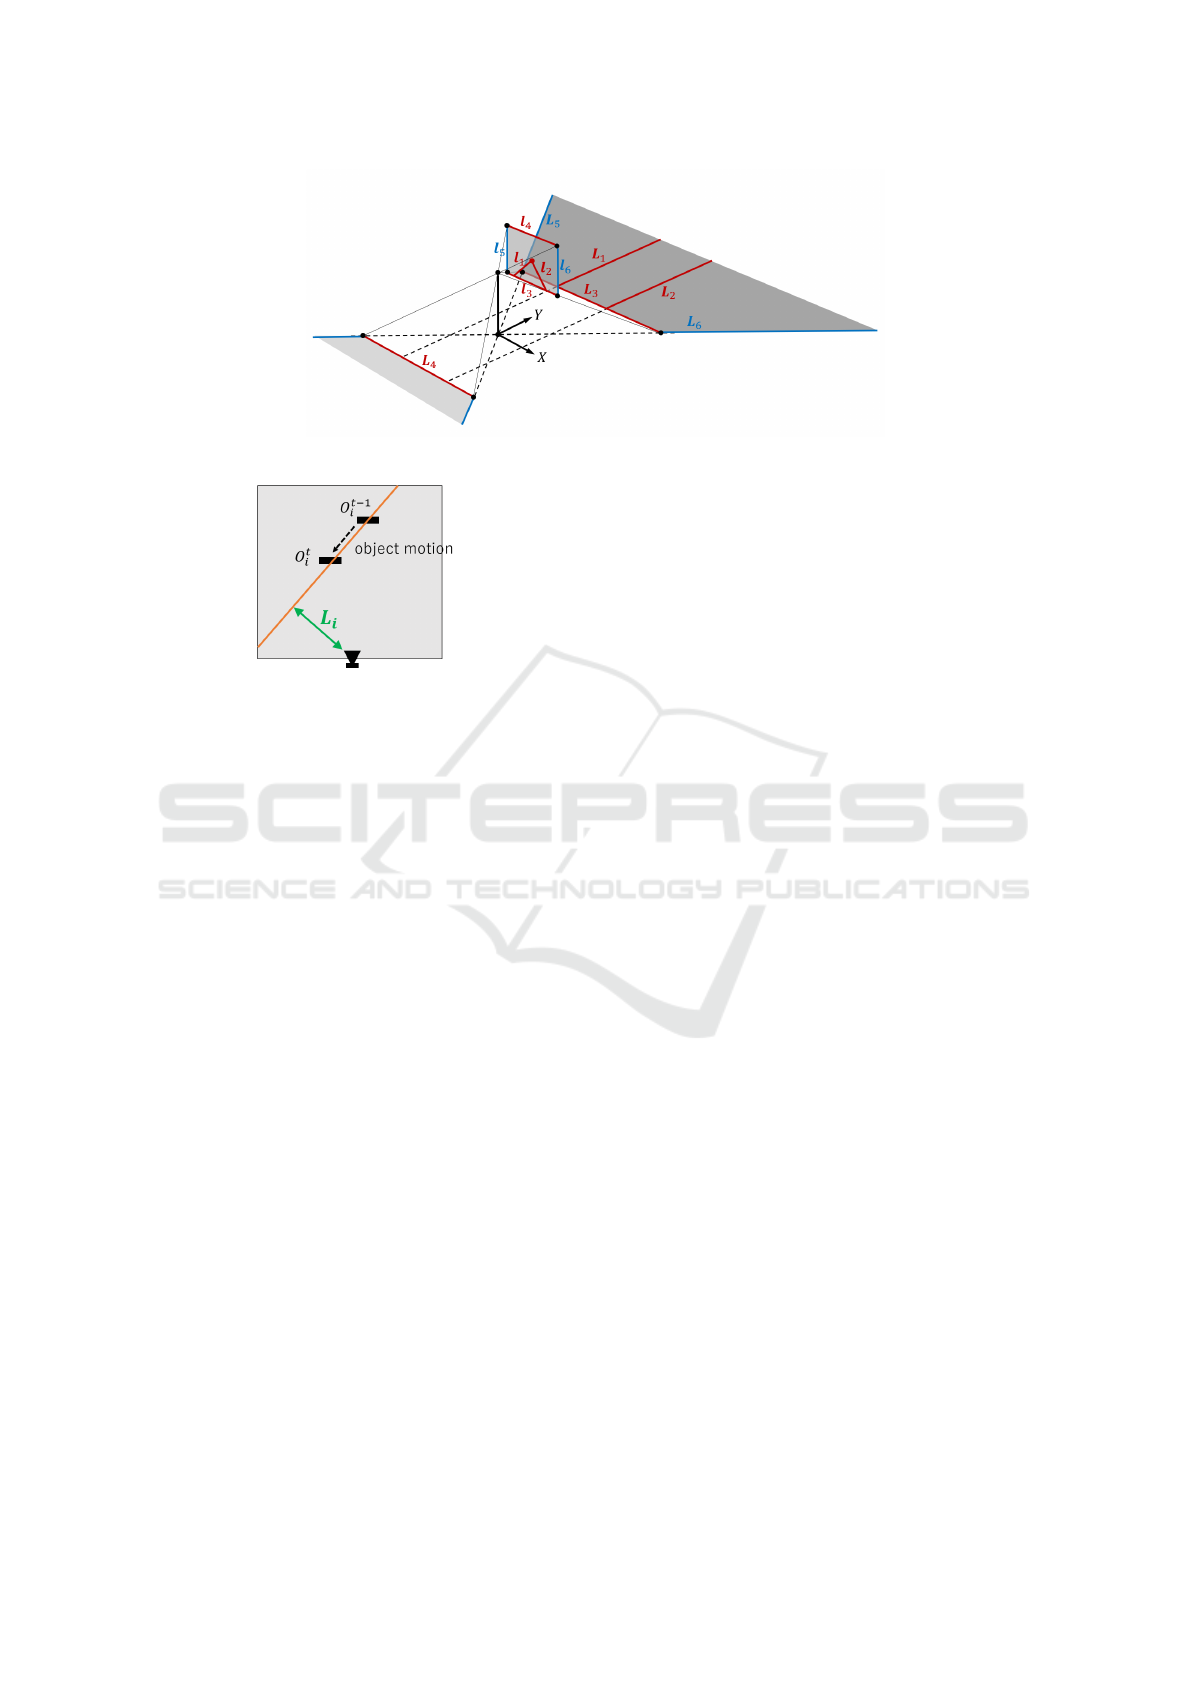
Figure 3: Projection from the image plane onto the road surface
Figure 4: Distance between camera and line of object mo-
tion.
is performed using Hybrid-Nets, and the collision risk
with the own vehicle is computed based on the de-
tected lane information.
3 ACCIDENT RISK MAP
DATASET
In this research, risk visualization is realized by net-
work learning. For training our network, we need
pairs of in-vehicle images and risk map images, but
such datasets do not exist. Thus, in this section,
we describe a method for constructing the training
dataset.
3.1 Overview of Dataset Generation
Figure 2 shows the overview of our method for cre-
ating pairs of RGB images and accident risk map im-
ages. The accident risk map image is generated by
multiplying the accident probability of the scene with
the risk value for each segmented region in the image.
By using UString-Net (Bao et al., 2020), we can
obtain the accident probability a
t
in the scene. How-
ever, this is just a single value that represents the prob-
ability of an accident across the image. Thus, we mul-
tiply it with a risk map image computed from the rela-
tive position and motion between the own vehicle and
each object in the image. The objects in the image are
segmented and extracted by using PCAN (Ke et al.,
2021). For computing the risk map image invariant to
camera parameters, we also use the lane information
extracted by using HybridNets (Vu et al., 2022).
We explain the detail of the risk map computation
in the following sections.
3.2 Invariant Road Representation
We first extract lane markers in the image by using
Hybrid-Nets (Vu et al., 2022), and obtain their line
parameters l
i
(i = 1, 2), i.e. homogeneous coordi-
nates of these lines. These image lines correspond to
lane markers, L
i
(i = 1, 2) on the road surface. Since
the lane markers are parallel to each other, their ho-
mogeneous coordinates can be represented as L
1
=
[1, 0, 1]
⊤
and L
2
= [1, 0, −1]
⊤
in the 2D projective
space. We also have the line correspondence between
the bottom and top image lines, l
3
= [0, 1, −y
min
]
⊤
and
l
4
= [0, 1, −y
max
]
⊤
, and their corresponding lines on
the road surface, L
3
= [0, 1, −1]
⊤
and L
4
= [0, 1, 1]
⊤
,
where y
min
and y
max
represent the coordinates of the
bottom edge and top edge of the image. These 4 pairs
of corresponding lines have the following projective
relationship:
l
i
= H
−⊤
L
i
(i = 1, ··· , 4), (1)
and we can compute the projective transformation H
by using these 4 pairs of lines. Once the projective
transformation is obtained, we can transfer the image
points x
i
to the road surface points X
i
as follows:
X
i
= H
−1
x
i
(2)
Since the lowest point of the object region ob-
tained by PCAN in the image is considered as a point
on the road surface in the 3D space. We transfer the
lowest image point of each object region to the road
surface point by using the projective transformation.
The derived road surface representation is invariant to
camera parameters, so we can use it for computing the
accident risk invariant to camera parameters.
VISAPP 2023 - 18th International Conference on Computer Vision Theory and Applications
674
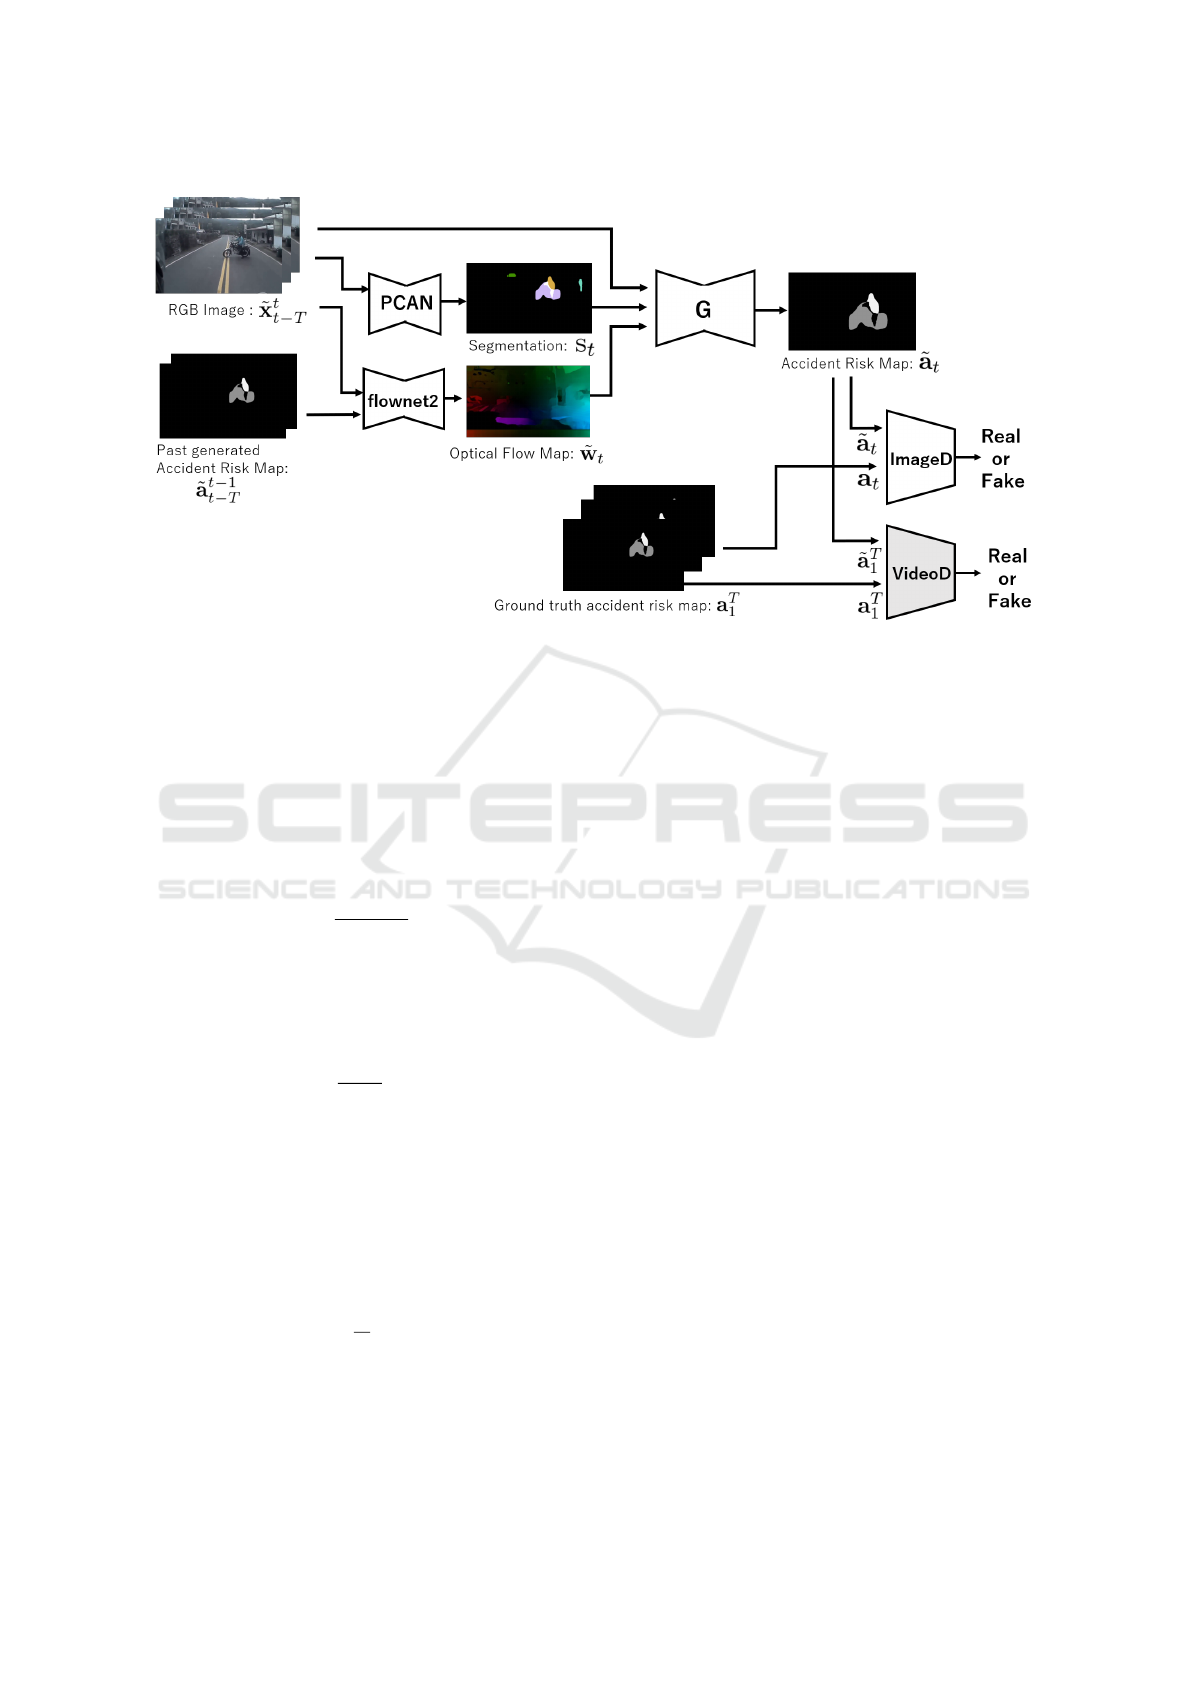
Figure 5: Proposed network for accident risk map estimation.
3.3 Computation of Accident Risk
For estimating the accident risks, we need to consider
two components. The first one is distance risk and the
second one is directional risk
The distance risk represents how fast the object is
approaching relative to the distance to the object on
the road, and it can be modeled by using Time-to-
Contact (TTC) (Tresilian, 1991) as follows:
T TC
i
=
d
t
i
d
t
i
− d
t−1
i
, (3)
where d
t
i
is the Euclidean distance between the object
i and the camera center on the road surface. Then, the
distance risk P
i
of object i is obtained by taking the
inverse of TTC as follows:
P
i
=
1
T TC
i
(4)
The directional risk on the other hand represents
how far the direction of motion of an object on the
road is pointing in the direction of the observer. As
shown in Figure 4, this can be represented by the dis-
tance L
i
between the camera center and a line that rep-
resents the motion of the object O
t
i
on the road. The
inverse of L
i
is then taken to be the directional risk D
i
as follows:
D
i
=
1
L
i
(5)
Then, by using these two components of risk, the
risk R
i
of object i can be computed as follows:
R
i
= σ(P
i
· D
i
), (6)
where, σ denotes the sigmoid function.
Then, the accident risk Q
i
of the region i is com-
puted by multiplying R
i
with the accident probability
across the image a
t
obtained from UString-Net.
Q
i
= a
t
· R
i
(7)
In this way, the accident risk at each image pixel can
be computed, and we can generate an accident risk
map image.
4 ESTIMATION OF ACCIDENT
RISK MAPS
In Section 3, we considered a method for generating
risk map images from in-vehicle images. However,
this method does not work when we fail to extract
lane markers in images. This situation frequently oc-
curs around road intersections, so the method is not
so practical. Thus, in this research, we use good im-
ages generated by the method described in Section 3
as training images, and realize stable risk image gen-
eration by learning the network with these training
images. In our network, we also use time-series in-
formation for generating better risk map images.
Our network is based on vid2vid (Wang et al.,
2018a) and uses a Markov process to capture tempo-
ral changes in images. Using the T time in-vehicle
images x
T
1
as input, T time images of accident risk
map
˜
a
T
1
is generated by the network. The risk map
image
˜
a
t
at the current time t is generated by using
the past input images x
t
t−L
and the risk rate map im-
Seeing Risk of Accident from In-Vehicle Cameras
675

ages
˜
a
t−1
t−L
generated in the past as follows:
p
˜
a
T
1
| x
T
1
=
T
∏
t=1
p
˜
a
t
|
˜
a
t−1
t−L
, x
t
t−L
(8)
The network consists of one Generator and two
Discriminators, as shown in Figure 5. Generator G
takes RGB images x
t
t−L
up to time t and risk map im-
ages generated in the past a
t−1
t−L
as input, and gener-
ates accident risk map image at time t. It also takes
segmentation images s
t
t−L
and flow images w
t
t−L
to
further improve the accuracy. Changes of the object
region are extracted by video instance segmentation,
and the pixel-level temporal changes in the image are
represented using optical flow derived from flownet2.
Our network has two discriminators for adversarial
learning. One is the image discriminator D
I
, which
judges whether the generated image is true or false,
and the other is the video discriminator D
V
, which
judges whether the generated video image is natural
or not. The evaluation function is as follows:
min
G
max
D
I
L
I
(G, D
I
) + max
D
V
L
V
(G, D
V
)
(9)
+λ
W
L
W
(G) + λ
A
L
A
(G),
where L
I
is the adversarial loss for images as follows:
L
I
= E
φ
I
(
a
T
1
,x
T
1
)
[logD
I
(a
i
, x
i
)] (10)
+E
φ
I
(
˜
a
T
1
,x
T
1
)
[log(1 − D
I
(
˜
a
i
, x
i
))],
and L
V
is the adversarial loss for videos as follows:
L
V
= E
φ
V
(
w
T −1
1
,a
T
1
,x
T
1
)
logD
V
a
i−1
i−K
, w
i−2
i−K
(11)
+E
φ
V
(
w
T −1
1
,
˜
a
T
1
,x
T
1
)
log
1 − D
V
˜
a
i−1
i−K
, w
i−2
i−K
Also, L
w
represents the L1 loss for the generated
optical flow image as follows:
L
W
=
1
T − 1
T −1
∑
t=1
(
∥
˜
w
t
− w
t
∥
1
), (12)
and L
A
is the L1 loss for the generated accident risk
map images.
L
A
=
1
T
T
∑
t=1
(
∥
˜
a
t
− a
t
∥
1
) (13)
By learning to minimize these losses, the network is
trained to generate accident risk maps from RGB im-
ages.
5 EXPERIMENT
We next show the results of the experiments. The
Dachcam Accident Dataset (DAD) (Chan et al.,
2016), which is video data of real accidents, is used to
create the accident risk map dataset described in Sec-
tion 3. From these data, 100 types of data in which ac-
cidents have occurred and 100 types of data in which
no accidents have occurred are used. For video seg-
mentation, we used PCAN (Ke et al., 2021) trained
on BDD100K dataset (Yu et al., 2018), and for lane
segmentation, we used pre-trained HybridNets (Vu
et al., 2022). For the true value of the optical flow,
we also use the flow map estimated by using flownet2
pre-trained by the Cityscapes dataset (Cordts et al.,
2016). Our network is trained using 312 video images
and tested using 88 video images. We set λ
W
= 1.0
and λ
A
= 100.0. The generator and discriminator are
trained for 200 epochs.
5.1 Dataset Creation
We first show the dataset created by using the pro-
posed method described in Section 3.
Figure 6 shows some examples of the created
dataset. We compare the data generated by the pro-
posed method with data derived from simple Time-to-
Contact (TTC) and data derived by combining TTC
and directional risk without multiplying the accident
probability across the image.
As shown in Figure 6, in the risk images gener-
ated from TTC only, the risk value is computed for
all approaching objects, but by combining the direc-
tional risk, higher risks are assigned to the objects ap-
proaching our vehicle. However, some risks are dis-
played even for objects in other lanes that have no risk
at all. On the contrary, the risk maps generated by the
proposed method represent the risks that truly lead to
accidents, as shown in the right-most column. In ad-
dition, although the angle of view and the elevation
angle of these data are significantly different, the pro-
posed method derives risk map images appropriately,
and we find that the proposed method is invariant with
the camera parameters.
We next show the temporal changes in the risk
map images generated by the proposed method in Fig-
ure 7. For objects approaching the observer, we can
see that the risk value increases as they get closer.
5.2 Estimation of Accident Risk Maps
We next show the results of our risk estimation
method proposed in Section 4. The accident risk map
estimated by using the network trained on the dataset
generated in Section 5.1 is shown in Figure 8. In Fig-
ure 8, we show the results for two consecutive time in-
stants for each scene. For comparison, the results de-
rived by the existing method vid2vid are also shown.
VISAPP 2023 - 18th International Conference on Computer Vision Theory and Applications
676
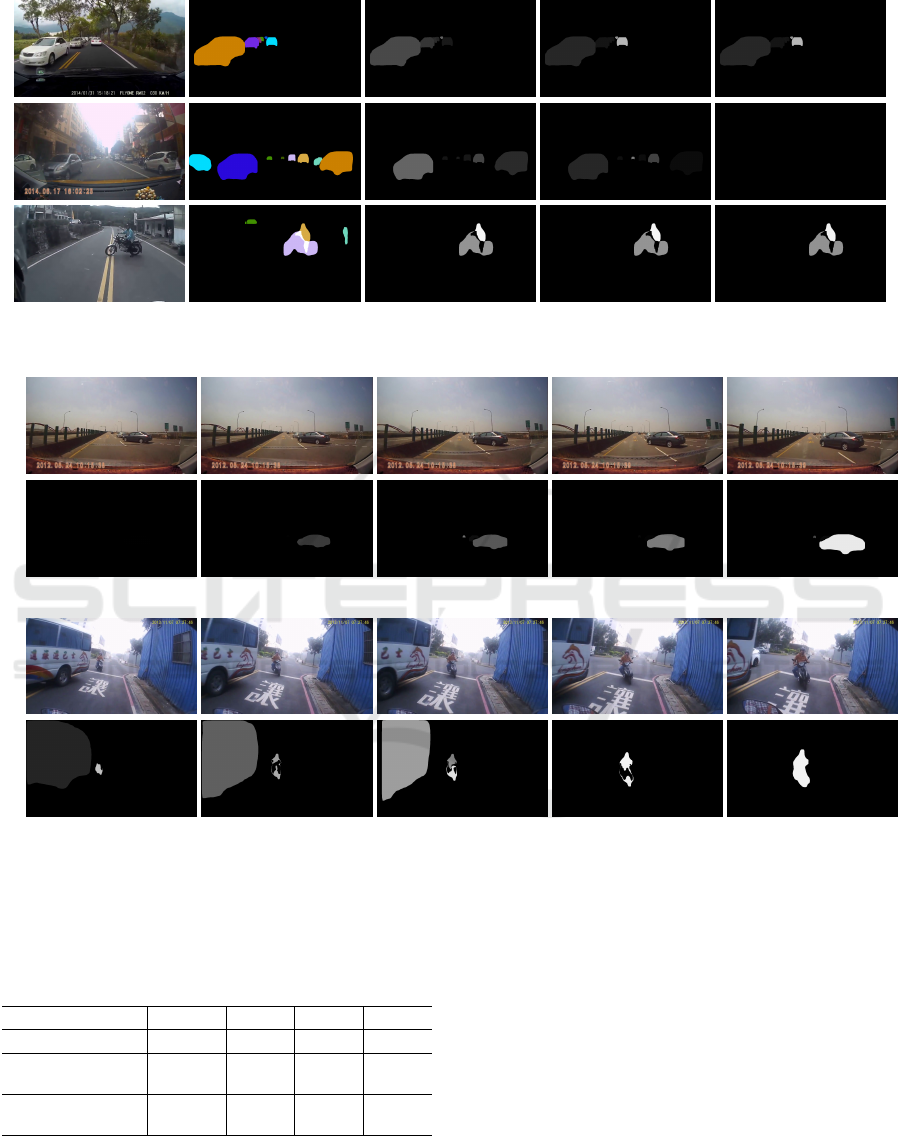
Input image Segmented image TTC TTC with direction Accident risk map
Figure 6: Dataset generated by the proposed method. first row: a scene approaching a stationary vehicle, second row: a scene
without danger, third row: a scene approaching a stopped bike.
Scene 1: Vehicle is approaching from the right.
Scene 2: Bike is coming towards the observer from behind a passing bus.
Figure 7: Sequential images and their risk map images in the dataset generated by the proposed method.
Table 1: Accuracy of generated accident risk maps. To com-
pute accuracy, precision, and recall, we binarised non-zeros
to 1 and zeros to 0 in the risk value for each pixel in the
generated image and computed them by taking the average
of all pixels.
RMSE Acc Prec Rec
Vid2Vid 10.58 91.18 31.95 33.25
Ours
(L1+gan) 9.42 94.88 56.60 58.95
Ours
(L1+flow+gan) 9.39 95.10 58.74 65.10
To see the effect of flow information in the proposed
method, we also compare the case where flow infor-
mation is not used in the proposed method.
As shown in scene 1 in Figure 8, the risk re-
gions derived from vid2vid are vague and not accu-
rate, whereas the proposed method can derive the risk
regions accurately. Furthermore, as shown in scene
2 and scene 3, the proposed method can estimate the
risk accurately even for distant objects. We also find
that combining flow information improves the accu-
racy of the proposed method. In scene 4, the bike
was extracted accurately by adding flow information
to the proposed method. The results in scene 5 also
show that the risk regions derived from the existing
method are vague, whereas our method can extract
risk regions more accurately. However, the proposed
method sometimes over-detects risk regions, so we
Seeing Risk of Accident from In-Vehicle Cameras
677
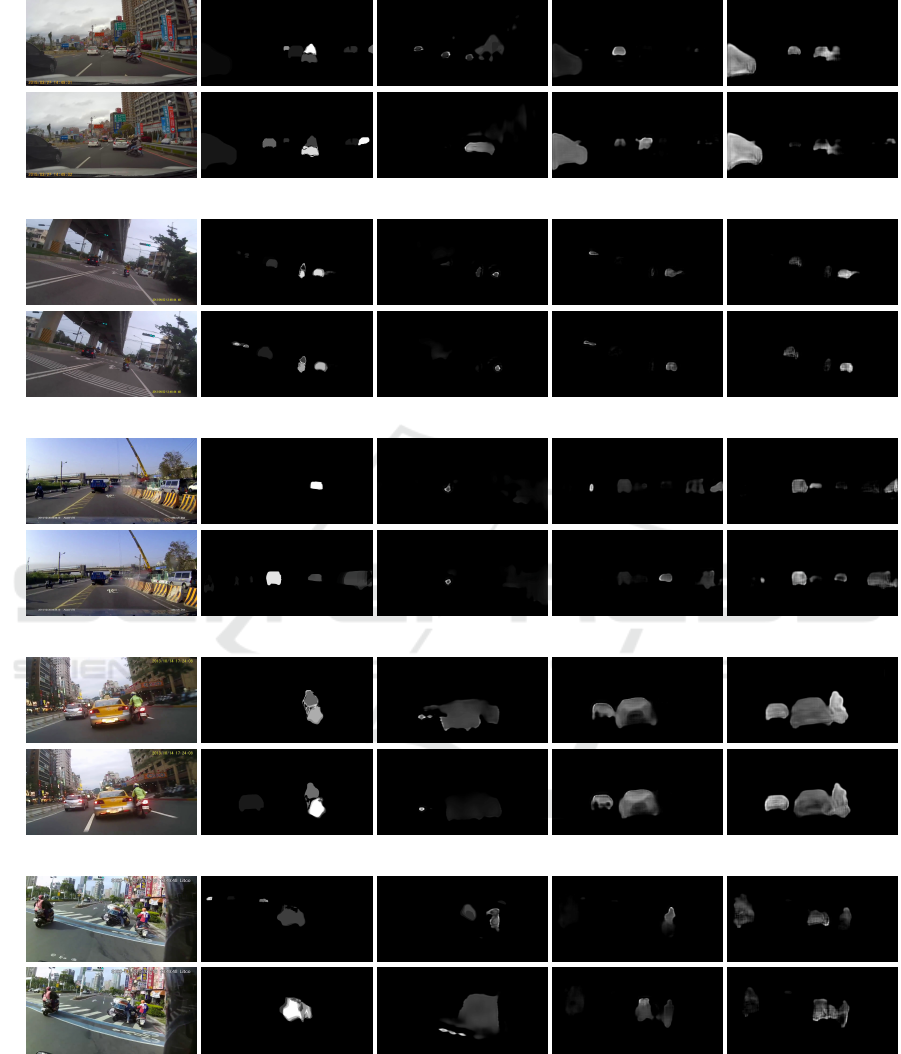
Input image Ground Truth Vid2Vid Ours(L1+GAN) Ours(L1+Flow+GAN)
Scene 1: Just before the motorbike collided with the car and fell over.
Scene 2: Motorbike brakes against a white car approaching from the right.
Scene 3: Truck crashes into a wall and creates dust.
Scene 4: Just before a car and motorbike collide.
Scene 5: Motorbike approaches from the left just before colliding with another motorbike.
Figure 8: Accident risk map estimated by using the proposed network trained by using the generated dataset.
need further improvement in its accuracy.
We next show the results of the quantitative eval-
uation in Table 1. RMSE, Accuracy, Precision, and
Recall were measured as evaluation metrics. To com-
pute Accuracy, Precision, and Recall, we binarised
non-zeros to 1 and zeros to 0 in the risk value for each
pixel in the generated image and computed them by
taking the average of all pixels.
VISAPP 2023 - 18th International Conference on Computer Vision Theory and Applications
678

While the existing method failed to correctly cap-
ture the risk regions, the proposed method was able to
identify the risk regions accurately, so the proposed
method improved the accuracy of RMSE and other
metrics. From the values of Precision and Recall, we
also find that the risks were estimated more accurately
by the proposed method for regions where objects are
present.
6 CONCLUSION
In this paper, we proposed a method for estimating
accident risk maps, which represent the accident risk
to the own vehicle, based on in-vehicle images.
The dataset required for training the GAN was
created using a model independent of the camera pa-
rameters. Unlike the conventional Time-to-Contact,
the dataset created by the proposed method can rep-
resent with high accuracy the greater risk only for ob-
jects approaching in the direction of the own vehicle.
Moreover, by combining the trained UString-Net, it is
possible to create a dataset of accident risk maps that
represent only hazards in situations where accidents
are likely to occur.
We also proposed a network for generating the
risk map images from in-vehicle images. The pro-
posed network trained by the proposed dataset can
estimate the accident risk map more accurately than
the conventional network by dealing with scenes with
different camera parameters.
Finally, we confirmed through real-world experi-
ments that the proposed method can visualize the risk
to the own vehicle using any type of in-vehicle cam-
era.
REFERENCES
Bao, W., Yu, Q., and Kong, Y. (2020). Uncertainty-based
traffic accident anticipation with spatio-temporal rela-
tional learning. In Proc. ACM International Confer-
ence on Multimedia.
Chan, F.-H., Chen, Y.-T., Xiang, Y., and Sun, M. (2016).
Anticipating accidents in dashcam videos. In Proc.
Asian Conference on Computer Vision.
Corcoran, G.-P. and Clark, J. (2019). Traffic risk as-
sessment: A two-stream approach using dynamic-
attention. In Proc. Conference on Computer and
Robot Vision (CRV), pages 166–173.
Cordts, M., Omran, M., Ramos, S., Rehfeld, T., Enzweiler,
M., Benenson, R., Franke, U., Roth, S., and Schiele,
B. (2016). The cityscapes dataset for semantic urban
scene understanding.
Hassanein, A. S., Mohammad, S., Sameer, M., and Ragab,
M. E. (2015). A survey on hough transform, theory,
techniques and applications. arXiv.
He, K., Gkioxari, G., Doll
´
ar, P., and Girshick, R. (2017).
Mask R-CNN. In Proc. International Conference on
Computer Vision (ICCV).
Hou, Y., Ma, Z., Liu, C., and Loy, C. C. (2019). Learning
lightweight lane detection cnns by self attention dis-
tillation. In Proc. International Conference on Com-
puter Vision.
Ilg, E., Mayer, N., Saikia, T., Keuper, M., Dosovitskiy, A.,
and Brox, T. (2017). Flownet 2.0: Evolution of opti-
cal flow estimation with deep networks. In Proc. Con-
ference on Computer Vision and Pattern Recognition
(CVPR).
Ke, L., Li, X., Danelljan, M., Tai, Y.-W., Tang, C.-K.,
and Yu, F. (2021). Prototypical cross-attention net-
works for multiple object tracking and segmentation.
In Proc. Advances in Neural Information Processing
Systems.
Suzuki, T., Kataoka, H., Aoki, Y., and Satoh, Y. (2018).
Anticipating traffic accidents with adaptive loss and
large-scale incident db. In Proc. Conference on Com-
puter Vision and Pattern Recognition (CVPR).
Tresilian, J. (1991). Empirical and theoretical issues in the
perception of time to contact. Journal of Experimen-
tal Psychology: Human Perception and Performance,
17(3):865–876.
Voigtlaender, P., Krause, M., Osep, A., Luiten, J., Sekar, B.
B. G., Geiger, A., and Leibe, B. (2019). MOTS: Multi-
object tracking and segmentation. In Proc. Conference
on Computer Vision and Pattern Recognition (CVPR).
Vu, D., Ngo, B., and Phan, H. (2022). Hybridnets: End-to-
end perception network. arXiv.
Wang, T.-C., Liu, M.-Y., Zhu, J.-Y., Liu, G., Tao, A., Kautz,
J., and Catanzaro, B. (2018a). Video-to-video synthe-
sis. In Proc. Conference on Neural Information Pro-
cessing Systems (NeurIPS).
Wang, Z., Ren, W., and Qiu, Q. (2018b). LaneNet: Real-
time lane detection networks for autonomous driving.
arXiv.
Yao, Y., Xu, M., Wang, Y., Crandall, D. J., and Atkins,
E. M. (2019). Unsupervised traffic accident detection
in first-person videos. In Proc. International Confer-
ence on Intelligent Robots and Systems (IROS).
Yu, F., Chen, H., Wang, X., Xian, W., Chen, Y., Liu, F.,
Madhavan, V., and Darrell, T. (2018). Bdd100k: A
diverse driving dataset for heterogeneous multitask
learning. In Proc. Conference on Computer Vision and
Pattern Recognition.
Zeng, K.-H., Chou, S.-H., Chan, F.-H., Niebles, J. C., and
Sun, M. (2017). Agent-centric risk assessment: Ac-
cident anticipation and risky region localization. In
Proc. Conference on Computer Vision and Pattern
Recognition (CVPR).
Seeing Risk of Accident from In-Vehicle Cameras
679
