
Image-Based Material Analysis of Ancient Historical Documents
Thomas Reynolds
1
, Maruf A. Dhali
2 a
and Lambert Schomaker
2 b
1
Department of Computer Science, Royal Holloway, University of London, U.K.
2
Department of Artificial Intelligence, University of Groningen, The Netherlands
Keywords:
Document Analysis, Image-Based Material Analysis, Historical Manuscript, Feature Extraction, Fourier
Transform, Classification.
Abstract:
Researchers continually perform corroborative tests to classify ancient historical documents based on the phys-
ical materials of their writing surfaces. However, these tests, often performed on-site, requires actual access
to the manuscript objects. The procedures involve a considerable amount of time and cost, and can damage
the manuscripts. Developing a technique to classify such documents using only digital images can be very
useful and efficient. In order to tackle this problem, this study uses images from a famous historical collection,
the Dead Sea Scrolls, to propose a novel method to classify the materials of the manuscripts. The proposed
classifier uses the two-dimensional Fourier Transform to identify patterns within the manuscript surfaces.
Combining a binary classification system employing the transform with a majority voting process is shown
to be effective for this classification task. This pilot study shows a successful classification percentage of up
to 97% for a confined amount of manuscripts produced from either parchment or papyrus material. Feature
vectors based on Fourier-space grid representation outperformed a concentric Fourier-space format.
1 INTRODUCTION
Image-based material classification is challenging due
to large inter-class and intra-class variations within
materials (Kalliatakis et al., 2017). Framing this prob-
lem in the context of ancient historical manuscripts
provides a more significant challenge, primarily due
to the degree of degradation of the data set. Gain-
ing first-hand access to such manuscripts is often re-
stricted or impractical. Subsequent chemical analysis
of the material can also be damaging (Freedman et al.,
2018). On the contrary, analysis of the material using
photographic images of manuscript samples causes
no such damage. Furthermore, such images are rel-
atively easy to produce and are often released into the
public domain, allowing easier access. Previous ma-
terial classification work has focused on inter-material
and texture classification techniques using data sets
from non-context ‘clean’ images (Matsuyama et al.,
1983) and data sets from ‘wild’, context-set real-
world images (Bell et al., 2015). Other work has in-
corporated material, texture, and pattern recognition
techniques in specific real-world intra-material clas-
sification (Wu et al., 2018; Kliangsuwan and Heed-
nacram, 2018; Camargo and Smith, 2009). There has,
a
https://orcid.org/0000-0002-7548-3858
b
https://orcid.org/0000-0003-2351-930X
however, been little usage of surface material classi-
fication techniques set in the context of photographic
images of ancient manuscripts. This study uses im-
ages from the Dead Sea Scrolls (DSS) collection as
a data set to investigate a classification method for
materials of the writing surfaces (see figure 1 for an
example image). After conducting some pilot experi-
ments with deep learning (convolutional neural nets),
in the case of texture classification, a dedicated shape
feature may prove to be more appropriate and conve-
nient, particularly when considering the limited size
of the available training data set. The research pre-
sented here employs a method in which the regu-
lar underlying periodic patterns inherent in the writ-
ing surface are used to classify the material of the
manuscripts. Different feature vectors are constructed
to capture these patterns.
The feature vectors are compared to specify which
can accurately classify the writing materials of the
manuscript fragments. These feature vectors are built
upon the discrete 2-dimensional Fourier Transform
(2DFT). Feature vectors which include the use of the
2DFT from both a computer vision and texture anal-
ysis standpoint, have been shown to provide stan-
dalone and complementary results to spatially fo-
cused approaches (Hu and Ensor, 2019). For exam-
ple, the 2DFT distinguishes between material textures
Reynolds, T., Dhali, M. and Schomaker, L.
Image-Based Material Analysis of Ancient Historical Documents.
DOI: 10.5220/0011743700003411
In Proceedings of the 12th International Conference on Pattern Recognition Applications and Methods (ICPRAM 2023), pages 697-706
ISBN: 978-989-758-626-2; ISSN: 2184-4313
Copyright
c
2023 by SCITEPRESS – Science and Technology Publications, Lda. Under CC license (CC BY-NC-ND 4.0)
697

and objects in non-contextual (Bharati et al., 2004;
Bajcsy, 1973) and contextual images (Cevikalp and
Kurt, 2017) in conjunction with a standalone classi-
fier (Hui and Zak, 2014) or input to a neural network
(Franzen and Yuan, 2019; Kumar et al., 2020). Fur-
thermore, incorporating the 2DFT into Compositional
Pattern Producing Networks (CPPNs) has shown im-
provements in accurately recreating textures due to
the ability of the 2DFT to match and capture high-
frequency details (Tesfaldet et al., 2019). In addi-
tion, the Fourier Transform provides a more straight-
forward approach than Markov Random Field model-
ing of textures (Hassner and Sklansky, 1980). Thus,
2DFT feature vectors offer an attractive solution to
distinguish between inherent textures and patterns in
the writing surface of ancient historical manuscripts,
such as the DSS, to classify the materials upon which
they are written.
1.1 Dead Sea Scrolls
The DSS collection consists of ancient historical
manuscripts produced between the third century BCE
and the first century CE, written mainly on parch-
ment (animal skin) and papyrus (made from the pith
of the papyrus plant) and, as a singular exception,
copper (Shor, 2014). Recent works on the DSS have
concerned handwriting analysis, dating of the scrolls
and writer identification (Dhali et al., 2017; Dhali
et al., 2019; Dhali et al., 2020; Popovi
´
c et al., 2021).
More recent work on the DSS related to the materi-
als used in their production has focused on match-
ing manuscript fragments. In this approach, a neu-
ral network is employed to fit manuscript fragment
pairs, which potentially originate from the same sheet
of papyrus (Abitbol and Shimshoni, 2021). The ap-
proach utilizes patterns found in papyrus material
and demonstrates some of the difficulties of work-
ing with damaged ancient historical manuscripts. In
other work, the materials on which these manuscripts
have been written, are analyzed by material scien-
tists employing micro and macro x-ray fluorescence
imaging, scanning electron microscopy, spectroscopy
and microchemical testing (Wolff et al., 2012; Rabin,
2013; Loll et al., 2019). Answers to questions prob-
ing the provenance and archaeometry of the DSS are
a result of such studies, and are based upon the cor-
rect identification of the underlying material. Utiliz-
ing such methods may not always be feasible due to
cost, personnel availability, potential damage to the
manuscripts, unavailability of technology, and time.
Instead, a pattern recognition system may help to clas-
sify the writing materials of the manuscripts while
mitigating some of the traditional impracticalities,
Figure 1: Color image of plate X102 of the Dead Sea Scrolls
collection containing three papyrus fragments. Distinctive
striations can be seen in both the vertical and horizontal ori-
entations. Damage is evident on the edges and within each
fragment.
and by extension, help in the pursuit of answers to
such questions. Despite discoloration and damage to
the manuscripts over time which hinders accurate and
expedient classification, the underlying periodic and
regular patterns found in the material remain, and may
form the basis of a classification system (see figure 1).
Testing the accuracy of such a system can help deter-
mine whether traditional material analysis techniques
used on the DSS and other ancient manuscripts have
the potential for supplementation by such a system, or
by a further extension of one.
This work mainly focuses on classifying the pri-
mary writing materials but opens the door for fur-
ther in-depth analysis using pattern recognition tech-
niques.
2 METHODOLOGY
This section will briefly present the data, preprocess-
ing measures, sampling techniques, feature vector
construction, and finally, the classification step.
2.1 Data
The data set consists of DSS images kindly provided
by the Israel Antiquities Authority (IAA). The images
are publicly available on the website of the Leon Levy
Dead Sea Scrolls Digital Library project (Shor, 2014).
The DSS collection comprises primarily two types of
material; mostly parchment with a minority written
on papyrus, and a singular exception being a cop-
per plate. This study excludes the copper plate and
uses parchment and papyrus examples resulting in a
binary classification task. The vast majority of the
scrolls have experienced some form of degradation
due to aging or mishandling. It is common for parts
of a scroll to be missing, of which a few disconnected
ICPRAM 2023 - 12th International Conference on Pattern Recognition Applications and Methods
698
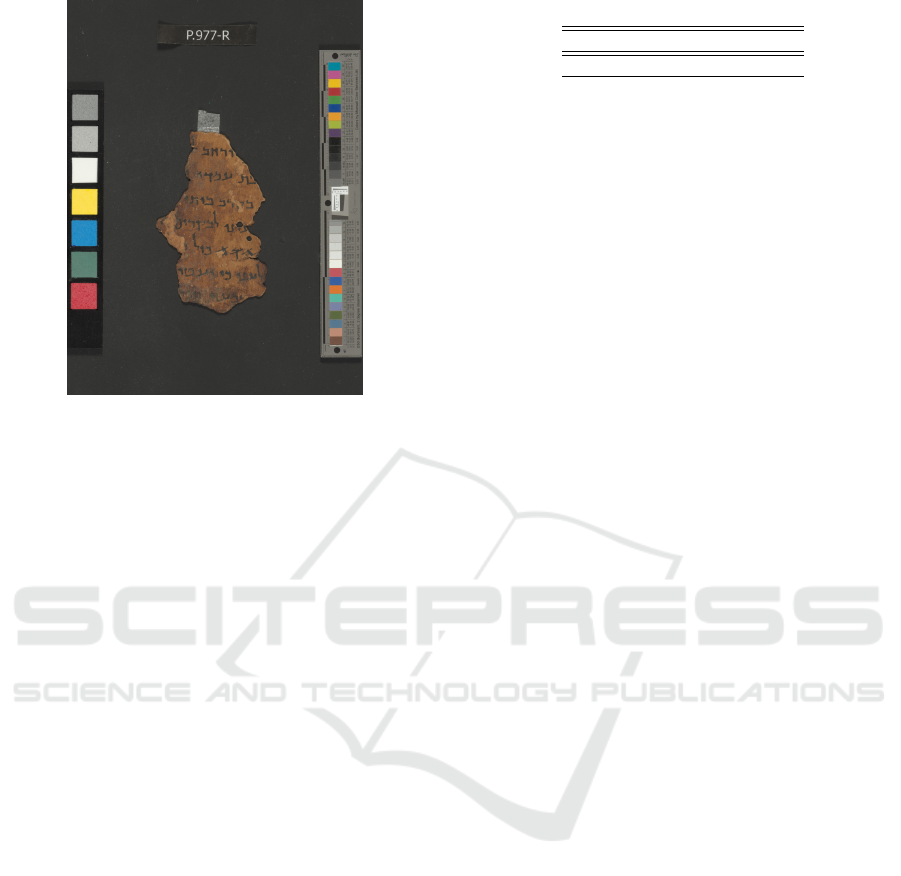
Figure 2: A multi-spectral color image of plate 977 contain-
ing a single fragment made of parchment. Color calibration
panels, scale bars, and plate labels are visible in the image.
fragments remain for analysis. Some of the remaining
fragments are of relatively small size and vary in con-
dition. Some of the images are available in a range
of spectral bands. This study uses two sets of scroll
images: ordinary color photographs (Set-1) and com-
posite images composed of individual spectral band
images (Set-2). Figures 1 and 2 show examples from
Set-1 and Set-2 respectively. The sets are used in-
dependently. There are notable differences between
the two sets of images. While the images of Set-1
are consistently 96 dpi, the distance to the subject and
size of each image is inconsistent, a consequence of
the methods employed by the photographers and the
fragment arrangement used by the curators. This pro-
vides an opportunity to study the proposed methods
on an imperfect data set. Set-2 images, however, are
consistent; 7216 × 5412 pixels in size, 1215 dpi, and
with a bit depth of 24. Despite the distance to the
subject measurement being unknown, it is consistent
across all Set-2 images. Some Set-1 images contain
more than one fragment of scroll due to the nature of
the arrangement by the curators. Some Set-2 MS im-
ages are only partial images of a larger fragment. The
images used for this study are a subset of the com-
plete collection. The subset was made based on two
criteria; to represent as many of the different textures
available throughout the collection as possible and,
secondly, to maximize the available area of material
for samples to be taken. The images are comprised of
23 parchment fragments and 10 papyrus fragments,
totaling 33 fragments in each set (table 1). The same
fragments were used for both sets of images (For fur-
ther details, please see the table in Appendix A).
Table 1: Fragments count for each material type.
Parchment Papyrus Total
23 10 33
2.2 Preprocessing
Identifying each fragment within an image is the first
step in preprocessing. This is a difficult step, espe-
cially for the Set-2 images, containing color reference
panels and measurement markings (figure 2). The
fragments in an image are identified from the back-
ground, other fragments, and the reference markings,
using automated k-means clustering and by hand.
Then, each fragment is extracted for individual pro-
cessing.
In order to extract features, clean images of the
writing surface material within each fragment are re-
quired. Removal of the text prevents any regular
and periodic patterns within the text from influenc-
ing those patterns found in the material. Combining
the need for clean background material with the lim-
ited supply of DSS material, the text and gaps caused
by damage within the boundaries of each fragment are
filled to provide more sample material. Previous work
using deep learning (Dhali et al., 2019) has produced
binary masks of only the visible text in each image
(figure 3). These have kindly been provided for use
in this study. As each binary text image overlays onto
the original image, these masks identify text locations
within each fragment. These masks are made robust
by dilation; one pixel of text in the mask is expanded
to a 3 × 3 pixel square (For further details, please see
the figure in Appendix B). This is a necessary alter-
ation as the masks were used to analyze the written
text of the scrolls, having been designed to capture
no background material strictly. The 3 × 3 expansion
was chosen for three reasons. Firstly, to increase the
coverage of the mask. Secondly, a square grid of odd-
length sides allowed centering over the individual pix-
els in question. Finally, 3 × 3 is the minimum of such
an expansion as to leave more surrounding source ma-
terial available for analysis.
Thus, in a minority of instances, the outline of the
written text may remain. Dilation of the text pixels
helps capture any text not included in the original bi-
nary masks. Maintaining the regular patterns found
in the material is of primary concern. The method
chosen for filling in these locations was selected to
maintain the surface patterns and is known as exem-
plar infilling (Criminisi et al., 2004). Exemplar in-
filling searches the entirety of the fragment-image for
a patch of material that matches a section of the lo-
cation to be filled most closely, based on the sum of
squared differences. This patch is then used to fill
Image-Based Material Analysis of Ancient Historical Documents
699
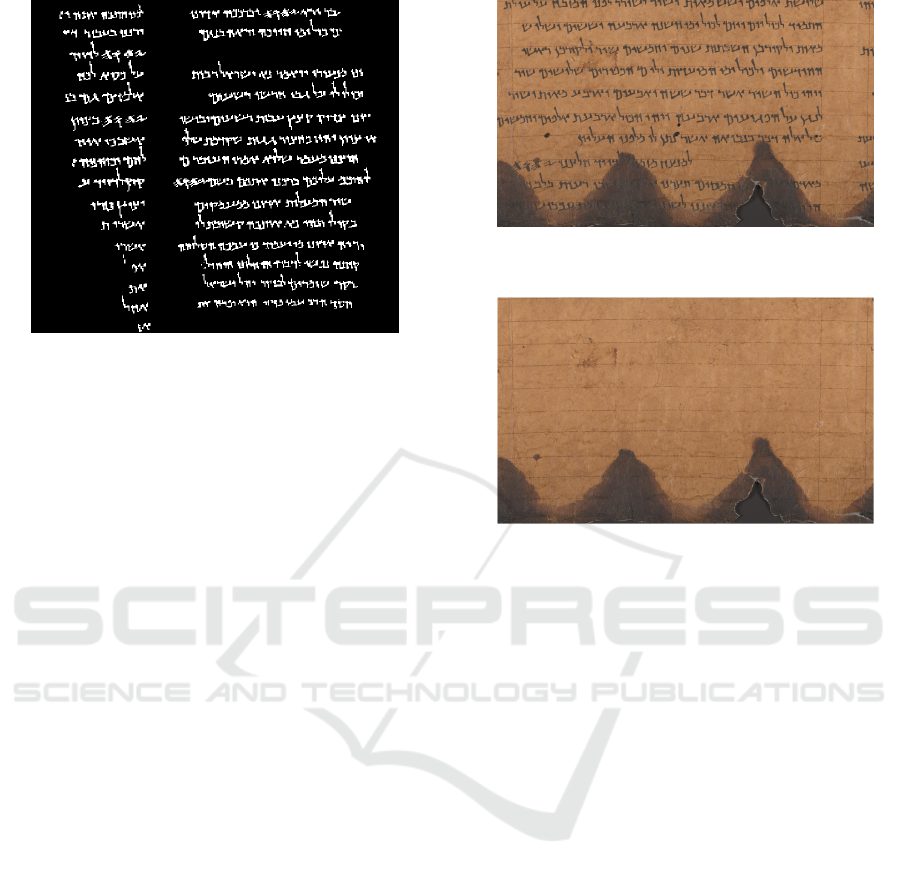
Figure 3: A binarized image showing the ink (text) from
plate 976. The binarization is obtained using the BiNet
(Dhali et al., 2019).
that section (figure 5). Each location is filled using
different, closely matched patches of specified size
(9 × 9 pixels). A 9 × 9 patch size was selected as
a balance between the computational time needed to
search for and fill using such a patch size (a function
of the types of images used in this study), the rela-
tively thin text mask areas for which the patch would
fill, and the flexibility the exemplar infilling could
provide when filling the text space. This is a param-
eter that would likely be optimized in future work. A
new patch is searched for after every iteration, as the
closest matched patches may change once the filling
process starts. In addition, most of the damage to each
scroll fragment is found around the edges. In order to
mitigate the influence of degradation on the classifi-
cation step, samples are taken from the interior part
of the fragment. This is achieved by considering only
the portion contained within the largest inscribed rect-
angle (by area) within the fragment (figure 6). This
area is known as the sample area. Samples for feature
vector construction are taken from within this area.
2.3 Sampling
Twenty-five samples of size 256 × 256 pixels, a size
necessitated by the requirements of using the 2DFT
and the sizes of the images used, are taken at evenly
spaced intervals in a 5 × 5 grid pattern covering the
sample area. Twenty-five samples are used to allow
for relatively comprehensive coverage of the surface
material of the fragment, as well as providing ma-
jority voting evidence to classify each fragment (see
section 2.5, Classification), balanced against the re-
sources needed to generate these samples and the im-
age sizes. Variations in these choices are a recom-
mended pathway for undertaking further work on this
Figure 4: A zoomed view before the filling process; taken
from the multi-spectral image of plate 974 (Set-2).
Figure 5: A zoomed view after the filling process; taken
from the multi-spectral image of plate 974 (Set-2).
subject. As each sample area differs in size, the spac-
ing between samples depends on the area’s dimen-
sions. As a result, there is an overlap of the samples
for smaller sample areas, and conversely, there is un-
used space between samples for large sample areas.
This situation is unavoidable due to the inconsistent
nature of the fragment sizes.
2.4 Feature Vector Construction
The saturation values of each sample image, from
an RGB to HSV conversion of the image, are ex-
tracted. The extraction assigns each pixel a value
from 0 to 1 to describe its saturation level. The use
of HSV and saturation values have been shown to
provide improved performance when using the 2DFT
for image classification purposes (Kliangsuwan and
Heednacram, 2018; Wu et al., 2018). The 2DFT
is then applied. The DC component is centralized,
and the log transform of the absolute values is taken
(log2DFT) to visually display the spectrum (figure 7).
The log2DFT representation is then partitioned into
n × n non-overlapping sections (figure 8). This study
uses n = 7. As there has been little previous work
concerning the use of the log2DFT on ancient histor-
ical manuscripts, this value was a subjective decision
made to balance the feature vector detail level with
the feature vector length and acts as a parameter to
ICPRAM 2023 - 12th International Conference on Pattern Recognition Applications and Methods
700
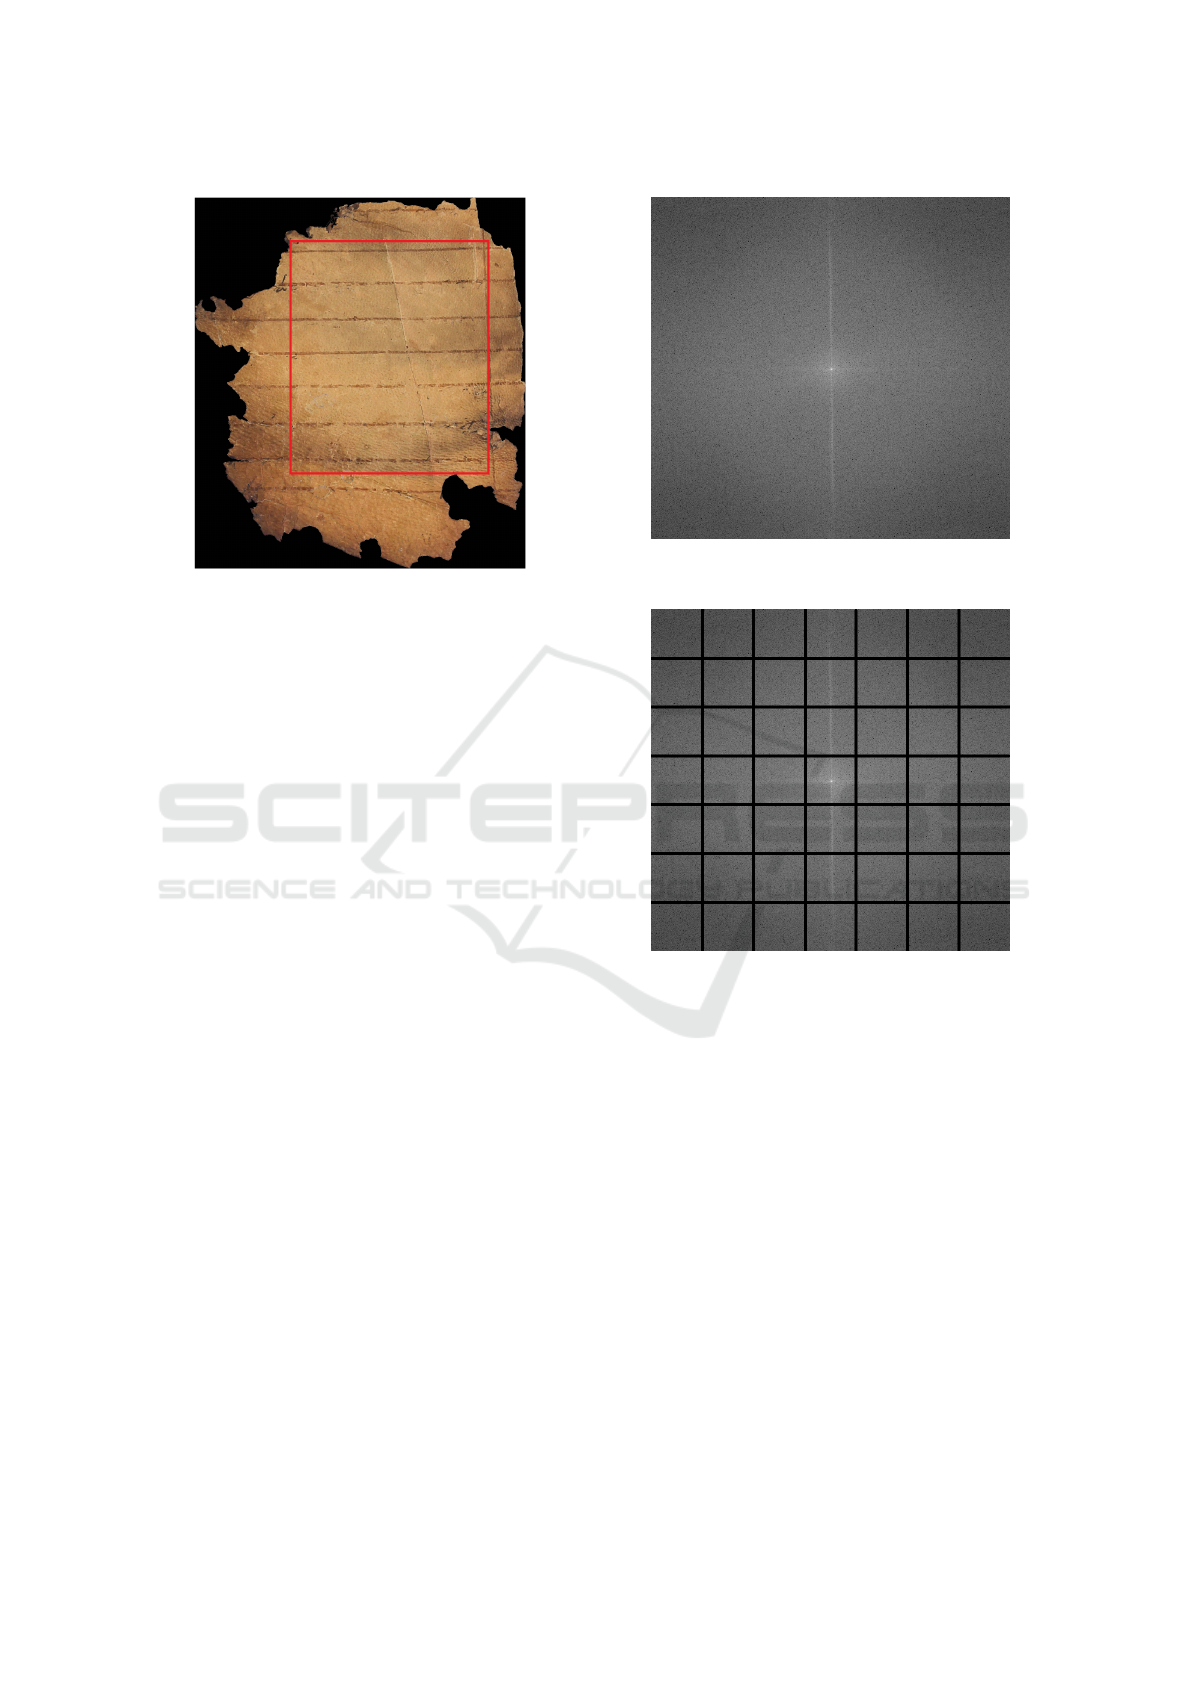
Figure 6: Sample area from a fragment extracted from the
color image of plate 1039-2 (Set-1). The largest internal
inscribed rectangle (by area) is found. Samples used for
feature vector creation will be taken from this area at evenly
spaced intervals.
be optimized in future work. The mean of the values
in each section is calculated, and the values are con-
catenated to produce a feature vector for the sample
image. This process is repeated for the standard de-
viation of the pixels, resulting in two separate feature
vectors for a sample (mean feature vector as MFV and
standard deviation feature vector as SDFV). These are
known as the primary feature vectors. In addition,
three secondary feature vectors are proposed, making
five in total. The first is a feature vector based on
dividing the log2DFT into six concentric rings (fig-
ure 9). Similar to the primary feature vectors, the
mean and standard deviation of the pixel values in
each ring are calculated and separately concatenated
to produce two feature vectors. The decision to in-
clude a concentric ring feature vector is based on the
rotational variance of the log2DFT, with the orienta-
tion of the sample potentially affecting classification
performance. A final feature vector based on work
by (Cevikalp and Kurt, 2017) is trialed. This method
uses each pixel’s magnitude and phase angle from a
log2DFT. The magnitude acts as a weighted vote and
deposits the pixel into one of nineteen phase angle
bins, evenly spaced from 0 to 2π. The value across all
bins is normalized to one and concatenated to produce
a 1 × 19 feature vector for the sample.
2.5 Classification
Each of the five proposed feature vectors is handled
independently in the same way. Considering only one
feature vector at a time, each sample has its associ-
Figure 7: Visual representation of the log2DFT applied to a
parchment-image sample.
Figure 8: The grid is used to create the primary feature vec-
tors. The mean and standard deviation of the pixel values in
each grid area are used as the basis for the feature vectors.
ated feature vector and ground truth, parchment or
papyrus, stored in a dictionary. There are 825 indi-
vidual dictionary entries. A leave-one-out method is
then employed. All 25 feature vectors of a fragment
are removed from the dictionary. These feature vec-
tors are now effectively unseen. Each of the 25 re-
moved vectors is compared against the remaining set
stored in the dictionary to find its closest match. This
match is based on the Euclidean distance between
the two vectors. Once the closest feature vector in
the dictionary has been found, its associated ground
truth is recorded. The number of matches labeled as
parchment is compared to the number labeled as pa-
pyrus, providing a percentage of belief as to the frag-
ment’s material. The fragment is classified based on
the greater percentage. This is repeated for all frag-
ments. The F-scores at both the fragment and sam-
Image-Based Material Analysis of Ancient Historical Documents
701

Figure 9: The concentric ring division is used in the con-
struction of secondary feature vectors. The mean and stan-
dard deviation of the pixel values in the ring area are used
as the basis for the feature vectors.
ple levels are calculated. The traditional balanced F
1
score is used (eq. 1).
F
1
= 2 ·
precision · recall
precision + recall
(1)
3 RESULTS
In total, 33 fragments (23 parchments, 10 papyrus)
were used. Table 2 shows the overall classification
success percentage for the image types using the pri-
mary feature vectors MFV and SDFV. Tables 3 and 4
show the confusion matrices for the results of the pri-
mary feature vectors. Tables 5 and 6 show the preci-
sion, recall, and F-score for classification at the frag-
ment and sample levels for the primary feature vec-
tors. The three secondary feature vectors showed less
successful results (For further details, please see the
tables in Appendix B).
Table 2: Classification success (%) for primary feature vec-
tors (MFV and SDFV).
Image type MFV SDFV
Color 90.9 90.9
Multispectral 97.0 97.0
4 DISCUSSION
This study presented a binary 2DFT-based tech-
nique to classify material used in ancient historical
manuscripts, specifically the DSS. This technique,
Table 3: Confusion matrix (%) for the MFV.
Image type True class Classified as
Parchment Papyrus
Color
Parchment 100.0 0.0
Papyrus 30.0 70.0
Multispectral
Parchment 100.0 0.0
Papyrus 10.0 90.0
Table 4: Confusion matrix (%) for the SDFV.
Image type True class Classified as
Parchment Papyrus
Color
Parchment 95.7 4.3
Papyrus 20.0 80.0
Multispectral
Parchment 100.0 0.0
Papyrus 10.0 90.0
Table 5: Precision, Recall and F-score for classification at
the fragment level.
Image Mean Feature Vector (MFV)
Material Precision Recall F-score
Color
Parchment 0.88 1 0.94
Papyrus 1 0.70 0.82
Multispc.
Parchment 0.96 1 0.98
Papyrus 1 0.90 0.95
Image Std. Dev. Feature Vector (SDFV)
Color
Parchment 0.92 0.96 0.94
Papyrus 0.89 0.80 0.84
Multispc.
Parchment 0.96 1 0.98
Papyrus 1 0.90 0.95
Table 6: Precision, Recall and F-score for classification at
the sample level.
Image Mean Feature Vector (MFV)
Material Precision Recall F-score
Color
Parchment 0.85 0.91 0.88
Papyrus 0.77 0.64 0.70
Multispc.
Parchment 0.93 0.96 0.95
Papyrus 0.91 0.84 0.87
Image Std. Dev. Feature Vector (SDFV)
Color
Parchment 0.85 0.89 0.87
Papyrus 0.72 0.64 0.68
Multispc.
Parchment 0.91 0.96 0.93
Papyrus 0.89 0.78 0.83
concerning the primary feature vectors (based on
Fourier-space grid representation) used in conjunc-
tion with the multi-spectral images, showed a rela-
tively high level of performance with regards to over-
all classification percentage (≈ 97% compared to ≈
91% successful classification for MS and color im-
ages respectively) across both primary feature vec-
tors. In addition, the mean feature vector produced
slightly improved results than the standard deviation
feature vector. This was particularly true for classi-
fication accuracy as measured by F-score values at
the sample level. The papyrus images were, in gen-
ICPRAM 2023 - 12th International Conference on Pattern Recognition Applications and Methods
702

eral, more susceptible to misclassification than parch-
ment images, showing lower recall and F-scores in
their classification than parchment samples (tables 5
and 6).
When combined with multi-spectral images and
using the MFV, the proposed technique achieved the
highest accuracy. This is also the case for color
images. This result may prove helpful for future
work involving manuscripts that have not been pho-
tographed using multi-spectral equipment. Several
reasons may explain the difference in performance be-
tween the multi-spectral and the color images. For ex-
ample, the multi-spectral images reveal more discrim-
inatory patterns, periodic frequencies, magnitudes,
and details in the materials of the image compared
to the color images. This arises from the different
wavelengths of light highlighting different material
details. The recombination of the images of differ-
ent wavelengths may have captured more features that
make each material unique for the log2DFT method.
The multi-spectral images were also of higher resolu-
tion, enabling the visual-based technique to discrimi-
nate more clearly between materials. By investigating
the different spectral band images individually, the
band that provides the best results could be used in
further research. This approach has potential impli-
cations for photographing decisions concerning other
manuscripts. The MFV performed at least as well as
the SDFV regarding the F-score. This may suggest
that measures of the spread between pixel values in
grid sections provide less discriminatory ability than
measures concerning the value of the pixels.
Further work may investigate which particular fre-
quencies and associated magnitudes improve discrim-
ination between particular materials. This study used
a selection of images to create a dictionary of fea-
ture vectors. These images were chosen based on
a subjective view that they captured a high propor-
tion of the different types of textures of parchment
and papyrus and represented the DSS collection as
a whole. However, there were fewer papyrus ex-
amples in the set than parchment. As a result, the
papyrus samples proved more challenging to clas-
sify accurately. By expanding the dictionary set,
an improved representation of the collection can be
achieved, which could yield higher classification re-
sults from a larger and more balanced data set, par-
ticularly attempting to improve the classification of
papyrus fragments. Therefore, more examples would
be encountered, and closer matches to novel samples
may be made. The measured voting procedure would
then use more votes to confirm a classification, im-
pacting the belief percentage per sample. The use
of binary text masks was beneficial in filling the im-
ages. However, access to such materials may not al-
ways be possible. In a small minority of cases, most
notably affecting some papyrus manuscripts, some of
the binary images did not capture all the text on the
manuscripts. This could have influenced the results,
mainly where we see a slightly worse performance
for classifying the papyrus fragments which exhibited
more residue text post-fill. A fixed number of samples
and a fixed log2DFT feature vector grid were used
in this study. A suggestion for further work would
be to investigate whether changing these parameters
could improve the results. The secondary, i.e., the
concentric Fourier-space feature vector results show
relatively poorer performance than the primary fea-
ture vectors, particularly concerning the papyrus frag-
ments (For further details, please see Appendix C).
Instead, using wedges radiating from the origin of a
centered 2DFT in the feature construction process is
a possible pathway for improving this method, mainly
if texture patterns exhibit edges or lines in a particular
direction, such as with papyrus (Sonka et al., 2015).
With reference to the modified weighted bin feature
vector, which showed success in the study by (Ce-
vikalp and Kurt, 2017), this was particularly evident,
achieving a low 10% success rate for papyrus images
(For further details, please see the tables in Appendix
B).
The image data set used in the research consisted
of real-world objects set in a context, which may not
have been appropriate for this study. This study’s rel-
atively simplistic periodic patterned images may not
have provided enough discriminatory differences for
this method to work effectively. The alternative sec-
ondary feature vector based on a concentric ring ap-
proach also demonstrated poor performance on pa-
pyrus fragments. This may suggest that periodic pat-
tern discrimination is more than simply the distance
from the center of the visualized log2DFT. The posi-
tion of the pixels in a log2DFT image space and the
frequencies and magnitudes they represent may hold
vital information which helps improve the classifica-
tion.
5 CONCLUSION
The work of this article used a 2DFT-based feature
vector technique in the binary classification of the sur-
face material of the DSS, achieving a performance
of up to ≈ 97%. It offers an accurate and accessi-
ble way to classify the material of ancient historical
manuscripts without the need for more labeled data
(in the case of neural networks) or damaging methods
(for example, chemical analysis). This study provides
Image-Based Material Analysis of Ancient Historical Documents
703

an initial foray into using a 2DFT technique to per-
form material classification of such manuscripts. The
ability to quickly classify the writing surface material
has the potential to expedite the initial manuscript in-
vestigation. The straightforward approach presented
here may be used as a starting point to help resolve
any debate over the nature of a DSS fragment’s ma-
terial and may be applied to other ancient historical
manuscripts. Furthermore, by building upon and de-
veloping the proposed system, this method demon-
strates a potential for use in helping to answer more
specialized questions. Examples may include intra-
material classification to provide evidence for differ-
ing production techniques and/or manuscript dating.
The consequences of gaining such insight by substi-
tuting in the proposed technique are threefold; the
preservation of delicate ancient manuscripts from fur-
ther degradation, a relatively low cost uncomplicated
implementable method, and an additional extendable
tool in gathering evidence to help conclude the ques-
tions surrounding the production of such manuscripts.
ACKNOWLEDGMENT
The authors like to thank Mladen Popovi
´
c, PI of
the European Research Council (EU Horizon 2020)
project: The Hands that Wrote the Bible: Digital
Palaeography and Scribal Culture of the Dead Sea
Scrolls (HandsandBible 640497), who allowed work
with the data and provided valuable inputs and the la-
bels for the materials. Finally, for the high-resolution
images of the Dead Sea Scrolls, we are grateful to
the Israel Antiquities Authority (IAA), courtesy of the
Leon Levy DSS Digital Library; photographer: Shai
Halevi.
REFERENCES
Abitbol, R. and Shimshoni, I. (2021). Machine Learning
Based Assembly of Fragments of Ancient Papyrus.
ACM Journal on Computing and Cultural Heritage,
14(3).
Bajcsy, R. (1973). Computer description of textured sur-
faces. Ijcai, pages 572–579.
Bell, S., Upchurch, P., Snavely, N., and Bala, K. (2015).
Material recognition in the wild with the Materials in
Context Database. Proceedings of the IEEE Computer
Society Conference on Computer Vision and Pattern
Recognition, 07-12-June:3479–3487.
Bharati, M. H., Liu, J. J., and MacGregor, J. F. (2004).
Image texture analysis: Methods and comparisons.
Chemometrics and Intelligent Laboratory Systems,
72(1):57–71.
Camargo, A. and Smith, J. S. (2009). Image pattern classifi-
cation for the identification of disease causing agents
in plants. Computers and Electronics in Agriculture,
66(2):121–125.
Cevikalp, H. and Kurt, Z. (2017). the Fourier Transform
Based Descriptor for Visual Object Classification.
Anadolu University journal of Science and Technol-
ogy - Applied Sciences and Engineering, 18(1):247–
247.
Criminisi, A., P
´
erez, P., and Toyama, K. (2004). Region
filling and object removal by exemplar-based image
inpainting. IEEE Transactions on Image Processing,
13(9):1200–1212.
Dhali, M. A., de Wit, J. W., and Schomaker, L. (2019).
BiNet: Degraded-Manuscript Binarization in Diverse
Document Textures and Layouts using Deep Encoder-
Decoder Networks. arXiv.
Dhali, M. A., He, S., Popovi
´
c, M., Tigchelaar, E., and
Schomaker, L. (2017). A digital palaeographic ap-
proach towards writer identification in the dead sea
scrolls. ICPRAM 2017 - Proceedings of the 6th In-
ternational Conference on Pattern Recognition Appli-
cations and Methods, 2017-Janua(Icpram):693–702.
Dhali, M. A., Jansen, C. N., de Wit, J. W., and Schomaker,
L. (2020). Feature-extraction methods for histori-
cal manuscript dating based on writing style develop-
ment. Pattern Recognition Letters, 131:413–420.
Franzen, F. and Yuan, C. (2019). Visualizing image clas-
sification in fourier domain. ESANN 2019 - Proceed-
ings, 27th European Symposium on Artificial Neural
Networks, Computational Intelligence and Machine
Learning, 27(April):535–540.
Freedman, J., van Dorp, L., and Brace, S. (2018). Destruc-
tive sampling natural science collections: an overview
for museum professionals and researchers. Journal of
Natural Science Collections, 5:21–34.
Hassner, M. and Sklansky, J. (1980). The use of Markov
Random Fields as models of texture. Computer
Graphics and Image Processing, 12(4):357–370.
Hu, X. and Ensor, A. (2019). Fourier Spectrum Image Tex-
ture Analysis. International Conference Image and
Vision Computing New Zealand, 2018-Novem(1):1–6.
Hui, S. and Zak, S. H. (2014). Discrete Fourier trans-
form based pattern classifiers. Bulletin of the Polish
Academy of Sciences: Technical Sciences, 62(1):15–
22.
Kalliatakis, G., Stamatiadis, G., Ehsan, S., Leonardis, A.,
Gall, J., Sticlaru, A., and McDonald-Maier, K. D.
(2017). Evaluating deep convolutional neural net-
works for material classification. arXiv, 2.
Kliangsuwan, T. and Heednacram, A. (2018). FFT features
and hierarchical classification algorithms for cloud
images. Engineering Applications of Artificial Intel-
ligence, 76(May 2016):40–54.
Kumar, Y., Jajoo, G., and Yadav, S. K. (2020). 2d-fft based
modulation classification using deep convolution neu-
ral network. In 2020 IEEE 17th India Council Inter-
national Conference (INDICON), pages 1–6. IEEE.
Loll, C., Quandt, A., Mass, J., Kupiec, T., Pollak, R., and
Shugar, A. (2019). Museum of the Bible Dead Sea
ICPRAM 2023 - 12th International Conference on Pattern Recognition Applications and Methods
704

Scroll Collection Scientific Research and Analysis.
Final Report, Art Fraud Insights online.
Matsuyama, T., Miura, S. I., and Nagao, M. (1983). Struc-
tural analysis of natural textures by Fourier transfor-
mation. Computer Vision, Graphics and Image Pro-
cessing, 24(3):347–362.
Popovi
´
c, M., Dhali, M. A., and Schomaker, L. (2021). Arti-
ficial intelligence based writer identification generates
new evidence for the unknown scribes of the dead sea
scrolls exemplified by the great isaiah scroll (1qisaa).
PloS one, 16(4):e0249769.
Rabin, I. (2013). Archaeometry of the dead sea scrolls.
Dead Sea Discoveries, 20(1):124–142.
Shor, P. (2014). The Leon Levy Dead Sea scrolls digital
library. The digitization project of the dead sea scrolls.
Scholarly Communication, 2(2):11–20.
Sonka, M., Hlavac, V., and Boyle, R. (2015). Image Pro-
cessing, Analysis, and Machine Vision. Thomson-
Engineering, 4th edition.
Tesfaldet, M., Snelgrove, X., and Vazquez, D. (2019).
Fourier-CPPNs for image synthesis. Proceedings -
2019 International Conference on Computer Vision
Workshop, ICCVW 2019, pages 3173–3176.
Wolff, T., Rabin, I., Mantouvalou, I., Kanngießer, B.,
Malzer, W., Kindzorra, E., and Hahn, O. (2012).
Provenance studies on Dead Sea scrolls parchment by
means of quantitative micro-XRF. Analytical and Bio-
analytical Chemistry, 402:1493–1503.
Wu, X., Shivakumara, P., Zhu, L., Zhang, H., Shi, J., Lu, T.,
Pal, U., and Blumenstein, M. (2018). Fourier Trans-
form based Features for Clean and Polluted Water Im-
age Classification. Proceedings - International Con-
ference on Pattern Recognition, 2018-Augus:1707–
1712.
APPENDIX A
Table 7: Plate Numbers of the Fragments used in the study.
Plate number No. of Fragments Material
1039-2 5 Parchment
155-1 1 Parchment
193-1 1 Parchment
228-1 1 Parchment
269 1 Parchment
489 1 Parchment
641 1 Parchment
974 1 Parchment
975 1 Parchment
976 4 Parchment
977 4 Parchment
978 1 Parchment
979 1 Parchment
5-6Hev45 1 Papyrus
641 1 Papyrus
X100 1 Papyrus
X106 1 Papyrus
X130 1 Papyrus
X207 3 Papyrus
X304 1 Papyrus
Yadin50 1 Papyrus
APPENDIX B
Table 8: Confusion matrix (%) for Mean Concentric Ring
Feature Vector.
Image type True class Classified as
Parchment Papyrus
Color
Parchment 100.0 0.0
Papyrus 40.0 60.0
Multispectral
Parchment 87.0 13.0
Papyrus 70.0 30.0
Table 9: Confusion matrix (%) for Standard Deviation Con-
centric Ring Feature Vector.
Image type True class Classified as
Parchment Papyrus
Color
Parchment 100.0 0.0
Papyrus 20.0 50.0
Multispectral
Parchment 91.3 8.7
Papyrus 50.0 50.0
Image-Based Material Analysis of Ancient Historical Documents
705

Table 10: Confusion matrix (%) for the Weighted Bin Fea-
ture Vector.
Image type True class Classified as
Parchment Papyrus
Color
Parchment 100.0 0.0
Papyrus 100.0 0.0
Multispectral
Parchment 95.7 4.3
Papyrus 90.0 10.0
APPENDIX C
Figure 10: Binary text mask was taken from plate 976 in
un-dilated form.
Figure 11: Binary text mask was taken from plate 976 after
applying dilation to capture all written markings.
ICPRAM 2023 - 12th International Conference on Pattern Recognition Applications and Methods
706
