
Event-Related Desynchronization Analysis During Action
Observation and Motor Imagery of Transitive Movements
Stefania Coelli
1a
, Alessandra Calcagno
1b
, Federico Temporiti
1,2 c
, Roberto Gatti
2,3 d
,
Manuela Galli
1e
and Anna M. Bianchi
1f
1
Department of Electronic, Information and Bioengineering, Politecnico di Milano, Milan, Italy
2
Physiotherapy Unit, Humanitas Clinical and Research Center - IRCCS, Rozzano, Milan, Italy
3
Department of Biomedical Sciences, Humanitas University, Pieve Emanuele, Milan, Italy
roberto.gatti@hunimed.eu
Keywords: Electroencephalography, Action Observation, Motor Imagery.
Abstract: Rehabilitation and motor skill learning approaches based on Action Observation (AO) and Motor Imagery
(MI) rely on the assumption that the sensorimotor system is stimulated by AO and MI tasks similarly to the
actual execution of a movement. An advantage of AO over MI is that it is less dependent on subject’s
imagination ability, and a direct comparison of their effect on cortical activations during complex upper limb
movements has been rarely examined. Therefore, in this study we compare sensorimotor event related
desynchronization (ERD) patterns, as a measure of cortical activation, collected from 46 healthy volunteers
performing AO and MI protocols. In both mu and beta sensorimotor rhythms a stronger ERD was elicited by
AO, characterized by an evident lateralization in the contralateral side of the brain with respect to the limb
involved in the observed movement.
1 INTRODUCTION
The mirror mechanism is related to the response of
the brain that transforms the visual perception of
actions, performed by others, into a motor
representation in the brain of the observer (Rizzolatti
and Sinigaglia, 2010). It has been shown that, during
action observation (AO), the cortical areas that are
normally activated during motor execution (ME), are
similarly activated, supporting the existence of the so-
called motor-resonance phenomenon, even if several
factors influence the patterns and the strength of such
response (Kemmerer, 2021). These factors may be
grouped in four categories according to Kemmerer: i)
relation between agent and observer, ii) factors
involving the action, iii) factors involving the actors
and iv) factors related to the observer. Also the
action’s context may play a role (Kemmerer, 2021).
a
https://orcid.org/0000-0003-4104-4790
b
https://orcid.org/0000-0003-3989-1712
c
https://orcid.org/0000-0003-1771-2365
d
https://orcid.org/0000-0002-4669-1287
e
https://orcid.org/0000-0003-2772-4837
f
https://orcid.org/0000-0002-8290-7460
Researches in recent years have demonstrated, for
example, that the observation of a movement from a
first person perspective produces a stronger
modulation of the Rolandic sensorimotor rhythms
(Angelini et al., 2018; Drew et al., 2015). Moreover,
watching a transitive motor task (i.e., object directed)
is more engaging than observing an intransitive action
(Coll et al., 2017). The possibility of using the mirror
mechanism to stimulate the sensorimotor system has
been exploited as an innovative rehabilitation
approach called Action Observation Therapy
(Calcagno et al., 2022; Rizzolatti et al., 2021;
Temporiti et al., 2020). This motor learning approach
could be adopted to facilitate another promising
framework for the acquisition and recovery of motor
skills, that is the internal simulation of motor action,
i.e. Motor Imagery (MI) (Daeglau et al., 2021;
Gonzalez-Rosa et al., 2015). Like AO, MI has been
86
Coelli, S., Calcagno, A., Temporiti, F., Gatti, R., Galli, M. and Bianchi, A.
Event-Related Desynchronization Analysis During Action Observation and Motor Imagery of Transitive Movements.
DOI: 10.5220/0011740600003414
In Proceedings of the 16th International Joint Conference on Biomedical Engineering Systems and Technologies (BIOSTEC 2023) - Volume 4: BIOSIGNALS, pages 86-93
ISBN: 978-989-758-631-6; ISSN: 2184-4305
Copyright
c
2023 by SCITEPRESS – Science and Technology Publications, Lda. Under CC license (CC BY-NC-ND 4.0)

shown to activate the similar brain network also
supporting ME in studies employing
Electroencephalography (EEG) to monitor brain
response (Gonzalez-Rosa et al., 2015; Neuper et al.,
2005). Nevertheless, in term of rehabilitation
practice, the efficacy of MI paradigms is limited by
the ability of the subjects in performing a correct
imagination task, even of simple movements, while
the observation of complete and transitive
movements is believed to strongly activate the
sensorimotor cortex.
The dynamical activation of the brain during
motor- and sensorial- related stimulation is typically
measured by the event-related desynchronization
(ERD) of the sensorimotor cortical rhythms in the mu
(8-12 Hz) and beta (14-24 Hz) EEG frequency bands
over central motor areas of the brain (Neuper et al.,
2005; Tacchino et al., 2017). Few studies presented a
direct comparison of the ERD patterns characterizing
AO and MI of complex movement (Gonzalez-Rosa et
al., 2015), in order to understand to which extent they
overlap. To address this topic, in the current study, we
compare sensorimotor ERD patterns extracted from
EEG signals acquired on a group of healthy young
volunteers performing AO and MI protocols.
Specifically, three complex transitive manual
dexterity tasks were employed and the effect of the
different complexity of the movement was further
studied.
2 MATERIALS AND METHODS
2.1 Data Acquisition
During the experiment, EEG signals were collected
from 46 right-handed healthy participants (Age: 20-
30, 22 female) using a 61-channel cap and the SD
LTM 64 express polygraph recording system
(Micromed, Mogliano Veneto, Italy). Signals were
sampled at 1024 Hz and the impedances were kept
under 20KOhm using a conductive hydrogel.
The action observation (AO) and motor imagery
(MI) protocol was approved by the Internal Ethical
Committee of the Istituto Clinico Humanitas
(Rozzano, Italy). All the subjects signed an informed
consent before the recordings. The stimulation
sequence consisted in the presentation of a 6.5-s-long
video-clip containing an upper limb movement
performed from the visual perspective of the subject
(1st person) and executed by a gender-matched actor.
Only the upper limb of the actor was visible. The
video-clip was preceded by a 3-s period of rest
(fixation of a cross) and 2 seconds of preparation (red
dot) displayed on a screen positioned in front of the
participant. The stimulation sequence was repeated
for 20 trials. The same sequence was repeated for the
motor imagery task but, in this case, only the first
frame of the video was shown for the same amount of
time (6.5 seconds). During the motor imagery task,
participants were asked to image performing the
movement themselves. Again, 20 trials were
recorded. AO and MI sequences together formed a
single stimulation block. Three stimulation blocks
(W1, W2 and W3) were delivered to participants
separated by resting periods during which volunteers
were free to move. In each block a different transitive
movement was shown in the video-clip (Figure 1).
The three movements were characterized by a
different level of interaction with objects. W1
consisted in picking-up five small coins, W2
presented the use of a hammer to hit a nail, and W3
displayed the interaction with tweezers to move a
small object into a plastic glass. The presentation
order of the videos was randomized.
2.2 Data Pre-Processing and Analysis
EEG signals were pre-processed using EEGLAB
toolbox and custom scripts optimized for the study
aim (Cassani et al., 2022). First, data were band-pass
filtered between 1 and 45 Hz with a FIR, zero-phase
filter, down sampled to 256 Hz and bad channels were
visually selected and removed. Signals were cut into
epochs from -5 to +6.5 seconds with respect to the
main stimulus presentation (start of the video/frame
presentation). The extended Infomax independent
component analysis was applied to the concatenated
epochs and with the support of the IClabel plugin
(Pion-Tonachini et al., 2019), the source of artifacts
were identified and removed. The previously rejected
bad channels were interpolated, and signals were re-
referenced to the common average reference. Finally,
epochs with residual artefacts were visually checked
and rejected.
Cleaned trials of each participant, separately for
AO and MI were used to compute the time-frequency
representation. The time-frequency analysis was
performed through EEGLAB toolbox using Morlet
wavelets starting from 3 cycle and expanding linearly
with the frequency for continuous transform as
suggested in the literature (Angelini et al., 2018;
Avanzini et al., 2012; Tacchino et al., 2017). EEG
power values were calculated for 145 linearly spaced
frequencies (from 4 Hz to 30 Hz) and along 200 time
bins resulting in a time resolution of ~0.05 seconds.
To select both the individual baseline period and the
mu frequency range, the two-second period from -4
Event-Related Desynchronization Analysis During Action Observation and Motor Imagery of Transitive Movements
87
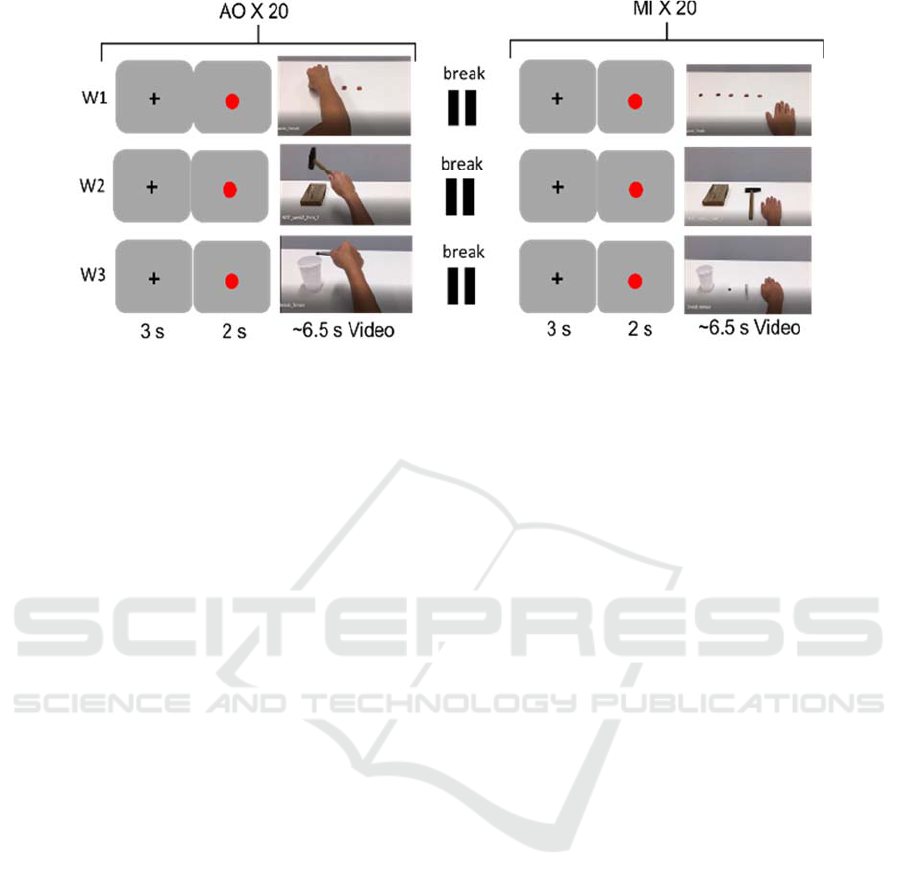
Figure 1: Stimulation sequence for action observation (AO) and motor imagery (MI) tasks.
to -2 sec with respect the main stimulus presentation,
corresponding to the cross fixation, was analyzed at
C3 channel position.
We identified the best baseline interval as the 1-s-
long segment (50% overlapping moving window)
showing the highest power value associated to the
averaged alpha power between 8 and 12 Hz. Once the
baseline had been selected, the individual mu
frequency (IMF) was identified as the power peak
between 8 and 12 Hz in the baseline. This procedure
was repeated for the six conditions (AO/MI; three
videos W1, W2 and W3). While the specific baseline
was selected in each condition, the final IMF was
obtained as the median of the six values extracted. We
then defined the mu band as the frequency range
between IMF-1 Hz and IMF+1 Hz, while the standard
low beta frequency range was used [14 - 20] Hz
(Angelini et al., 2018). In the two frequency ranges
the %ERD was finally computed along each time bin
t as in (1)
%ERD(t)=(P(t)-B)/B*100 (1)
where P(t) is the mean power in the analyzed
frequency range at each time-point, and B the power
of the same frequency range averaged in the selected
baseline period. The ERD time course was divided
into consecutive and not overlapping 1-s-long time
windows from -1 to +4 seconds and the mean %ERD
value for each window was computed. The ERD time
course was further analyzed restricted to six brain
regions of interest (B-ROI) averaging the ERD at the
channel position associated to each B-ROI: Frontal
left (FRL: F3, FC1, FC3), Frontal right (FRR: F4,
FC2,FC4 ), Central Left (CL: C1, C3, C5), Central
right (CR: C2, C4, C6), Centro-Parietal left (CPL:
CP3, CP1, P3) and Centro-Parietal right (CPR: CP4,
CP6 , P4). The asymmetry of the Centro-parietal area
is due to the removal of some EEG channels (e.g.,
CP5 and CP2) operated by the acquisition system in
order to simultaneously acquire EMG bipolar signals.
Two repeated measure ANOVAs were applied to
the data, one for each frequency range, with 4 within
factors: 3 video Types (W) x 6 B-ROIs x five Time
windows (f0 = pre stimulus ERD, from f1 to f4 post
stimulus segments) x 2 Tasks (AO and MI). Data
were first tested for normality and log-transformed
when necessary. Outliers were also detected (> 3*SD
of the ERD percentage value) and if the participants
were identified as outlier in at least two windows and
more than two brain areas, their data were discarded.
This choice was made to easily and automatically
recognize subjects with an abnormal behaviour (6
subject were removed). When the sphericity of the
variances was not respected, the Greenhouse-Geisser
correction was applied.
3 RESULTS
3.1 Individual Mu-Rhythm
Modulations
Figure 2 displays for each time window and video
type, the mean and standard error values for both
action observation and motor imagery tasks
computed on the final set of 40 participants.
The ANOVA test identified a significant main effect
for the factor Task (F(1,40)=20.39; p= 5.46e-05), B-
ROIs (F(3.4,136.2)=22.83; p = 4.73e-13) and Time
(F(1.5,61.2)=37.4; p= 7.27e-10), but not for video
Type (F(2,80)=0.69; p= 0.5)). A significant Task*B-
ROI*Time interaction was detected (F(8.5,
341.2)=2.04; p=0.037), and the following two-factors
interactions: Task*B-ROI (F(3.65, 145.9)=6.73; p=
BIOSIGNALS 2023 - 16th International Conference on Bio-inspired Systems and Signal Processing
88
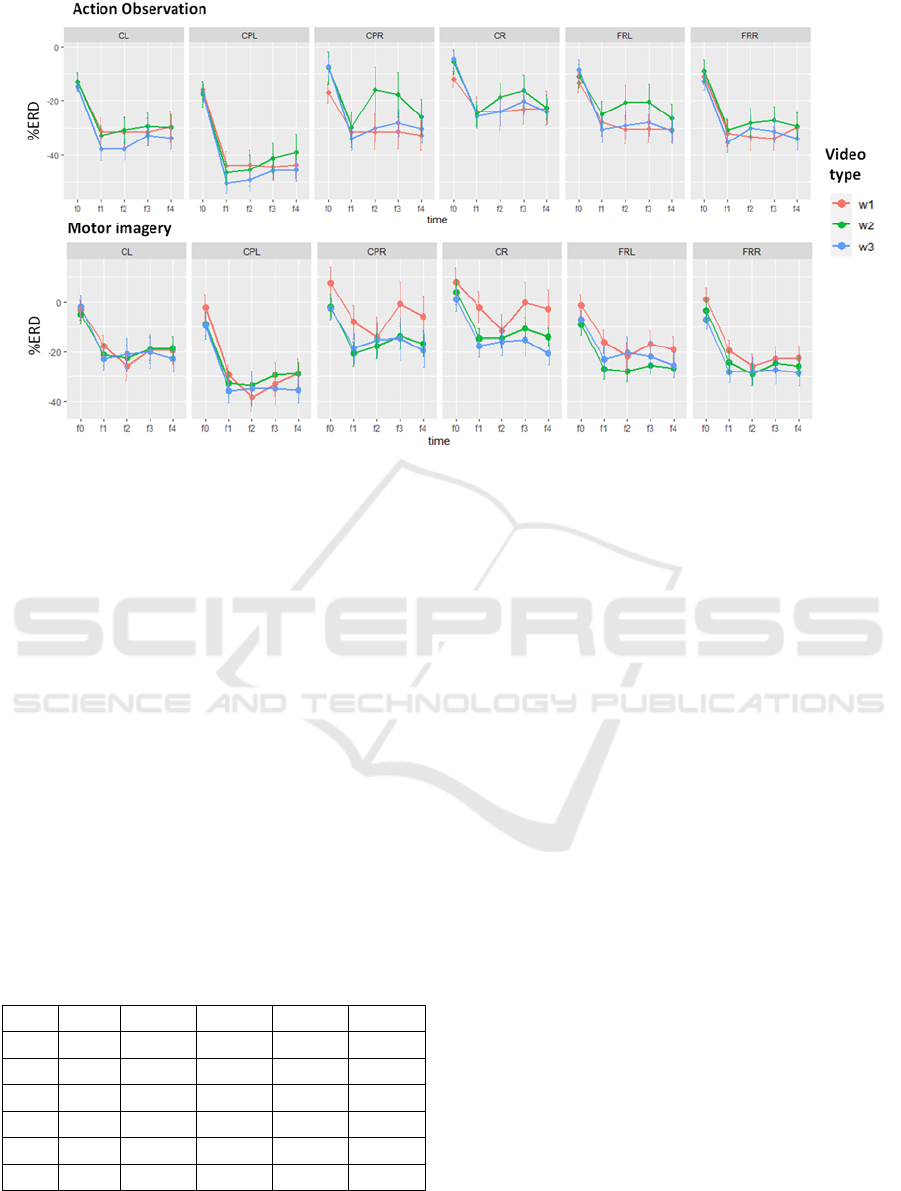
Figure 2: Mean and standard error of the mean (SEM) of mu-rhythm %ERD values for the five windows of interest (-1s to
+4 s) of both AO and MI tasks in each analyzed region of the scalp. Colours represent different video types. CL: central left,
CPL: centro-parietal left, CPR: centro parietal right, CR: central right, FL: frontal left and FR: frontal right.
9.45e-05), B-ROI*Time (F(5.8,232.8)=13.5; p= 7e-
13), Task*Time (F(2.43,97.4)=4.2; p=0.013). Finally
the interaction W*Time was also significant
(F(5.7,226.6)=2.27; p= 0.042).
Splitting by brain regions, significant interaction
between task and time were found in three regions,
namely CL (F(3.1,377.6)=5.3; p=0.001),
CPL(F(3.1,381.8)=9.4; p=3.42e-06) and
CPR(F(3.2,390.4)=9.4; p= 0.005). In these regions, the
task effect was significant in each window (p<0.005)
indicating a stronger ERD for the AO task (Table 1).
Splitting the ANOVA by tasks, we found for the
AO a significant interaction B-ROI*Time (F(6.99,
286.51)=0.349, p= 2.64e-11).
Table 1: P-values of the significant differences between
task type (AO vs MI) in each B-ROIs and window of the
mu ERD. CL: central left, CPL: centro-parietal left, CPR:
centro parietal right, CR: central right, FL: frontal left and
FR: frontal right.
ROI f0 f1 f2 f3 f4
CL 0.001 9.6e-10 0.0001 8.8e-06 3.1e-06
CPL 0.005 4.5e-10 0.0002 0.0001 9.2e-07
CPR 0.003 7.3e-09 7.2e-05 4.5e-05 1.1e-06
CR 0.004 6.2e-07 0.0002 0.001 3.2e-05
FRL 0.002 0.02 0.002
FRR 0.018 3.5e-05 0.008 0.004
Splitting again by time, in every time window after
the stimulus presentation a significant effect of the
ROI was found, while no effect was found in f0 after
Bonferroni's correction. The post-hoc analysis with
Bonferroni’s correction (Table 1) showed a stronger
mu ERD in the left centro-parietal (CPL) ROI with
respect to all the other ROIs in each time window
during video observation. The left central ROI
showed a significantly stronger ERD in each window
with respect to CR, supporting the lateralization of the
mu-rhythm modulation. The two frontal areas were
never different. Investigating the time effect in each
B-ROI (Table 2) we found that in each region, f0 was
different from all the other time windows suggesting
a strong effect of the video presentation (p <0.0001).
Moreover, significant differences were observed in
CL, CPL and CR between f2 and f3, due to a partial
re-synchronization in f3 (p
CL
=0.025; p
CPL
=0.001 and
p
CR
=0.033).
Concerning the MI, we found a significant B-
ROI*Time interaction (F(6.29, 251.58)=0.4, p=
4.28e-08), but also a W*time significant interaction
(F(6.17, 246.6)=0.77, p =0.02). Exploring the first, in
every time window a significant effect of the ROI was
found. The post-hoc analysis with Bonferroni's
correction showed a stronger mu ERD in the left
centro-parietal (CPL) ROI with respect to all the other
ROIs in each time window from f1 to f4, but also with
respect to CL, CPR and CR in f0.
Event-Related Desynchronization Analysis During Action Observation and Motor Imagery of Transitive Movements
89

Table 2: Corrected p-values of the significant differences among B-ROIs in each task and window of the mu ERD. CL: central
left, CPL: centro-parietal left, CPR: centro parietal right, CR: central right, FL: frontal left and FR: frontal right.
AO MI
f0 f1 f2 f3 f4 f0 f1 f2 f3 f4
CL Vs CPL 1.0e-13 1.6e-12 9.3e-14 1.0e-11 0.042 1.7e-13 3.1e-13 7.1e-10 2.2e-09
CL Vs CPR
CL Vs CR 1.2e-08 1.9e-10 3.96e-11 4.86e-07 8.4e-05 7.0e-07 1.1e-05 0.0002
CL Vs FRL 0.045 0.01
CL Vs FRR
CPL Vs CPR 1.4e-07 2.2e-10 3.7e-10 1.64e-06 0.035 1.8e-08 6.1e-11 4.3e-08 5.2e-07
CPL Vs CR 4.5e-18 6.0e-21 5.18e-24 3.52e-16 3.88e-05 4.48e-17 7.9e-19 3.9e-14 8.8e-13
CPL Vs FRL 6.8e-14 2.1e-16 2.4e-13 1.1e-10 1.1e-06 1.3e-08 9.7e-06 2.7e-05
CPL Vs FRR 7.8e-14 1.6e-17 8.2e-16 3.3e-12 3.7e-07 3.2e-09 1.5e-05 2.5e-05
CPR Vs CR 1.1e-07 0.0009 1.2e-05 6.5e-06 0.007 0.033
CPR Vs FRL
CPR Vs FRR 0.021
CR Vs FRL 0.001 0.007 0.0007 1.3e-07 4.3e-06 6.9e-07 1.4e-07
CR Vs FRR 0.0004 0.0009 8.78e-08 0.0002 0.019 7.8e-10 6.2e-10 1.2e-09 1.8e-08
FRL Vs FRR
In all the time windows, CR was found significantly
different from both the frontal regions and the left
central and centro-parietal ones. Specifically, CR
showed a weaker ERD (Table 2). Similarly, to the AO
case, exploring the effect of the time in each B-ROI,
f0 was different from all the other time windows
suggesting an effect of the video presentation (p<
0.0001). Moreover, in CL and CPL a partial
resynchronization was observed in f3 and f4 with
respect to f2 (p<0.05).
For the MI case, we further explored the effect of
the video type focusing on each window from f1 to f4
in which the video was presented. In f1, W1 showed
the less strong ERD (p < 0.001), in f2 no differences
were significant, in f3 W1 showed an overall re-
synchronization, while W3 induced a more persistent
ERD (p<0.001).
3.2 Beta Band Modulations
Figure 3 shows for each time window and video type,
the mean and standard error values of both action
observation and motor imagery ERD.
The ANOVA test identified a significant main
effect for the factor Task (F(1,41)= 14.7, p=0.0004),
B-ROIs (F(3.44,141)=25.22, p= 2.5e-14) and Time
(F(2.02,82.9)= 58.3, p= 1.24e-16).
A significant Task*B-ROI*Time interaction was
detected (F(9.8, 402.34)= 2.21, p=0.017), and the
following two-factors interactions: Task*B-ROI
(F(3.44,141.2)=3.23, p=0.019), B-ROI*Time
(F(6.78,278)=11.1, p=4.33e-12), Task*Time
(F(3.1,125.4)=3.6, p=0.015). Nor the main effect
neither the interactions including the video Type
factor were found significant.
Splitting by brain regions, significant interaction
between task and time were found in three regions,
namely CL (F(3.7,460.7)=6.24, p=0.0001),
CPL(F(3.4,421.8)=8.1, p=1.17e-05) and
CPR(F(3.3,411.9)=2.8 , p=0.036), as for the mu band.
In these regions, the task effect was significant in
each window indicating a stronger ERD for the AO
task as reported on (Table 3).
Splitting the ANOVA by tasks, we found for the
AO a significant interaction B-ROI*Time (F(6.03,
253.34)=6.3, p = 3.33e-06). Splitting the again by
time, in every time window a significant effect of the
ROI was found (Table 4). The post-hoc analysis with
Bonferroni's correction showed a stronger mu ERD in
the left centro-parietal (CPL) ROI with respect to all
the other ROIs in each time window during video
observation and only with respect to CR and FRR
in f0.
Table 3: P-values of the significant differences between
task type (AO vs MI) in each B-ROIs and window of the
Beta ERD.
ROI f0 f1 f2 f3 f4
CL 4.9e-06 9.7e-05 0.004 0.026
CPL
1.5e-07 0.0002 0.006 0.043
CPR 0.008 2.97e-06 0.0001 0.0002 4.8e-05
CR 0.024 0.0001 0.003 0.04
FRL
0.002 0.024 0.037
FRR
0.0008 0.035
BIOSIGNALS 2023 - 16th International Conference on Bio-inspired Systems and Signal Processing
90
Figure 3: Mean and standard error of the mean (SEM) of beta band %ERD values for the five windows of interest (-1s to +4
s) of both AO and MI tasks in each analyzed region of the scalp. Colours represent different video types. CL: central left,
CPL: centro-parietal left, CPR: centro parietal right, CR: central right, FL: frontal left and FR: frontal right.
The left central ROI showed a significantly
stronger ERD in each window with respect to the CR
from f1 to f4, supporting the lateralization of the mu-
rhythm modulation. The two frontal areas were never
different. Investigating the time effect in each B-ROI
we found that in each region, f0 was different from all
the other time windows suggesting a strong effect of
the video presentation (p<0.0001). The windows f1 to
f4 were not different in all the B-ROI except for CPL,
where f3 and f4 showed a significant re-
synchronization with respect to f1 and f2 (p<0.05).
Concerning the MI, we found a significant B-
ROI*Time interaction (F(9.89, 405.3)=3.3, p=0.0004).
In every time window a significant effect of the ROI
was found. The post-hoc analysis with Bonferroni's
correction showed a stronger beta ERD in the left
central (CL) and left centro-parietal (CPL) ROI with
respect to all the other ROIs in each time window
during the MI task. CR and CPR were found
significantly different from both CL and CPL also
during the red-circle pre-task period (f0).
Similarly, to the AO case, exploring the effect of
the time in each B-ROI, f0 was different from all the
other time windows suggesting an effect of the MI task.
4 DISCUSSION AND
CONCLUSIONS
The aim of this work was to compare the dynamical
cortical activation patterns observed during AO and MI
tasks in a group of healthy young volunteers. As a
measure of sensorimotor response to the presented
stimulations, we computed the ERD time course in
both individual mu and standard beta frequency ranges.
To increase the stimulation effect, the video-clips
used in the experiment comprised complex upper
limb object-directed (transitive) movements
performed from the observer’s perspective (Angelini
et al., 2018; Coll et al., 2017). For the MI task, the
same movements were asked to be imagined and a
frame of the video was shown to facilitate the
imagination. In all the explored brain regions, a
stronger mu ERD was elicited by the observation,
rather than the imagination of the movement, in line
with previous study by Gonzalez-Rosa et al., 2015.
Even so, the activation patterns were similar, with an
evident lateralization over the contralateral brain
areas and, in particular, a stronger engagement of the
CPL region, which can be associated to the
somatosensory cortex.
This latter results is in line with the hypothesis
that both AO and MI brain response may be more
correctly related to the sensory integration rather than
to the actual motor execution functions (Coll et al.,
2017). Since sensorimotor mu and beta oscillations
are not completely independent (Tacchino et al.,
2020), the modulation of the beta power followed the
same trend of significance detected in the mu band.
In this direction, further investigation at the source
level would provide a more precise distinction
between the two Rolandic oscillations.
Event-Related Desynchronization Analysis During Action Observation and Motor Imagery of Transitive Movements
91

Table 4: Corrected p-values of the significant differences among B-ROIs in each task and windows of the beta ERD. CL:
central left, CPL: centro-parietal left, CPR: centro parietal right, CR: central right, FL: frontal left and FR: frontal right.
AO MI
f0 f1 f2 f3 f4 f0 f1 f2 f3 f4
CL Vs CPL
3.1e-12 5.6e-09 5.1e-07 2.3e-08 1.8e-07 2.3e-07 5.6e-09 1e-06
CL Vs CPR
0.03 0.026 0.023 0.002 3.7e-05 0.001
CL Vs CR
5.3e-09 4.0e-08 1.5e-08 0.002 0.0009 6.1e-07 7.5e-06 0.0006 0.031
CL Vs FRL
CL Vs FRR
0.006 0.002 0.028 0.047
CPL Vs CPR
1.8e-10 5.7e-08 1.6e-08 4.4e-05 0.0008 1.0e-09 4.5e-11 7.6e-14 1.7e-10
CPL Vs CR
0.002 2.3e-23 9.8e-18 6.3e-17 1.5e-11 9.1e-05 5.0e-15 1.8e-13 1.0e-14 1.0e-10
CPL Vs FRL
4.8e-12 7.1e-10 2.1e-06 2.7e-06 1.9e-06 8.4e-06 6.2e-07 7.6e-05
CPL Vs FRR
0.002 1.2e-15 4.9e-14 2.7e-11 1.2e-10 0.014 7.5e-10 1.16e-10 3.8e-07 1.5e-06
CPR Vs CR
CPR Vs FRL
0.003 9.0e-06 0.001
CPR Vs FRR
CR Vs FRL
0.002 0.0004 0.001 0.0007 0.002 0.006
CR Vs FRR
FRL Vs FRR
Overall, the increasing complexity of the
movement was not a significant factor, even if some
actions seem to be more difficult to imagine than
others. Interestingly, the small influence of the video
type, present for the mu rhythm modulation, was
absent for the beta band, where the ERD pattern was
more consistent across video type and cortical
regions.
In conclusion, current results support the
potentiality of an action observation approach for
stimulating the sensorimotor system with a less
reliance on the subject’s imaginative abilities,
essential for achieving good results in motor imagery
protocols. Nevertheless, further studies are needed to
test the efficacy of an AO intervention alone on motor
skills learning and its effect on brain rhythm
modulation patterns.
ACKNOWLEDGEMENTS
The authors would like to thank students Costanza
Neve, Elisa Morganti, Riccardo Matarazzo e
Francesco Latino for their help in data pre-
processing.
REFERENCES
Angelini, M., Fabbri-Destro, M., Lopomo, N.F., Gobbo,
M., Rizzolatti, G., Avanzini, P., 2018. Perspective-
dependent reactivity of sensorimotor mu rhythm in
alpha and beta ranges during action observation: an
EEG study. Sci. Rep. 8, 1–11. https://doi.org/
10.1038/s41598-018-30912-w
Avanzini, P., Fabbri-Destro, M., Dalla Volta, R., Daprati,
E., Rizzolatti, G., Cantalupo, G., 2012. The dynamics
of sensorimotor cortical oscillations during the
observation of hand movements: An EEG study. PLoS
One 7, 1–10. https://doi.org/10.1371/journal.
pone.0037534
Calcagno, A., Coelli, S., Temporiti, F., Mandaresu, S.,
Gatti, R., Galli, M., Bianchi, A.M., 2022. Action
Observation Therapy Before Sleep Hours: An EEG
Study. Annu. Int. Conf. IEEE Eng. Med. Biol. Soc.
IEEE Eng. Med. Biol. Soc. Annu. Int. Conf. z2022,
4809–4812. https://doi.org/10.1109/EMBC48229.
2022.9871733
Cassani, C.M., Coelli, S., Calcagno, A., Temporiti, F.,
Mandaresu, S., Gatti, R., Galli, M., Bianchi, A.M.,
2022. Selecting a pre-processing pipeline for the
analysis of EEG event-related rhythms modulation.
Annu. Int. Conf. IEEE Eng. Med. Biol. Soc. IEEE Eng.
Med. Biol. Soc. Annu. Int. Conf. 2022, 4044–4047.
https://doi.org/10.1109/EMBC48229.2022.9871394
Coll, M.-P., Press, C., Hobson, H., Catmur, C., Bird, G.,
2017. Crossmodal Classification of Mu Rhythm
Activity during Action Observation and Execution
Suggests Specificity to Somatosensory Features of
Actions. J. Neurosci. 37, 5936–5947. https://doi.org/
10.1523/JNEUROSCI.3393-16.2017
Daeglau, M., Zich, C., Welzel, J., Saak, S.K., Scheffels,
J.F., Kranczioch, C., 2021. Event-related
desynchronization in motor imagery with EEG
neurofeedback in the context of declarative interference
and sleep. Neuroimage: Reports 1, 100058.
https://doi.org/10.1016/j.ynirp.2021.100058
BIOSIGNALS 2023 - 16th International Conference on Bio-inspired Systems and Signal Processing
92

Drew, A.R., Quandt, L.C., Marshall, P.J., 2015. Visual
influences on sensorimotor EEG responses during
observation of hand actions. Brain Res. 1597, 119–128.
https://doi.org/10.1016/j.brainres.2014.11.048
Gonzalez-Rosa, J.J., Natali, F., Tettamanti, A., Cursi, M.,
Velikova, S., Comi, G., Gatti, R., Leocani, L., 2015.
Action observation and motor imagery in performance
of complex movements: Evidence from EEG and
kinematics analysis. Behav. Brain Res. 281, 290–300.
https://doi.org/10.1016/j.bbr.2014.12.016
Kemmerer, D., 2021. What modulates the Mirror Neuron
System during action observation?: Multiple factors
involving the action, the actor, the observer, the
relationship between actor and observer, and the
context. Prog. Neurobiol. 205, 102128. https://
doi.org/10.1016/j.pneurobio.2021.102128
Neuper, C., Scherer, R., Reiner, M., Pfurtscheller, G., 2005.
Imagery of motor actions: Differential effects of
kinesthetic and visual–motor mode of imagery in
single-trial EEG. Cogn. Brain Res. 25, 668–677.
https://doi.org/10.1016/j.cogbrainres.2005.08.014
Pion-Tonachini, L., Kreutz-Delgado, K., Makeig, S., 2019.
ICLabel: An automated electroencephalographic
independent component classifier, dataset, and website.
Neuroimage 198, 181–197. https://doi.org/10.1016/j.
neuroimage.2019.05.026
Rizzolatti, G., Fabbri-Destro, M., Nuara, A., Gatti, R.,
Avanzini, P., 2021. The role of mirror mechanism in the
recovery, maintenance, and acquisition of motor
abilities. Neurosci. Biobehav. Rev. 127, 404–423.
https://doi.org/10.1016/j.neubiorev.2021.04.024
Rizzolatti, G., Sinigaglia, C., 2010. The functional role of
the parieto-frontal mirror circuit: interpretations and
misinterpretations. Nat. Rev. Neurosci. 11, 264–274.
https://doi.org/10.1038/nrn2805
Tacchino, G., Coelli, S., Reali, P., Galli, M., Bianchi, A.M.,
2020. Bicoherence Interpretation in EEG Requires
Signal to Noise Ratio Quantification: An Application to
Sensorimotor Rhythms. IEEE Trans. Biomed. Eng. 67.
https://doi.org/10.1109/TBME.2020.2969278
Tacchino, G., Gandolla, M., Coelli, S., Barbieri, R.,
Pedrocchi, A., Bianchi, A.M., 2017. EEG Analysis
during Active and Assisted Repetitive Movements:
Evidence for Differences in Neural Engagement. IEEE
Trans. Neural Syst. Rehabil. Eng. 25.
https://doi.org/10.1109/TNSRE.2016.2597157
Temporiti, F., Adamo, P., Cavalli, E., Gatti, R., 2020.
Efficacy and Characteristics of the Stimuli of Action
Observation Therapy in Subjects With Parkinson’s
Disease: A Systematic Review. Front. Neurol. 11.
https://doi.org/10.3389/fneur.2020.00808.
Event-Related Desynchronization Analysis During Action Observation and Motor Imagery of Transitive Movements
93
