
Studying the Impact of Transportation During Lockdown on the Spread
of COVID-19 Using Agent-Based Modeling
Shikha Bhat
∗ a
, Ruturaj Godse
∗ b
, Shruti Mestry
c
and Vinayak Naik
d
BITS Pilani, Goa, India
Keywords:
Agent-Based Simulation, COVID-19, Artificial Intelligence.
Abstract:
The COVID-19 pandemic has posed challenges for governments concerning lockdown policies and trans-
portation plans. The exponential rise in infections has highlighted the importance of managing restrictions on
travel. Previous research around this topic has not been able to scale and address this issue for India, given
its diversity in transportation networks and population across different states. In this study, we analyze the
patterns of the spread of infection, recovery, and death specifically for the state of Goa, India, for twenty-eight
days. Using agent-based simulations, we explore how individuals interact and spread the disease when travel-
ing by trains, flights, and buses in two significant settings - unrestricted and restricted local movements. Our
findings indicate that trains cause the highest spread of infection within the state, followed by flights and then
buses. Contrary to what may be assumed, we find that the effect of combinations of all modes of transport is
not additive. With multiple modes of transport activities, the cases rise exponentially faster. We present equiv-
alence points for the number of vehicles running per day in unrestricted and restricted movement settings, e.g.,
one train a day in unrestricted movement spreads the disease as eight trains a day in restricted movement.
1 INTRODUCTION
In recent years, the world has faced innumerable chal-
lenges posed by the Severe Acute Respiratory Syn-
drome CoronaVirus 2 (SARS-CoV-2), also known as
COVID-19. The disease spreads from one infected
individual to another through respiratory droplets and
physical contact. Due to a lack of awareness, re-
search, and interventions during the initial outbreak,
the virus rapidly spread to over a hundred countries
within three months, compelling the WHO to declare
a global pandemic on March 11, 2020.
To prevent a similar disease from spreading in this
fashion, we urgently need to study the disease spread
using epidemiological modeling techniques. Mathe-
matical models involve constant values that determine
only one outcome. In contrast, computer simulations
that consist of agent-based models are stochastic and
have a better chance of mimicking reality. An agent-
based model involves agents as autonomous entities
a
https://orcid.org/0000-0002-3989-2005
b
https://orcid.org/0000-0002-1091-4311
c
https://orcid.org/0000-0001-9672-1635
d
https://orcid.org/0000-0003-3637-2167
*
These authors contributed equally to this work.
and an environment in which the agents interact with
each other to portray any real-life system.
India was one of the most affected countries in the
world. Goa, a state in India, had a test positivity rate
of five times the national average. This paper presents
an agent-based simulation created in NetLogo soft-
ware (net, 1999) that helps us design an epidemio-
logical model incorporating spatial data of population
and transportation. Using the model, we estimate the
spread of COVID-19 in Goa through railway, road,
and airway transportation networks. The agents are
simulated as individuals interacting with each other as
they travel via the transportation networks and unfold
the spread of the infection with time. We simulate
the transportation networks with varying frequency,
introduce restrictions on local movements, and mea-
sure the rise in the population’s number of infections
and recoveries., Using the simulation, we get an in-
sight into specific details, such as an upper bound on
vehicles required to minimize the disease spread, the
rate of change of infections, and the impact of the
restriction on movement, i.e., lockdown. The model
will help the general public perceive the best-case to
worst-case scenarios under different degrees of move-
ment. Our study will help policymakers to propose
effective strategies to minimize the disease’s spread.
80
Bhat, S., Godse, R., Mestry, S. and Naik, V.
Studying the Impact of Transportation During Lockdown on the Spread of COVID-19 Using Agent-Based Modeling.
DOI: 10.5220/0011733400003393
In Proceedings of the 15th International Conference on Agents and Artificial Intelligence (ICAART 2023) - Volume 1, pages 80-92
ISBN: 978-989-758-623-1; ISSN: 2184-433X
Copyright
c
2023 by SCITEPRESS – Science and Technology Publications, Lda. Under CC license (CC BY-NC-ND 4.0)

We validate the model by comparing it with real-
world data.
In the following sections, we describe past re-
search efforts to create pandemic models, clearly
lay out the problem statements we address, and the
methodology we use to approach the problem. Later
sections discuss the details of our implementation of
the methods, and we then present the results obtained
from the simulation model. The conclusion summa-
rizes the paper and discusses ways the presented work
can be extended further.
2 RELATED WORK
The COVID-19 global pandemic has urged re-
searchers to study the infection spread to imple-
ment appropriate lockdown policies and other non-
pharmaceutical interventions. Modeling the pan-
demic in a simulation, analyzing how the infection
spreads among people, and watching the patterns
emerge are effective ways to study the pandemic. Pre-
vious works can broadly be classified into determin-
istic and stochastic modeling. Our study uses agent-
based modeling, which is a sub-category of stochastic
modeling. These methods are detailed as follows.
2.1 Deterministic Modeling
Deterministic modeling attempts to study some part
(or form) of a real-life problem in mathematical
terms. Previously, there have been many studies
that mathematically model the COVID-19 outbreak.
These models are deterministic, ranging from simple
math (Tang and Wang, 2020) to nonlinear differential
equations (Iboi et al., 2020) to fractional order math-
ematical modeling (Ahmad et al., 2020). Determin-
istic epidemic models, such as the Susceptible, Ex-
posed, Infected, and Recovered (SEIR) model (Car-
cione et al., 2020)(Reiner et al., 2021), are useful tools
in epidemiology. However, despite the many advan-
tages of deterministic models, it can be difficult to in-
clude realistic population networks in such models.
Thus, we usually use the SEIR techniques in com-
bination with some stochastic parameters to create a
better model of the real situation (Omar et al., 2021).
2.2 Stochastic Modeling
Purely mathematical modeling of a complex situation,
such as a pandemic, often cannot accurately represent
a real-world scenario. In the past, there have been ef-
forts to produce stochastic processes to quantitatively
reproduce the spread of a pandemic and the number
of infections.
Mainly three types of stochastic epidemic simula-
tions have been explored. The first builds on mathe-
matical ODE deterministic models by using stochas-
tic differential equations (Zhang et al., 2020). The
second method is the Markov Chain Monte Carlo
method, where the probability of each possible event
is assessed at each time step, and one of the events is
chosen randomly (weighted by its probability of oc-
currence) (Chatterjee et al., 2020). Using a Monte
Carlo simulation model, Bartsch et al. (Bartsch et al.,
2022) compared what would happen if face masks
were used versus not used until the population gets
their final vaccination. The third and final approach
is agent-based models with stochastic parameters, in
which each agent behaves in certain ways to under-
stand the underlying movements and interactions be-
tween individuals. Wilder et al. (Wilder et al., 2020)
developed a stochastic SEIR agent-based model for
the spread of SARS-CoV2 and discusses the role of
age distribution and family structure in the model.
Our study uses agent-based modeling to understand
the spread of the disease among locals and passengers
traveling via different transportation methods.
Other aspects of our paper include the geospatial
representation of a state, restrictions on local move-
ment, and the effect of transportation networks on the
disease spread. Previously, Koo et al. (Koo et al.,
2022) created an agent-based model, GeoDEMOS-R,
incorporating a geographical, demographic, and epi-
demiological model of Singapore for respiratory dis-
eases. We simulate time-specific restrictions on the
movement in the lockdown scenario. We use QGIS
and NetLogo to simulate a geospatial environment of
Goa.
The research on the spread of COVID-19 through
transportation networks in India, while comparing the
restrictions on local movement, is limited. Talekar et
al. (Talekar et al., 2020) implemented cohort strate-
gies on top of a city-scale agent-based epidemic sim-
ulator. They mapped the agents on a geospatial net-
work and studied the effect of grouping agents to-
gether in travel in Mumbai railways. Our simulation-
based model treats each agent as an autonomous indi-
vidual living in restricted and unrestricted lockdown
scenarios. In our study, we model trains, flights, and
buses separately and find that they differ greatly in
terms of infection spread. Compared to their study of
the effect of creating cohorts on the spread via only
train, our study is broader. We focus on how we can
better the transportation and lockdown policies in a
state, using the information collected via the agent-
based simulation.
Studying the Impact of Transportation During Lockdown on the Spread of COVID-19 Using Agent-Based Modeling
81

3 PROBLEM STATEMENTS
In favor of allowing socio-economic activities, it is
essential to understand how the infection spreads via
the transport networks in the state. This will help in
planning efficient rules and regulations in lockdown
and provide insight into predicting the future of the
outbreaks. To that end, the aims of the simulation
study are as follows.
1. Measure the cumulative number of infections
while varying the frequency of each mode of
transport
2. Measure the total number of recoveries while
varying the frequency of each mode of transport
3. Find an upper bound on the number of transport
vehicles allowed to run while keeping the maxi-
mum number of infections less than 20%
4. Measure the rate of change, as calculated in the
following equation, in the number of infections
for the initial days of the disease spread vis-
`
a-vis
the final days
(b − a)
a
∗ 100 (1)
where a is the number of infected or recovered or
deceased people for a day, and b is the number of
infected or recovered or deceased people for the
following day
5. Compare different frequencies of transportation
during two scenarios of movements, which pro-
duce an equivalent number of infections within
twenty-eight days
6. Validate the model by comparing and correlating
it with real-world data
4 METHODOLOGY AND
IMPLEMENTATION
We describe our methodology and give details of im-
plementing our agent-based model using the data in
this section.
4.1 GIS Data Collection
Goa is connected to the other states of India by rail-
ways, airways, and roadways. We collect datasets
for these transportation networks in Goa from Open-
StreetMap using QGIS software (QGIS Development
Team, 2021) and generate desired shapefiles for the
model. These files contain vector point data for nine
railway stations along the Konkan railway route, one
Airport
Bus check post
Railway station
Railway Tracks
Roads
Legend
Figure 1: A map showing the railway stations, bus check-
posts, airport and transportation networks inside Goa.
airport at Dabolim, and four border-crossing points
on the national highways. We show the locations of
stops for all three modes in Figure 1.
We gather the rail, road, and air-related data (tra,
2022) to set up variable values such as the maxi-
mum number of trains or the number of passengers
onboard. The rail-related data includes trains’ num-
bers, routes, timings, and frequency. The airway-
related data consists of all the airlines operating in
Goa, with the timings and frequency of flights. The
road-related data comprises the number of buses run-
ning from Goa to Maharashtra and Goa to Karnataka
via different entry points. We use the vector poly-
gon datasets for administrative boundaries to ensure
the agents move within the representative GIS space.
The data for COVID-19 statistics and the nationwide
lockdown policy timeline help us calibrate and vali-
date our model at the end.
4.2 Agent-Based Model
We elaborate on the three main simulation model
components - the agents, the environment in which
the agents live and travel, and the interaction between
the agents that result in disease transmission.
4.2.1 Agents
To simulate the COVID-19 disease’s spread among
humans, we create agents representing the human
population of Goa in the GIS space. We use a scaled-
down population of Goa to create the total number of
agents in each district of Goa. The people in the dis-
tricts can move around, get in and out of the trains,
flights, or buses, get exposed to the disease, and in-
fect other people. We define the people currently in
the state as a class of persons and those traveling via
train, flight, or bus as a class of passengers. The ’per-
ICAART 2023 - 15th International Conference on Agents and Artificial Intelligence
82

sons’ own a district variable that allows us to track
the district they belong to, and the ’passengers’ own
a vehicle variable, such as flight or train number. The
passenger’s location changes with the vehicle’s loca-
tion.
4.2.2 Environment
This study focuses on creating an environment mim-
icking Goa’s transportation network via rail, road, and
air. We insert the vector datasets for administrative
boundaries, railway stations, airports, and highway
checkpoints to achieve that. The state boundaries
are loaded to ensure the confinement of agents within
the GIS space. We define trains that use the Konkan
Railway route running through Goa from Pernem sta-
tion in the North Goa district to Loliem station in the
South Goa district. Dabolim airport denotes the loca-
tion for flights to arrive and depart. Highway check
posts are the entry points at the Goa border to facili-
tate bus travel. We use the projected coordinate sys-
tem EPSG:7779 for the state of Goa.
4.2.3 Interaction
Our model employs the “SEIRD” framework model,
distinguished as Susceptible - Exposed - Infected -
Recovered - Deceased, demonstrating the disease pro-
gression in individual agents. Among all the different
types of epidemic modeling, the SEIRD framework
is the most extensive, keeping track of every stage.
We allow individuals to travel, and while they move,
they come in contact with each. Their interaction un-
folds the disease transmission. Each individual is as-
signed a variable that tracks her state of disease pro-
gression in terms of S-E-I-R-D. At the start of the sim-
ulation, some individuals are infected, and others are
all susceptible to the disease. As the individuals move
around and come in contact with others, they are ex-
posed to the disease, and after some time, given some
infection chances, they are infected with the disease.
After a recovery period, the infected individuals either
recover or continue to remain infected, depending on
the recovery chances. At this point, the chances of
death are also checked. If the infected individuals die,
they are removed from the simulation.
4.3 Implementation
We simulate all three modes of transport – trains,
flights, and buses, individually and in combination.
For each mode, we initialize the vehicles to their start-
ing locations and let people in the district become
passengers that board these vehicles. We update the
vehicle’s and passenger’s positions every hour and
Initialise vehicle to its starting location
Start
Let some people in the district board the vehicle
Let the passengers in the vehicle interact with each
other according to the S-E-I-R-D model
Yes
Reached the last stop?
End
Move to next station
Update the position of the vehicle and the passengers
travelling in it
Let some passengers alight the vehicle
No
Figure 2: Flowchart for the simulation of one vehicle. Mul-
tiple such vehicles run in parallel, with different stations and
start times.
let the passengers interact with each other using the
SEIRD model. New passengers board the vehicle,
and the old passengers alight the vehicle at different
stations/ports. Then, the people who alight at these
stations travel home. The flowchart explaining the
simulation course for a vehicle is shown in Figure 2.
We run multiple such vehicles simultaneously from
different stations and at different times, following the
transportation data obtained.
People outside the vehicles randomly mingle in
their districts and interact, spreading infection within
a specified radius. We build the simulations repre-
senting the movement of people in two ways. In the
first scenario with unrestricted movement, we allow
the individuals to move within the state and utilize the
transportation networks for inter-state travel. The sec-
ond scenario with restricted movement allows inter-
state travel but restricts local movement. These are the
two movements allowed in India during the COVID-
19 period. We only monitor people in the state and
remove those traveling out of the state, via flights and
buses, from our simulation.
Platform. We select the NetLogo software as our
modeling platform for its diverse characteristics and
Studying the Impact of Transportation During Lockdown on the Spread of COVID-19 Using Agent-Based Modeling
83
tools. The GIS extension provided by NetLogo en-
ables the model to accommodate vector as well as
raster GIS data. It an object-oriented agent-based
model, where each agent is an object. The moni-
tors, GIS space, and plots update at every tick, and
the results are tracked. A tick corresponds to an
hour in our simulation. We execute the model with-
out using GUI on a Red Hat Linux server. Behav-
iorSpace, an inbuilt tool in NetLogo, allows us to
execute multiple simulations in parallel by use of
threading. The BehaviorSpace-based simulation of
our model is called through the command line using a
NetLogo-headless batch file which executes each sim-
ulation for a different set of parameters, and the output
is exported as CSV files. We average the results over
three runs of the experiments and then plot graphs us-
ing MATLAB.
Input Parameters. To study each transport network’s
effect on the spread of the disease, we simulate the
model separately for railways, airways, and road-
ways, and then for all of the transport networks com-
bined. The numbers of vehicles and passengers are
extracted from real-world data. We downscale the
population of Goa to 1%, which results in 15, 000 in-
dividuals in the model. The number of people in each
vehicle is scaled down by a factor of 10. We simu-
late for twenty-eight days to capture the consequent
recoveries and fatalities. The parameters for the sim-
ulation, vehicles, and their respective values are given
in Table 1 and 2.
Table 1: Parameters for the agent-based simulation.
Parameter Value
Time period 28 days
Population 15,000
Chances of exposure 70%
Exposure radius 0.001 units (∼33.85 metres)
Incubation period 4 days
Illness period 10 days
Chances of infection 70%
Chances of recovery 80%
Chances of death 5%
5 RESULTS
We simulate agent-based models for trains, flights,
buses, and a combination of these modes. We con-
duct each simulation with different seed values three
times and average the results.
5.1 Cumulative Number of Infections
with Varying Frequency for
Transportation
5.1.1 Trains
0 25 50 75 100
% of trains per day
0
20
40
60
80
100
Cumulative % of infected people
Cumulative % of infected people with varying % of trains
Unrestricted Movement
Restricted Movement
89%
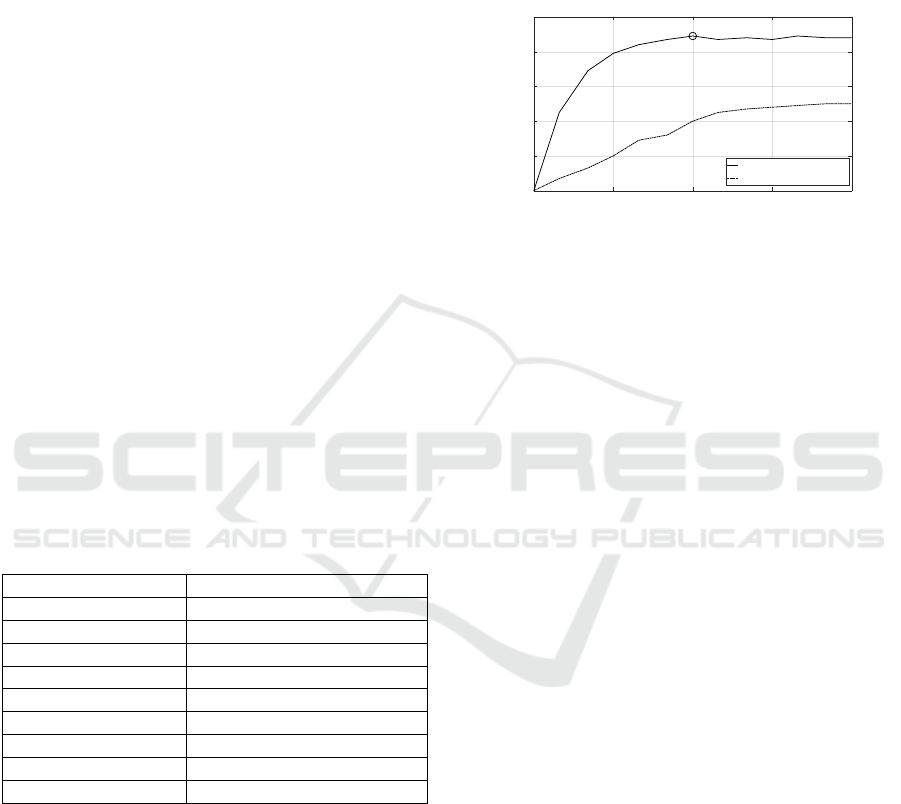
Figure 3: The cumulative percentage of infected people
with an increasing number of trains running per day for un-
restricted and restricted movements. The cumulative num-
ber increases until we reach a saturation point of 89% with
more than 50% trains per day in the case of unrestricted
movement.
Figure 3 shows that unrestricted movement results in
45% to 89% of the population contracting the disease,
with 8% to 50% of trains running daily, respectively.
On average, the cumulative number increases at 17%
with an increase in the percentage of trains until 25%
of the trains. This rate decreases to 3.3% from 25% to
50% of trains. With more than 50% of trains per day,
it produces nearly the same cumulative percentage of
infections in the range of 87% to 89%.
When the local movement is restricted, we ob-
serve that the cumulative number of infections is 7%
with 8% of trains and 50% with 100% of trains run-
ning daily. Until 50% of trains per day, there is an
average increase of 6.6%. The increase is 1.8% with
a further rise in the number of trains. The restrictions
with more than 50% of trains result in nearly half of
the population getting the disease. However, we ob-
serve that the restriction on the local movement with
100% of trains lowers the cumulative number to 38%
as compared to the unrestricted movement. To reduce
the cumulative number, the trains need to be operated
with restricted local movement.
5.1.2 Flights
Figure 4 shows that an increase in the percentage of
flights with unrestricted movement results in up to
63% of the population getting infected in twenty-eight
days. In contrast to the trains, the cumulative num-
ber of infections increases at 1% from 10% to 30%
of trains. The rate further increases to 8.2% for more
than 30% of flights.
ICAART 2023 - 15th International Conference on Agents and Artificial Intelligence
84
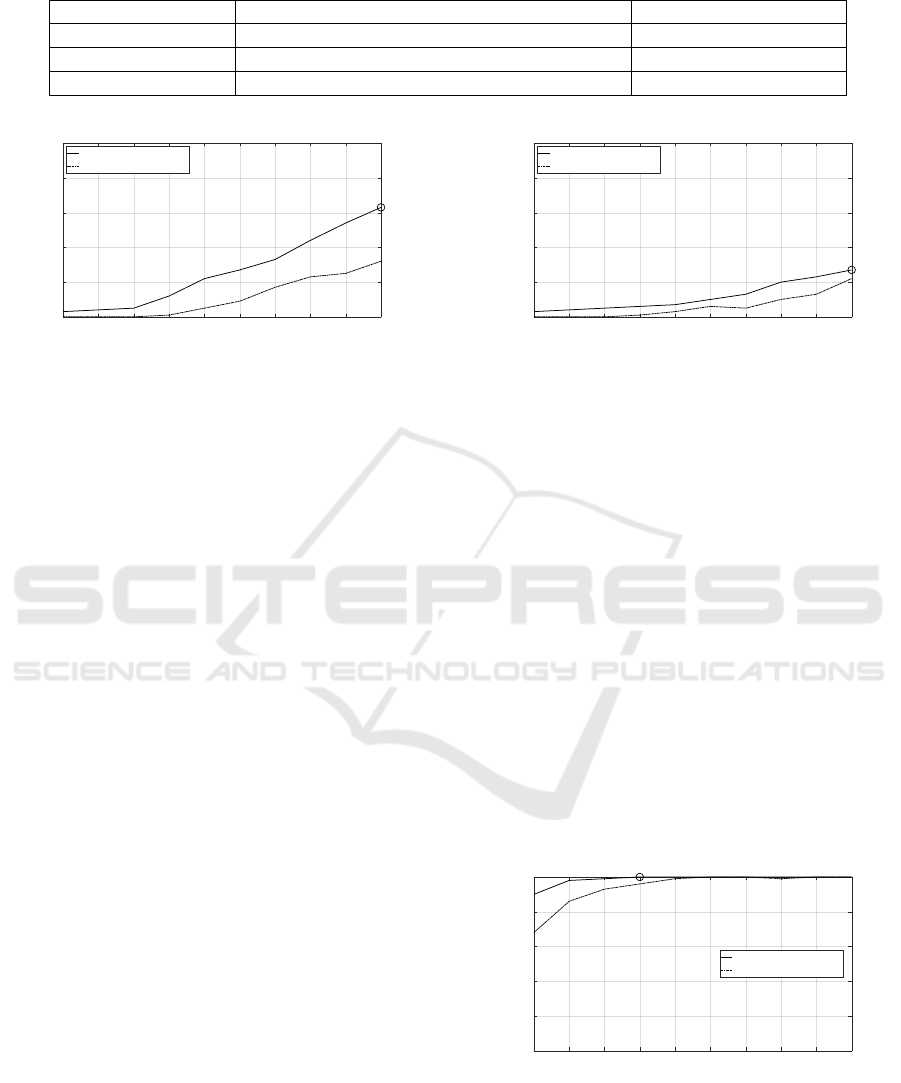
Table 2: Parameters for each mode of transport in the simulation.
Mode of Transport Number of Vehicles Number of Passengers
Trains [1, 2, 3, 4, 5, 6, 7, 8, 9, 10, 11, 12] 50
Flights [10, 20, 30, 40, 50, 60, 70, 80, 90, 100] 9
Buses [30, 60, 90, 120, 150, 180, 210, 240, 270, 300] 5
10 20 30 40 50 60 70 80 90 100
% of flights per day
0
20
40
60
80
100
Cumulative % of infected people
Cumulative % of infected people with varying % of flights
Unrestricted Movement
Restricted Movement
63%
Figure 4: The cumulative percentage of infected people
with an increasing number of flights flying per day for un-
restricted and restricted movements. In the case of unre-
stricted movement, the number of infections keeps rising
up to 63%.
In the case of restricted local movement with 10%
to 30% of flights, the cumulative percentage of in-
fected people remains less than 1%. We see that 1% of
the population gets the infection with 40% of flights.
With a further increase in flights to 100%, we observe
that 32% of the population contracts the infection.
On average, with more than 40% of flights per day,
the cumulative number increases at 5.1%. The differ-
ence in cumulative numbers between the unrestricted
and restricted movements rises with an increase in the
percentage of flights suggesting that, unlike trains, re-
strictions on local movement are benefiting even if the
percentage of flights is more than 50%.
5.1.3 Buses
In Figure 5, we observe that buses, among other trans-
port modes, result in the least number of cumulative
infections even. The unrestricted movement shows
3% to 27% of the population getting infected with
10% to 100% of buses, respectively. We see an in-
crease of 1% from 10% to 50% of buses. It increases
at 4% from 60% to 100% of buses.
Similar to the case of flights, the restricted local
movement with 10% to 30% of buses shows less than
1% of the infected population. The cumulative num-
ber for 40% to 90% of buses increases at 2.6%. After
90%, the rate is 9%. As the cumulative % with un-
restricted movement is 27%, it is unsafe to operate
buses with full frequency without local restrictions.
10 20 30 40 50 60 70 80 90 100
% of buses per day
0
20
40
60
80
100
Cumulative % of infected people
Cumulative % of infected people with varying % of buses
Unrestricted Movement
Restricted Movement
27%
Figure 5: The cumulative percentage of infected people
with an increasing number of buses running per day for un-
restricted and restricted movements. The number of infec-
tions keeps rising to 27% for the case of unrestricted move-
ment.
5.1.4 Combination
The combination of all transport modes shows the
worst scenario regarding the infected population. In
Figure 6, we observe that the unrestricted movement
results in 90% of the population getting infected with
10% of vehicles and the whole population with 40%
of vehicles.
With restrictions on local movement, we see that
68% of the population gets infected with 10% of ve-
hicles. The restriction in local movement lowers the
cumulative percentage but is not significant enough to
contain the infection. The whole population contracts
the disease when more than 50% of vehicles operate.
This suggests that operating the transport network si-
multaneously transmits the infection the most.
10 20 30 40 50 60 70 80 90 100
% of vehicles per day
0
20
40
60
80
100
Cumulative % of infected people
Cumulative % of infected people with varying % of vehicles
Unrestricted Movement
Restricted Movement
100%
Figure 6: The cumulative percentage of infected people
with an increasing number of vehicles running per day for
unrestricted and restricted movements. In the case of unre-
stricted movement, The number of infections reaches 100%
with more than 40% of vehicles.
Studying the Impact of Transportation During Lockdown on the Spread of COVID-19 Using Agent-Based Modeling
85
5.2 Number of Recoveries with Varying
Frequency of Transportation
5.2.1 Trains
0 25 50 75 100
% of trains per day
0
5
10
15
20
25
30
% of recovered people
Maximum % of recovered people with varying % of trains
Unrestricted Movement
Restricted Movement
13%
18%
23%
9%
8%
1%
Figure 7: The maximum number of recoveries with increas-
ing trains running per day for unrestricted and restricted
movements scenarios. The percentage of the population re-
covering each day increases until 50% trains per day, after
which it remains nearly constant.
The maximum number of recovered people observed
within twenty-eight days is 23% of the total popula-
tion, with 50% trains, i.e., six trains running per day
in case of unrestricted movement as shown in Figure
7. The percentage of the population recovering each
day increases from 9% to 23% for unrestricted move-
ment and from 1% to 8% for restricted movement
as the number of trains increases up to 50% trains,
which is six trains per day. After that, it remains al-
most constant at 13% and at 18% for further increase
in the number of trains for restricted and unrestricted
movements, respectively. The number of recoveries
increases faster initially with an increase in trains and
later flattens. As the number of infected people in-
creases from 36% with one train to 71% with twelve
trains, as shown in Figure 11, we see an increase in
the number of recovered people from 9% to 18%, re-
spectively. It implies that the higher the frequency of
trains, the higher the number of infections in a short
period which, if people recover, leads to an increase
in the number of recoveries.
5.2.2 Flights
In Figure 8, we observe that the maximum number
of recovered people within twenty-eight days is 18%
of the total population, with 100% flights, i.e., a hun-
dred flights running per day, for unrestricted move-
ment. The number of recoveries increases steadily
with flights for unrestricted and restricted movements.
In the case of unrestricted movement, from 10% to
30% of flights, we see 1% of the population recover.
With 40% to 70% of flights, the rate rises from 2% to
6% of the population to recover. With more than 70%
of flights, the rate further rises from 11% to 18%. For
restricted movement, the number of recoveries ranges
from 1% to 12% for 10% to 100% of flights. From the
number of infections, we know that restricted move-
ment minimizes the infection from spreading, allow-
ing people to recover. This, in turn, buys time for
healthcare facilities to be ready.
10 20 30 40 50 60 70 80 90 100
% of flights per day
0
5
10
15
20
25
30
% of recovered people
Maximum % of recovered people with varying % of flights
Unrestricted Movement
Restricted Movement
18%
Figure 8: The maximum number of recoveries with an in-
creasing number of flights running per day for unrestricted
and restricted movements scenarios. The number of recov-
eries increases steadily with the number of flights.
5.2.3 Buses
10 20 30 40 50 60 70 80 90 100
% of buses per day
0
5
10
15
20
25
30
% of recovered people
Maximum % of recovered people with varying % of buses
Unrestricted Movement
Restricted Movement
1%
2%
4%
5%
Figure 9: The maximum number of recoveries with an in-
creasing number of buses running per day for unrestricted
and restricted movements. The number of recoveries re-
mains constant up to two hundred and ten buses per day,
after which it increases in the case of unrestricted move-
ment. The case of restricted movement produces almost the
same number of recoveries as that of unrestricted.
We observe the maximum number of recovered peo-
ple within twenty-eight days, as shown in Figure 9,
to be 5% of the total population, with 100% buses,
i.e., three hundred buses per day in case of unre-
stricted movement. The number of recoveries re-
mains constant at 1-2% for up to two hundred and
ten buses per day, after which it increases to 4%
for the case of unrestricted movement. With an in-
crease in the frequency of buses, the restricted move-
ment produces a similar number of recovered people
as the unrestricted movement. Thus, buses are the
most favorable transport mode in minimizing infec-
ICAART 2023 - 15th International Conference on Agents and Artificial Intelligence
86
tions even with 100% of frequency without restricting
local movement.
5.2.4 Combination
10 20 30 40 50 60 70 80 90 100
% of vehicles per day
0
20
40
60
80
100
% of recovered people
Maximum % of recovered people with varying % of vehicles
Unrestricted Movement
Restricted Movement
53%
97%
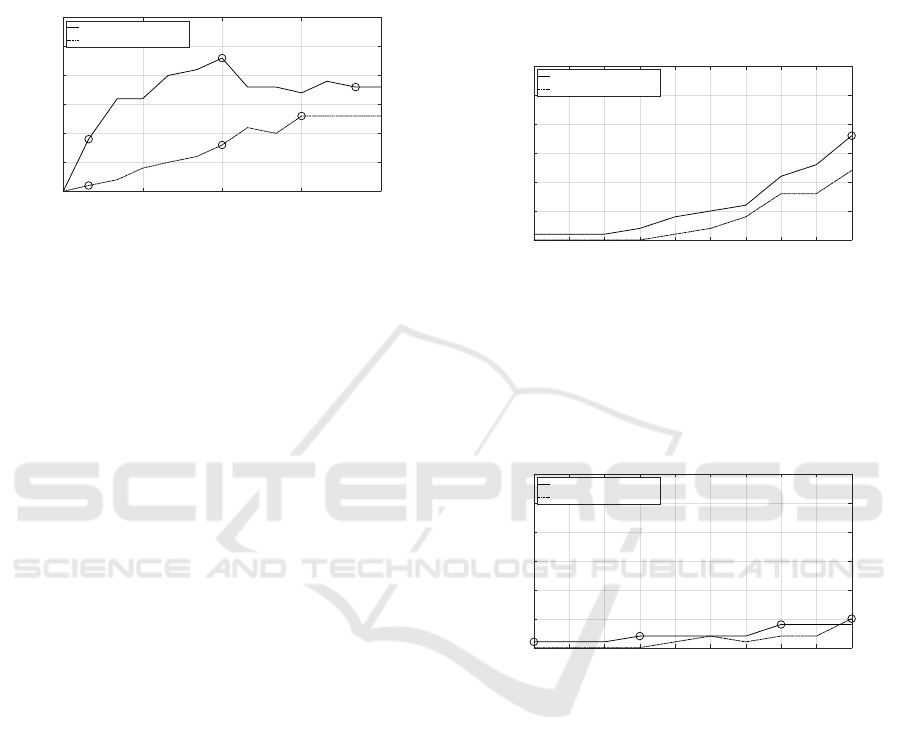
Figure 10: The maximum number of recoveries is 97% of
the total population. It is observed with eleven trains, ninety
flights, and two hundred and ten buses running per day for
unrestricted movement at 97% of the total population.
With 90% of total vehicles, i.e., eleven trains, ninety
flights, and two hundred and ten buses running per
day, for unrestricted movement, the maximum num-
ber of recovered people observed within twenty-eight
days is 97% of the total population as shown in Fig-
ure 10. The number of recoveries keeps increasing
from 53% to 97% as the frequency of each transport
mode increases and reaches the maximum. We ob-
serve that with an increase in the frequency of vehi-
cles, the numbers of recovered people for restricted
and unrestricted are nearly equal. Allowing all trans-
port modes to operate together leads to a rapid in-
crease in the spread of infection. Thus, a combination
of transport networks must be avoided regardless of
restrictions on the local movement.
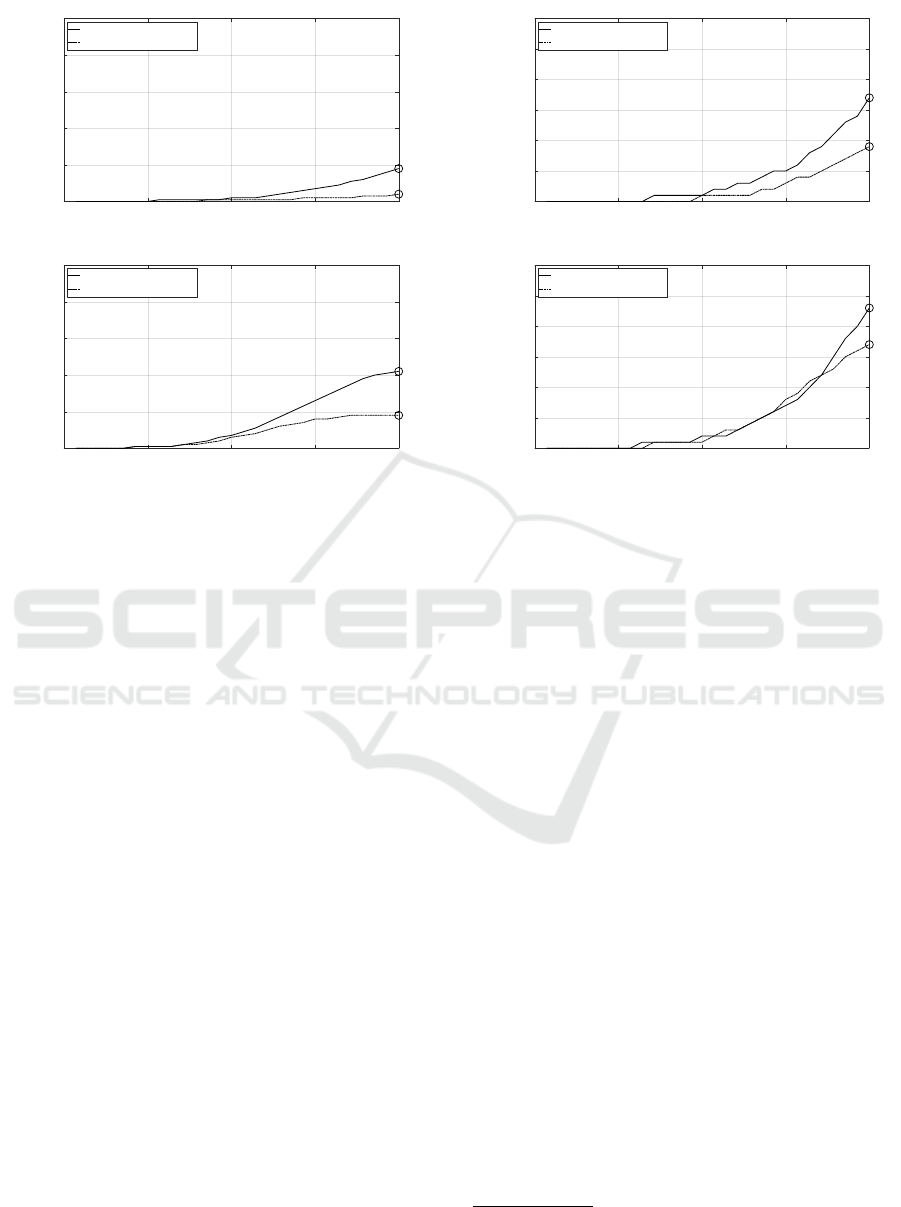
5.3 An Upper Bound On the Number of
Vehicles To Keep the Maximum
Number of Infections Less Than
20%
5.3.1 Trains
With 8% of trains, as shown in Figure 11, the maxi-
mum number of infections goes up to 36% in case of
unrestricted movement. Thus, we cannot allow trains
to run with unrestricted movement if we want to keep
the maximum number of cases less than 20%. In the
case of restricted movement, we can allow up to 25%
trains per day.
0 25 50 75 100
% of trains per day
0
20
40
60
80
100
% of infected people
Maximum % of infected people with varying % of trains
Unrestricted Movement
Restricted Movement
71%
36%
Figure 11: We show the maximum number of infected peo-
ple with an increasing number of trains running per day for
unrestricted and restricted movements. The number of in-
fections keeps rising until we reach a saturation point of
71% once we allow more than 75% trains per day.
5.3.2 Flights
In Figure 12, we see that the maximum number of in-
fections stays below 20% for up to 50% of flights per
day in case of unrestricted movement. In restricted
movement, the maximum number of infections re-
mains below 20% even for the maximum frequency
of flights.
10 20 30 40 50 60 70 80 90 100
% of flights per day
0
20
40
60
80
100
% of infected people
Maximum % of infected people with varying % of flights
Unrestricted Movement
Restricted Movement
42%
Figure 12: We show the maximum number of infected peo-
ple with an increasing number of flights running per day for
the scenarios of unrestricted and restricted movements. The
number of infections keeps rising for twenty-eight days, and
we see a considerable increase of ∼ 5% for cases each time
as we increase the number of flights per day by ten.
5.3.3 Buses
In the case of unrestricted movement, the number of
infections in Figure 13, stays below 20% till 90%
of buses per day. With the maximum frequency of
buses, the number of infections rises to 23%. In case
of restricted movement, the maximum number of in-
fections stays below 20% even for the maximum fre-
quency of buses.
5.3.4 Combination
With the combination of the least frequency for each
transportation mode, i.e., three trains, ten flights, and
Studying the Impact of Transportation During Lockdown on the Spread of COVID-19 Using Agent-Based Modeling
87
10 20 30 40 50 60 70 80 90 100
% of buses per day
0
20
40
60
80
100
% of infected people
Maximum % of infected people with varying % of buses
Unrestricted Movement
Restricted Movement
23%
Figure 13: We show the maximum number of infected peo-
ple with an increasing number of buses per day for both un-
restricted and restricted movement scenarios. The number
of infections keeps rising for twenty-eight days. With fewer
buses, the number of infections increases steadily (∼1%)
each time we increase the frequency by ∼10%, but as the
number of buses crosses ∼50% (150), we see a sharp in-
crease.
thirty buses, the minimum number of infections, as
shown in Figure 14, is 57% in case of unrestricted
movement and 40% in case of restricted movement.
Thus, we cannot allow a combination of transports if
we do not want the maximum number of cases to go
above 20%.
10 20 30 40 50 60 70 80 90 100
% of vehicles per day
0
20
40
60
80
100
% of infected people
Maximum % of infected people with varying % of vehicles
Unrestricted Movement
Restricted Movement
91%
Figure 14: We show the maximum number of infected peo-
ple with an increasing number of buses per day for both
unrestricted and restricted movement scenarios. We see the
maximum number of infections for twelve trains, hundred
flights, and three hundred buses running per day in unre-
stricted movement. It is 91% of the total population.
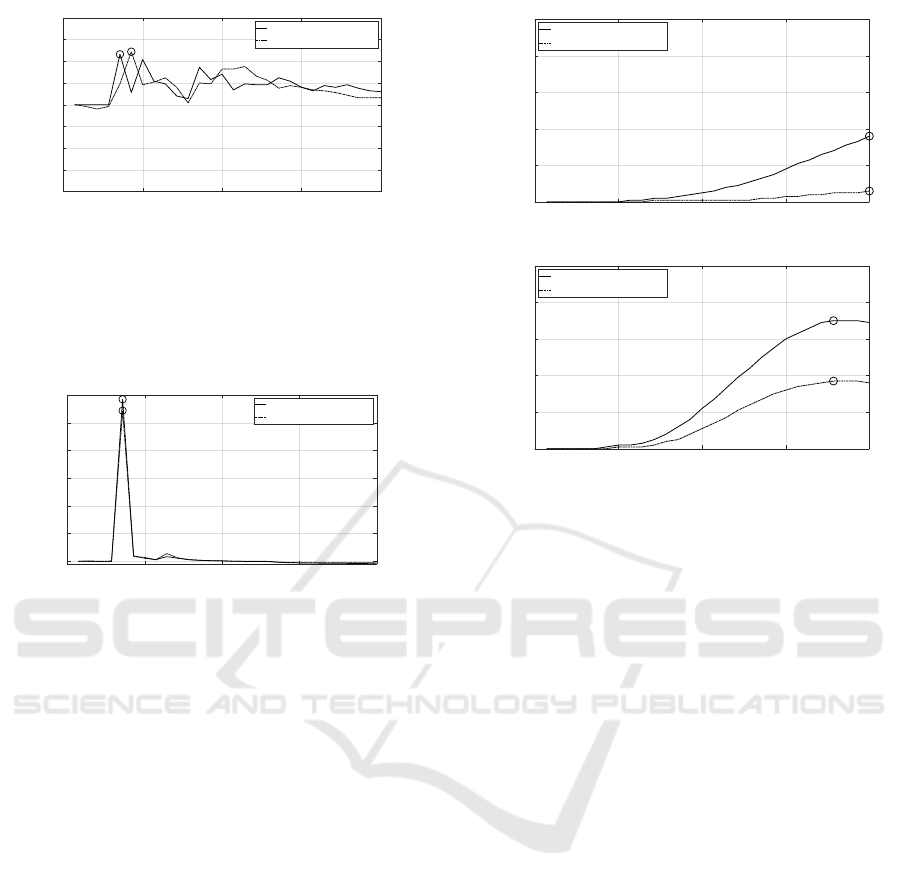
5.4 Rate of Change in Number of
Infection for the Initial Days
vis-
`
a-vis Final Days
5.4.1 Trains
In Figure 15, we observe that the number of infections
rose by 235% and 192% on the fifth day with twelve
trains per day for unrestricted and restricted move-
ment, respectively. Since the incubation period is the
first four days, we see a sharp increase in the number
of infections during that period. The growth decreases
rapidly the next day and eventually goes to zero, sug-
gesting that the number of infections decreases and
starts falling as more people recover.
0 7 14 21 28
Number of days
0
50
100
150
200
250
300
% of rate of change
Rate of change in no. of infected people with 100% of trains
Unrestricted Movement
Restricted Movement
235%
192%
Figure 15: We show the rate of change in the number of
infections over a period of twenty-eight days when twelve
trains operate per day.
5.4.2 Flights
0 7 14 21 28
Number of days
-100
-50
0
50
100
150
200
250
% of rate of change
Rate of change in no. of infected people with 100% of flights
Unrestricted Movement
Restricted Movement
186%
216%
Figure 16: We show the rate of change in the number of
infections over twenty-eight days when a hundred flights
are operated per day.
In Figure 16, we see that the number of infections
rose by 216% and 186% on the fifth day with hundred
flights per day for unrestricted and restricted move-
ment, respectively. Similar to the case of trains, this
growth falls rapidly after the incubation period. Even-
tually, it goes to zero, suggesting that the number of
cases eventually saturates and starts falling as more
people recover.
5.4.3 Buses
In Figure 17, we do not see a sudden increase in the
rate of change for the number of infections even with
the maximum frequency of the buses. The rate of
change for the number of infections remains between
25-50% for most days. This suggests that the spread
of infection, in the case of buses, is much more con-
trolled than on trains and flights.
ICAART 2023 - 15th International Conference on Agents and Artificial Intelligence
88
0 7 14 21 28
Number of days
-100
-75
-50
-25
0
25
50
75
100
% of rate of change
Rate of change in no. of infected people with 100% of buses
Unrestricted Movement
Restricted Movement
58%
61%
Figure 17: We show the rate of change in the number of
infections over twenty-eight days when three hundred buses
operate per day.
5.4.4 Combination
0 7 14 21 28
Number of days
0
500
1000
1500
2000
2500
3000
% of rate of change
Rate of change in no. of infected people with 100% of vehicles
Unrestricted Movement
Restricted Movement
2922%
2717%
Figure 18: We show the rate of change in the number of
infections over twenty-eight days when twelve trains, hun-
dred flights, and three hundred buses operate per day.
In Figure 18, we see that the number of infections rose
by 2922% and 2717% on the fifth day with twelve
trains, hundred flights, and three hundred buses per
day for unrestricted and restricted movement, respec-
tively. This is more than twelve times the rise in in-
fections for any individual mode of transport with un-
restricted movement and more than fourteen times in
case of restricted movement. Thus, we see that a com-
bination of the three modes of transport grows faster
than linear.
5.5 Equivalence Point between
Unrestricted and Restricted
Movements
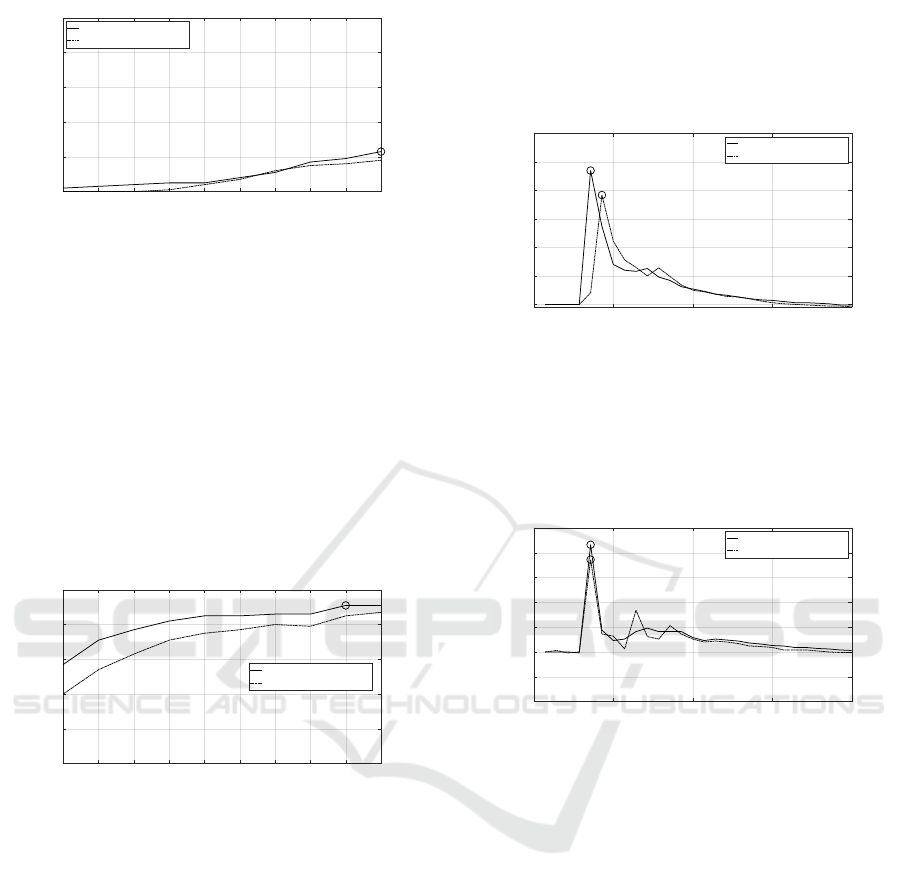
5.5.1 Trains
Figure 19 (a) and Figure 19 (b) show that the scenario
of unrestricted movement of people with one opera-
tional train per day produces an equivalent number of
infections as the scenario of eight operational trains
per day but with restricted movement.
0 7 14 21 28
Number of days
0
20
40
60
80
100
% of infected people
% of infected people with 8% of trains per day
Unrestricted Movement
Restricted Movement
6%
36%
0 7 14 21 28
Number of days
0
20
40
60
80
100
% of infected people
% of infected people with 67% of trains per day
Unrestricted Movement
Restricted Movement
37%
70%
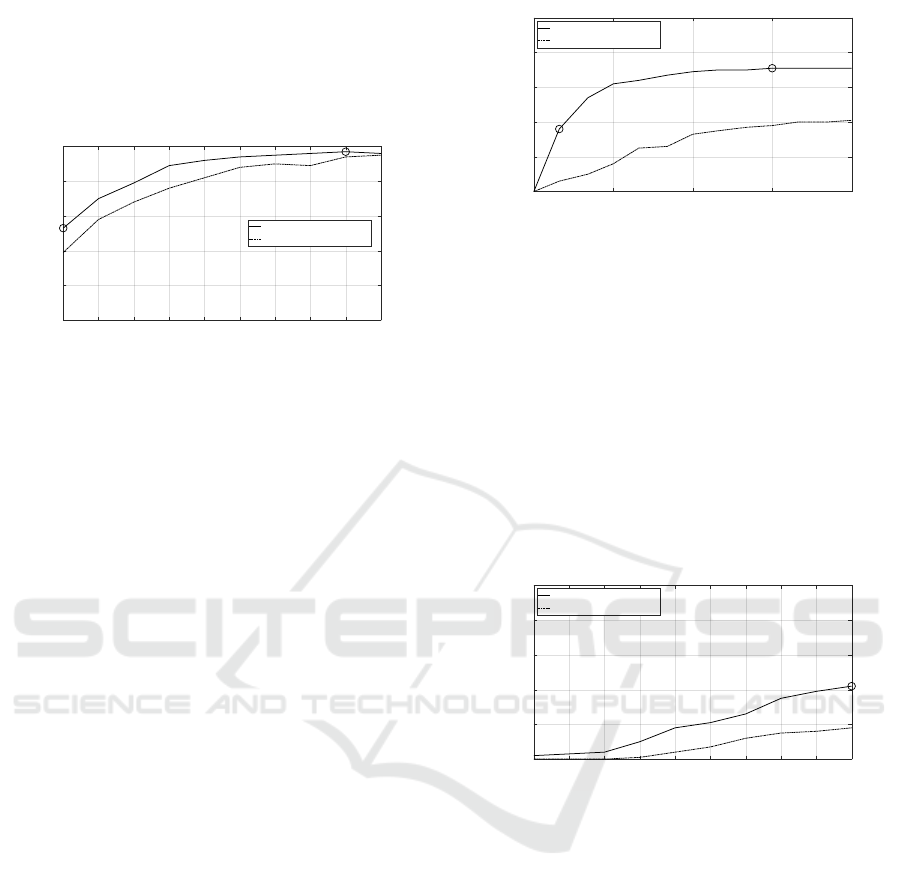
Figure 19: We show an equivalence point between unre-
stricted movement and restricted movement for trains. (a)
The scenario of 8% of trains with unrestricted movement
shows a peak of 36% of the population to be infected. (b)
The scenario of 67% of trains with restricted movement
shows a peak of 37% of the population to be infected.
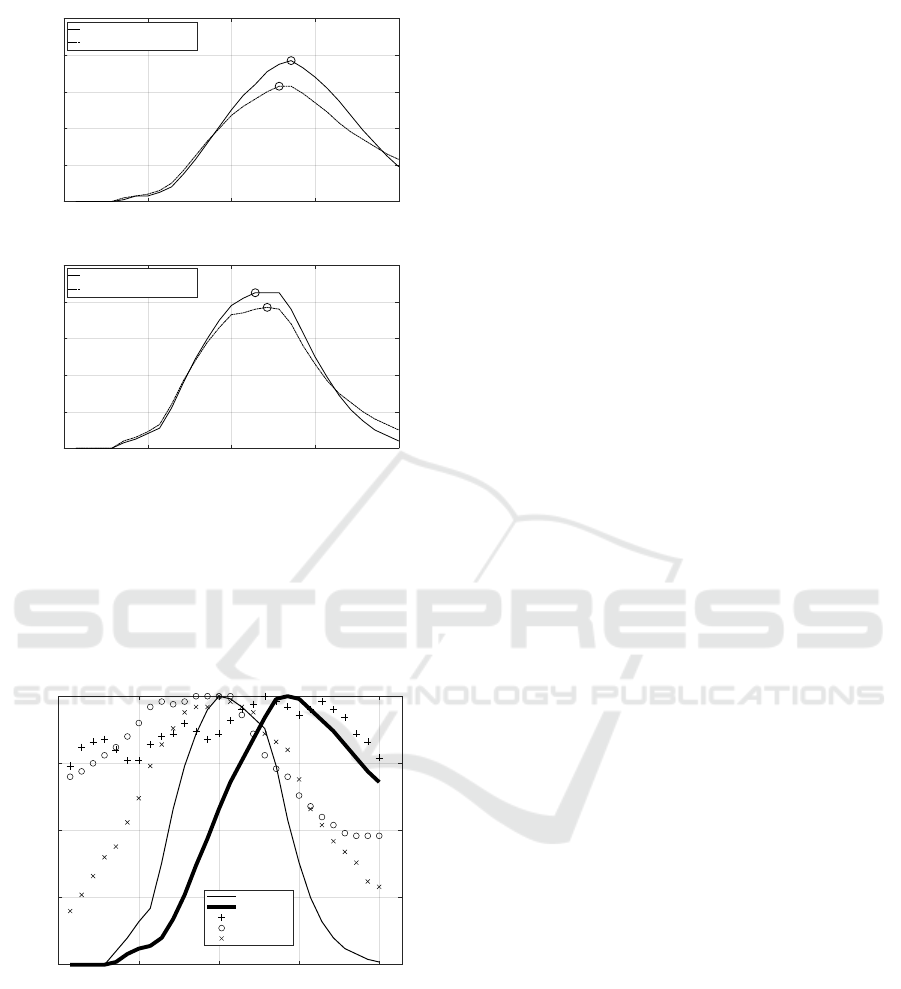
5.5.2 Flights
Figure 20 (a) and Figure 20 (b) show the unrestricted
movement of people with fifty operational flights per
day produces an equivalent number of infections as
the scenario of hundred operational flights per day but
with restricted movement.
5.5.3 Buses
The scenario of unrestricted movement of people with
two hundred and forty operational buses per day, as
shown in Figure 21 (a), produces an equivalent num-
ber of infections as the scenario of three hundred op-
erational buses per day but with restricted movement
a shown in Figure 21 (b).
5.5.4 Combination
The scenario of unrestricted movement of people with
30% of vehicles, as shown in Figure 22 (a), produces
an equivalent number of infections as the scenario of
60% of vehicles per day but with restricted move-
ment, as shown in Figure 22 (b).
Studying the Impact of Transportation During Lockdown on the Spread of COVID-19 Using Agent-Based Modeling
89
0 7 14 21 28
Number of days
0
20
40
60
80
100
% of infected people
% of infected people with 50% of flights per day
Unrestricted Movement
Restricted Movement
4%
18%
0 7 14 21 28
Number of days
0
20
40
60
80
100
% of infected people
% of infected people with 100% of flights per day
Unrestricted Movement
Restricted Movement
42%
18%
Figure 20: We show an equivalence point between unre-
stricted movement and restricted movement for flights. (a)
The scenario of 50% of flights with unrestricted movement
show shows a peak of 18% of the population to be infected.
(b) The scenario of 100% of flights show shows a peak of
18% of the population to be infected.
5.6 A Comparison of Simulation Data
with the Real-world Data
By plotting the results of the combined transporta-
tion, we find that it produces a bell-shaped curve. In
Figure 23, we compare our simulation observations
for the combined transportation with the real-world
COVID-19 data for all three pandemic waves in Goa
for twenty-eight days. The first wave begins in early
November 2020, the second wave begins in early May
2021, and the third wave begins in the second week
of January 2022. We plot the number of infections
normalized individually per the maximum number of
infections. The cases spread less rapidly as we go
from the first wave to the third wave. We see that
the curve for the unrestricted scenario reaches a max-
imum on the same timeline as the second wave. The
curve for the restricted scenario reaches a maximum
on the same timeline as the first wave and the third
wave. While there were strict restrictions at the time
of the first and third waves, the restrictions were lesser
at the time of the second wave.
0 7 14 21 28
Number of days
0
5
10
15
20
25
30
% of infected people
% of infected people with 80% of buses per day
Unrestricted Movement
Restricted Movement
17%
9%
0 7 14 21 28
Number of days
0
5
10
15
20
25
30
% of infected people
% of infected people with 100% of buses per day
Unrestricted Movement
Restricted Movement
23%
17%
Figure 21: We show an equivalence point between unre-
stricted movement and restricted movement for buses. (a)
The scenario of 80% of buses with unrestricted movement
show shows a peak of 17% of the infected population. (b)
The scenario of 100% of buses with restricted movement
show shows a peak of 17% of the infected population.
6 CONCLUSION AND FUTURE
WORK
The spread of COVID-19 infections depends on sev-
eral factors. This study presented how the infections
spread via transportation networks in two different
scenarios of movements allowed. This was done us-
ing the agent-based simulation modeling technique in
NetLogo, combined with the geospatial representa-
tion of Goa and its railway stations, airports, and bus
stop. Our source code and data files are publicly avail-
able at a GitHub
1
repository.
Previous closely related work looking at the im-
pact of transportation on the spread of the disease by
Talekar et al. (Talekar et al., 2020) focused on how
impactful the policy of creating cohorts of people is.
We, however, look at every person as an individual
and then measure how their movement via different
transportation modes will impact the spread.
In the future, this simulation can be extended to
multiple states and include international travel. More
precise road movements of people can be tracked and
1
https://github.com/Networked-Systems-Lab/
Simulating-COVID-19-Using-ABM
ICAART 2023 - 15th International Conference on Agents and Artificial Intelligence
90
0 7 14 21 28
Number of days
0
20
40
60
80
100
% of infected people
% of infected people with 30% of vehicles per day
Unrestricted Movement
Restricted Movement
77%
63%
0 7 14 21 28
Number of days
0
20
40
60
80
100
% of infected people
% of infected people with 60% of vehicles
Unrestricted Movement
Restricted Movement
77%
85%
Figure 22: We show an equivalence point between unre-
stricted movement and restricted movement for the combi-
nation of transport modes. (a) The scenario of 30% of ve-
hicles with unrestricted movement shows a peak of 77% in
the number of infections. (b) The scenario of 60% of vehi-
cles with restricted movement shows a peak of 77% in the
number of infections.
0 7 14 21 28
Numberofdays
0
0.25
0.5
0.75
1
Normalisedvalueofnumberofinfectedpeople
Comparingthenumberofinfectionsinthreewaves
ofthepandemicwiththesimulationstudy
Unrestricted
Restricted
FirstWave
SecondWave
ThirdWave
Figure 23: A comparison of our combined transportation
simulation results to the three waves of COVID-19 in Goa.
The peak of the second wave resembles the case of unre-
stricted and the peak of the third wave resembles that of
restricted movement. This is a positive indicator for the ac-
curacy of the simulation as cases rose less rapidly for the
third wave, similar to the case of restricted movement.
used to identify exposure to the virus. This will re-
quire much more computation power as we need to
track each person’s and vehicle’s movement. We may
add vaccinated people to the simulation, who will
have immunity or fewer chances of getting the dis-
ease.
REFERENCES
(1999). Netlogo. http://ccl.northwestern.edu/netlogo/.
(2022). Transportation - department of tourism, government
of goa. https://goatourism.gov.in/transportation/.
Ahmad, S., Ullah, A., Al-Mdallal, Q. M., Khan, H., Shah,
K., and Khan, A. (2020). Fractional order mathemat-
ical modeling of covid-19 transmission. Chaos, Soli-
tons & Fractals, 139:110256.
Bartsch, S., O’Shea, K., Chin, K., Strych, U., Ferguson,
M., Bottazzi, M., Wedlock, P., Cox, S., Siegmund,
S., Hotez, P., and Lee, B. (2022). Maintaining face
mask use before and after achieving different covid-19
vaccination coverage levels: a modelling study. The
Lancet Public Health, 7.
Carcione, J. M., Santos, J. E., Bagaini, C., and Ba, J. (2020).
A simulation of a covid-19 epidemic based on a deter-
ministic seir model. Frontiers in Public Health, 8.
Chatterjee, K., Chatterjee, K., Kumar, A., and Shankar, S.
(2020). Healthcare impact of covid-19 epidemic in in-
dia: A stochastic mathematical model. Medical Jour-
nal Armed Forces India, 76(2):147–155.
Iboi, E., Sharomi, O. O., Ngonghala, C., and Gumel, A. B.
(2020). Mathematical modeling and analysis of covid-
19 pandemic in nigeria. medRxiv.
Koo, J. R., Cook, A. R., Lim, J. T., Tan, K. W., and Dick-
ens, B. L. (2022). Modelling the impact of mass test-
ing to transition from pandemic mitigation to endemic
covid-19. Viruses, 14(5).
Omar, O. A., Alnafisah, Y., Elbarkouky, R. A., and Ahmed,
H. M. (2021). Covid-19 deterministic and stochastic
modelling with optimized daily vaccinations in saudi
arabia. Results in Physics, 28:104629.
QGIS Development Team (Version 3.20, 2021). QGIS Ge-
ographic Information System. QGIS Association.
Reiner, R., Barber, R., Collins, J., Zheng, P., Adolph, C.,
Albright, J., Antony, C., Aravkin, A., Bachmeier, S.,
Bang-Jensen, B., Bannick, M., Bloom, S., Carter, A.,
Castro, E., Causey, K., Chakrabarti, S., Charlson, F.,
Cogen, R., Combs, E., and Murray, C. (2021). Mod-
eling covid-19 scenarios for the united states. Nature
Medicine, 27.
Talekar, A., Shriram, S., Vaidhiyan, N., Aggarwal, G.,
Chen, J., Venkatramanan, S., Wang, L., Adiga, A.,
Sadilek, A., Tendulkar, A., Marathe, M., Sundare-
san, R., and Tambe, M. (2020). Cohorting to isolate
asymptomatic spreaders: An agent-based simulation
study on the mumbai suburban railway.
Tang, Y. and Wang, S. (2020). Mathematic modeling of
covid-19 in the united states. Emerging Microbes &
Infections, 9(1):827–829. PMID: 32338150.
Wilder, B., Charpignon, M., Killian, J., Ou, H.-C., Mate,
A., Jabbari, S., Perrault, A., Desai, A., Tambe, M., and
Majumder, M. (2020). The role of age distribution and
family structure on covid-19 dynamics: A preliminary
Studying the Impact of Transportation During Lockdown on the Spread of COVID-19 Using Agent-Based Modeling
91

modeling assessment for hubei and lombardy. SSRN
Electronic Journal.
Zhang, Y., You, C., Cai, Z., Sun, J., Hu, W., and Zhou, X.-
H. (2020). Prediction of the covid-19 outbreak based
on a realistic stochastic model. medRxiv.
ICAART 2023 - 15th International Conference on Agents and Artificial Intelligence
92
