
Methods to Estimate Respiratory Rate Using the
Photoplethysmography Signal
Ayalon Angelo de Moraes Filho
a
, Guilherme Schreiber
b
, Julio Alexander Sieg
c
,
Maicon Diogo Much
d
, Vanessa de Moura Bartoski
e
and César Marcon
f
School of Technology, Pontifical Catholic University of Rio Grande do Sul, Porto Alegre, Brazil
Keywords: Health, Photoplethysmography, Respiratory Rate Estimation.
Abstract: Academia and industry have devoted significant effort to the research and development of smart wearable
devices applied to health monitoring. The photoplethysmography (PPG) sensor is widely used for monitoring
biosignals, such as heart and respiratory rate (RR), which are influenced by the cardiovascular system. This
work focuses on analyzing methods for RR estimation regarding the effect of breathing on the PPG signal
variation. This work describes, implements, and analyzes four methods for estimating RR. These methods are
based on capturing RR using Fast Fourier Transform, median, and extracting physiological characteristics
induced by respiration in the PPG signal. The most efficient method merges three RR calculations analyzed
on the same signal, achieving nearly 93% of efficacy in the best scenario. The method efficacies were
calculated using PPG signals from the BIDMC and CapnoBase databases collected from patients during
hospital care. The analysis allows for understanding and mitigating the RR estimation challenges and
evaluating the most efficacy method for a wearable device monitoring scenario.
1 INTRODUCTION
The aging population, the availability of mobile
broadband connectivity, and the development of
sophisticated technologies have driven the adoption
of personalized, digital, or remote patient monitoring
methods. This process was further accelerated with
the emergence of the coronavirus pandemic, which
increased pressure on limited hospital facilities,
requiring medical service providers to accelerate the
research and implementation of new technologies for
monitoring health outside the hospital (Olivadoti,
2022), especially in the patient's home.
Sensor innovations allow vital signs to be
measured with clinical-grade accuracy in a residential
setting. Wearable devices are more accessible,
enabling home monitoring of philological signs, such
as body temperature, heart rate, Respiratory Rate
(RR), blood pressure, and oxygen saturation.
RR is a valuable diagnostic and prognostic marker
of health. In hospital healthcare, it is a highly
sensitive marker of acute deterioration. For example,
a
https://orcid.org/0000-0001-7044-1504
b
https://orcid.org/0000-0002-1037-4853
c
https://orcid.org/0000-0003-3966-9855
an elevated RR predicts cardiac arrest and in-hospital
mortality and may indicate respiratory dysfunction.
Consequently, RR is measured between four and six
hours in hospitalized patients with acute illness. RR
is also used in emergency triage. In primary care, RF
is used to identify pneumonia and as a marker of
pulmonary embolism. However, RR is usually
measured by manually counting chest wall
movements (outside intensive care) and is a time-
consuming, imprecise, and poorly performed process
(Charlton et al., 2018).
The optical photoplethysmograph (PPG) sensor is
commonly found among wearable physiological
signal monitoring devices, such as pulse oximeters,
due to its simplicity, low cost, and non-invasive
approach. The PPG sensor is directly related to the
cardiovascular system, detecting blood content and
volume changes in the microvascular system.
Because the cardiovascular and respiratory systems
are correlated, researchers have made efforts to
develop algorithms capable of inferring the
respiration rate from the PPG signal.
d
https://orcid.org/0000-0002-1760-907X
e
https://orcid.org/0000-0001-6365-9273
f
https://orcid.org/0000-0002-7811-7896
Moraes Filho, A., Schreiber, G., Sieg, J., Much, M., Bartoski, V. and Marcon, C.
Methods to Estimate Respiratory Rate Using the Photoplethysmography Signal.
DOI: 10.5220/0011729100003414
In Proceedings of the 16th International Joint Conference on Biomedical Engineering Systems and Technologies (BIOSTEC 2023) - Volume 5: HEALTHINF, pages 445-452
ISBN: 978-989-758-631-6; ISSN: 2184-4305
Copyright
c
2023 by SCITEPRESS – Science and Technology Publications, Lda. Under CC license (CC BY-NC-ND 4.0)
445
The main objective of this work is to present RR
inference methods from PPG signals for obtaining the
best efficiency for absolute error equal to 0 breaths
per minute (rpm) in the analyzed data.
2 THEORETICAL FOUNDATION
PPG is used to measure blood volume changes in the
microvascular tissue bed under the skin; these
changes occur due to the pulsatile nature of the
circulatory system (Kamal et al., 1989). As an optical
technique, PPG requires a light source and a
photodetector. Light passing through biological tissue
can be absorbed by different substances, including
pigments in skin, bones, and arterial and venous
blood. Most changes in blood flow occur primarily in
the arteries and arterioles. PPG sensors optically
detect changes in blood flow volume (i.e., changes in
detected light intensity) in the microvascular tissue
bed, either through reflection or transmission through
the tissue (Tamura et al., 2014).
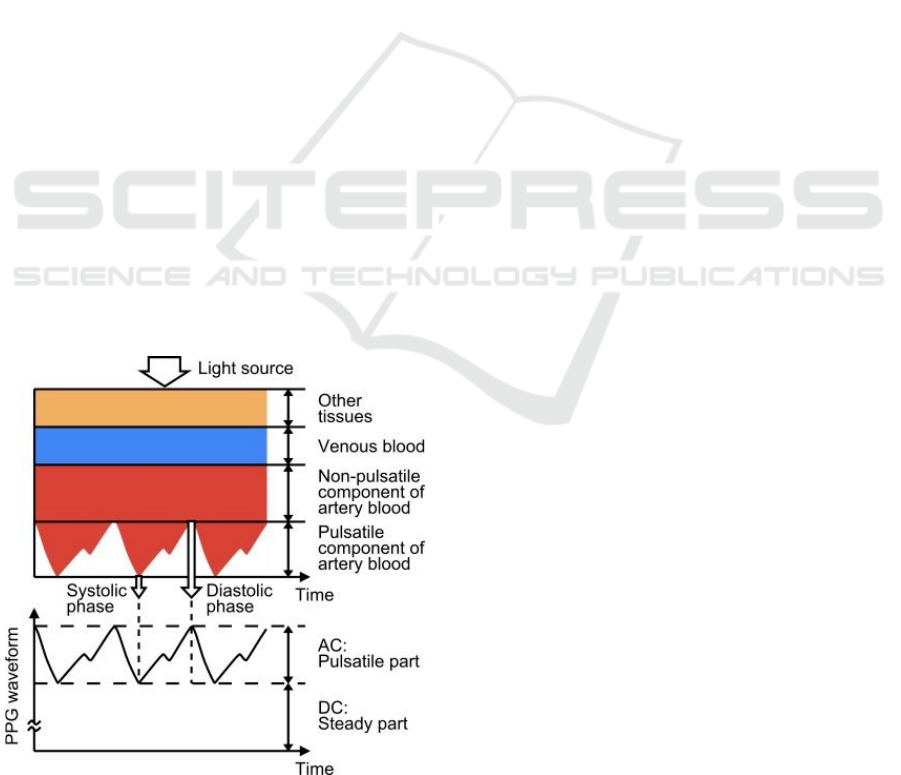
Figure 1 exemplifies a PPG waveform consisting
of direct current (DC) and alternating current (AC)
components. The DC component corresponds to the
transmitted or reflected optical signal detected in the
tissue; this component depends on the tissue structure
and the average volume of arterial and venous blood.
The AC component shows changes in blood volume
between the cardiac cycle's systolic and diastolic
phases; the AC component's fundamental frequency
depends on the heart rate and is superimposed on the
DC component (Tamura et al., 2014).
Figure 1: PPG waveform example (Tamura et al., 2014).
PPG pulse wave morphology is influenced by (i)
the heart, which considers cardiac ejection
characteristics, including heart rate and rhythm, and
stroke volume; (ii) circulation, including
cardiovascular properties such as arterial stiffness and
blood pressure; (iii) additional physiological
processes, including breathing and the autonomic
nervous system, that can be affected by stress; and
(iv) diseases (Mejıa-Mejıa et al., 2021). The quality
of the PPG signal depends on the wavelength of the
light, measurement location, i.e., sensor attachment
location, contact force, motion artifacts, the breathing
of the individual being measured, and ambient
temperature (Tamura & Maeda, 2018). These factors
generate various types of additive noise (artifacts)
that can be contained in PPG signals, affecting signal
characteristics.
Respiratory-induced changes in intrathoracic
pressure are transmitted to the central veins,
generating a change in blood pressure that the
spectrum of the PPG signal can detect. Breathing can
induce variations in the PPG signal in three ways
(Dehkordi, 2018):
Respiratory-Induced Intensity Variation (RIIV) -
Changes in venous return due to changes in
intrathoracic pressure throughout the respiratory
cycle cause a modulation of the baseline (i.e., the
continuous component - DC) of the PPG signal;
Respiratory-Induced Amplitude Variation
(RIAV) - During inspiration, the systolic volume
of the left ventricle decreases due to changes in
intrathoracic pressure, reducing the pulse
amplitude and the opposite happens during
expiration;
Respiratory-Induced Heart Rate Variation
(RIFV) - Heart rate varies throughout the
respiratory cycle, increasing during inspiration
and decreasing during expiration.
3 RELATED WORK
Table 1 stands 19 works and the one proposed here
concerning (i) the year of publication, (ii) the
foundation that guides the extraction of the RR, (iii)
the extraction method used, (iv) the domain in which
the signals were analyzed; and (v) database used to
obtain the PPG signal.
The Base column of Table 1 shows that the RR
extraction from most works is based on the
physiological characteristics of breathing, with a
smaller portion of the works employing the PPG
signal filtering process. When we analyze the filtering
methods in isolation, represented by Fl, we realize
HEALTHINF 2023 - 16th International Conference on Health Informatics
446

Table 1: Related work comparison.
Article Base Method Domain Dataset
Pimentel et al., 2017 Rpc FFT*, RIIV, RIAV, RIFV, Fusion Freq. CapnoBase, BIDMC
Or
p
hanidou, 2017 R
p
c EEMD, RIAV, RIFV Tem
p
o Ad hoc
Motin et al., 2018 Fl FFT, EEMD Fre
q
.Ca
p
noBase, MIMIC
Khreis et al., 2018 R
p
c RIIV, RIAV, RIFV Time Ca
p
noBase
Birrenkott et al., 2018 Rpc FFT*, RIIV, RIAV, RIFV Freq. CapnoBase, MIMIC
Motin et al., 2019 Fl EMD, EEMD, CEEMD, CEEMDAN, ICEEMDAN Time CapnoBase, MIMIC
Yang, 2019 Rpc FFT*, RIIV, RIAV, RIFV, Fusion Freq. Ad hoc
Pollreisz and Nejad,
2020
Rpc FFT*, RIIV, RIAV, RIFV, Fusion Freq. Ad hoc
Motin et al., 2020 Fl FFT*, EEMD, RIIV, RIAV, RIFV Freq. Ad hoc
Pollreisz and
TaheriNejad, 2020
Rpc FFT*, RIFV Freq. Ad hoc
Khreis et al., 2020 Rpc FFT*, RIIV, RIAV, RIFV Freq. CapnoBase, Sherpa
m
Lazazzera and Carrault,
2020
Fl, Rpc FFT*, EMD, DWT, RIIV, RIAV, RIFV, Fusion Freq. CapnoBase
Kozumplik et al., 2021 Rpc FFT*, RIIV, RIAV Freq., Time CapnoBase, BIDMC
Fikriastuti and
Muhaimin, 2021
Rpc FFT, RIIV, RIAV, RIFV, Fusion Freq. CapnoBase
Proto
p
saltis et al., 2021 R
p
c FFT*, RIIV, RIAV, RIFV, Fusion Fre
q
.Ca
p
noBase, Ad hoc
Haddad et al., 2021 Rpc RIIV, RIAV, RIFV, Fusion Time CapnoBase
Icazatti et al., 2021 Fl FIR Time BIDMC, CCSHS
Adami et al., 2021 Fl FFT*, EMD, DWT Fre
q
. BIDMC, MIT-BIH
Chen et al. 2021 R
p
c FFT*, RIIV, RIAV, RIFV, Fusion Fre
q
. Ad hoc
This wor
k
Fl, Rpc FFR*, Median, RIIV, Fusion Freq., Time BIDMC, CapnoBase
LEGEND: Rpc – Respiratory physiological characteristics; Fl – Only applying Filters
Freq. – Frequency domain; Time – Time domain
FFT – Fast Fourier Transform; FFT* – FFT used to extract the spectral frequency without capturing RR directly
RIIV, RIAV, RIFV – Respiratory-Induced Variation regarding Intensity, Amplitude and Frequency, respectively
Fusion – extract RR correlating RIIV, RIAV, RIFV; EMD – Empirical Mode Decomposition
EEMD, CEEMD, CEEMDAN, ICEEMDAN – Special methods based on EMD
DWT – Discrete Wavelet Transform; Median –
extracts RR from the baseline variation of the PPG signal median
that most of the works (Motin et al., 2018) (Motin et
al., 2019) (Motin et al., 2020) (Lazazzera and
Carrault, 2020) (Adami et al., 2021) extracts RR
using EMD and its variations (see column Method).
We identified the predominance of RIIV, RIAV,
and RIFV modulations in the analysis referring to the
extraction of RR based on respiratory physiological
characteristics, represented by Rpc in the Base
column.
Additionally, we divided the articles that extract
the RR based on the physiological characteristics of
breathing into three sets. These sets are composed of
works that assess the performance of RIIV, RIAV,
and RIIF: (i) only individually (Pollreisz and
TaheriNejad, 2020) (Lazazzera and Carrault, 2020)
(Kozumplik et al., 2021); (ii) individually, but
consider RR obtained with the highest quality index
(Khreis et al., 2018)(Birrenkott et al., 2018)(Khreis et
al., 2020); (iii) merging the partial RR values
obtained in each modulation to calculate the final RR
(Pimentel et al., 2017) (Orphanidou, 2017) (Yang,
2019) (Pollreisz and Nejad, 2020) (Lazazzera and
Carrault, 2020) (Fikriastuti, and Muhaimin, 2021)
(Protopsaltis et al., 2021) (Haddad et al., 2021) (Chen
et al., 2021).
The Domain column points out that most of the
works estimate RR by analyzing the signals in the
frequency domain, except for (Orphanidou, 2017)
(Khreis et al., 2018) (Motin et al., 2019) (Haddad et
al., 2021) (Icazatti et al., 2021) that employ the time
domain. Consequently, we explored the RR
extraction with methods that analyze both the time
and frequency domains, and we chose to employ the
Fast Fourier Transform (FFT) in all implemented
methods.
The Database column shows that most works use
CapnoBase, followed by the MIMIC and BIDMC
databases. This reason led us to choose the
CapnoBase and BIDMC databases in this work,
which are freely available and organized to obtain RR
from the PPG signal analysis. Additionally, we
decided to include the Synthetic Dataset from the
Methods to Estimate Respiratory Rate Using the Photoplethysmography Signal
447

Respiratory Rate Estimation project (Charlton, 2016)
to assess the ideal measurement time window, given
that data is in a noise-free environment.
The work proposed here developed three
algorithms entitled “FFT Method”, “Median
Method”, and “RIIV Method” to study the
performance when extracting the respiratory rate in
signals containing respiration-induced baseline
modulation. Besides, the work proposed here
implements the “Fusion Method”, which in its initial
stage evaluates RRs obtained with the three baseline
methods and merges these values when a given
criterion is accepted; otherwise, the measurement is
discarded.
4 METHODS FOR ESTIMATING
RESPIRATORY RATE
We implemented four methods to analyze the
effectiveness and efficiency of RR estimations from
the PPG signal. These methods enable estimating RR
(i) using an FFT; (ii) Median; (iii) exploring breath-
induced intensity variations, i.e., RIIV; and (iv)
integrating multiple RR estimates.
4.1 Fast Fourier Transform Method
The Fast Fourier Transform (FFT) quickly calculates
the discrete Fourier transform of a data sequence,
allowing us to obtain the signal frequency spectrum.
FFT is one of the most used methods to analyze
signals in the frequency domain because time is
mathematically eliminated during the transformation
process, resulting only in signal frequency
components (Tamura and Maeda, 2018).
This method uses the SciPyfft function of the
Python SciPy library to return the discrete Fourier
transform of a real or complex sequence (Bluestein,
1970). The extraction of RR from the PPG signal
follows the following steps:
Converting the PPG signal from the time domain
to the frequency domain applying FFT;
Transforming the frequency value to “rpm” by
multiplying the dominant peak value by 60;
Identifying the dominant frequencies by
extracting the RR value within the acceptable
range for humans - between 4 rpm (0.06 Hz) and
60 rpm (1 Hz).
4.2 Median Method
The Median Filter allows extracting the baseline
present in the PPG signal (Awodeyi et al., 2013). The
Median Method explores the baseline variation by
calculating the PPG signal median.
This method uses the numpy.median function of
the Python Numpy library to return the median of the
vector elements. The RR extraction from the PPG
signal requires the following steps:
Calculating the median with a sliding vector of the
signal sample rate size;
Applying the FFT in the resulting vector and
selecting the dominant frequency peak within the
valid RR range;
Multiplying the dominant frequencies by 60 to
convert to “rpm”.
4.3 RIIV Method
The RIIV Method explores baseline variations
obtained through linear interpolation between the
PPG signal peaks. We implemented this method
using the SciPy.find_peaks and SciPy.interpolate,
present in the Python SciPy library, which returns a
vector containing all the peaks of a signal and
function whose calling method interpolates to find the
value of new points (Bluestein, 1970).
RR can be acquired with an analysis in time or
frequency. Time analysis is achieved by counting
peaks or valleys in the signal. Frequency analysis
requires the FFT application; in this case, RR is the
dominant signal frequency generated by the FFT
within the RR human spectrum. The RR measured by
the respiration-induced variation methods is
performed via the following steps:
Extraction of the induced baseline variation in the
PPG signal to get the respiratory signal in time;
FFT Application on the respiratory signal and
selection of the dominant frequency peak within
the valid RR spectrum;
Multiplying the dominant frequencies by 60 to
convert to “rpm”.
4.4 Fusion Method
Merging RR estimates complements the three
methods discussed earlier. This method ascends the
RR values obtained by the FFT, Median, and RIIV
methods, creating a three-position vector containing
the smallest (min), intermediate (itr), and largest
(max) values, and considers an error (ε) between
these values to determine the merge rule.
The determination of the error value is empirical,
and for this work, ε=0 rpm was chosen to perform an
in-depth analysis of the results.
The RR fusion estimate is constructed using the
HEALTHINF 2023 - 16th International Conference on Health Informatics
448

following conditions and considering their ordering:
If the difference between the smallest and largest
vector value is less than or equal to the error, then
RR is the average of the three values. The reason
is to assume that if the three samples are close,
then they must be close to the true RR value;
If the above conditions are not satisfied, RR is not
measured. As there is no consensus on the best
estimate, the method characterizes the sample as
a noisy signal, and the estimated value is
discarded. RR cannot be measured in an extreme
situation where this condition occurs in all
samples.
RR=
min + itr + max
3
if
|
min − max
|
≤ ε
not
evaluated
otherwise
5 EXPERIMENTAL
RESULTS – SYNTHETIC DATA
Synthetic Dataset is a database created in the
Respiratory Rate Estimation project that contains
synthetic ECG and PPG signals (Charlton, 2016).
These signals were developed to verify the
performance of methods to estimate RR in a scenario
without external noise. The dataset includes PPG
signals in the RR range between 4 and 60 rpm,
modulated in isolation concerning baseline,
amplitude, and frequency. It contains mathematically
equated PPG signals, not including external
interferences during its construction, enabling to get
accurate information on the influence of the window
size used for the RR measurement.
The initial length of the observation window was
empirically selected to be equal to 10s. Note that a
huge observation window requires a long time to
obtain a sample value; however, a tiny observation
window can lead to inaccuracy. The initial value was
considered the “smallest observation window” to
measure the RR. Subsequently, a value equivalent to
“smallest window” was added to find an observation
window size in which the absolute error between the
reference value and the estimated value remained
unchanged. This is considered the minimum precision
window; upper observation windows should not
change the RR results due to data subsampling.
All the methods analyzed in this section presented
stable values with an absolute error equal to zero for
observation windows greater than 50s. The
observation window of 10s was the only one that
presented an absolute error equal to 2 rpm, being
considered the highest error found. The window of
30s presented an absolute error equal to zero.
Some estimates obtained with 40s windows were
worse than the 30s estimates due to the signal being
synthetic, so the multiplicity of 40s generates a
precision error for the 500Hz samples. This finding
was essential to understand the influence of the
sampling rate in obtaining the best observation
window. Additionally, this finding indicates that it is
impossible to define an optimal observation window
value because it depends on the PPG signal.
6 EXPERIMENTAL
RESULTS – REAL DATA
The CapnoBase dataset (Karlen, 2010) contains ECG,
pulse oximetry with PPG, and CO
2
data from 42
cases, each described by an 8min recording. In
addition, CapnoBase provides the RR measured for
everyone, enabling us to evaluate the methods used.
BIDMC (Pimentel et al., 2018) is a dataset used to
assess the performance of RR methods. BIDMC
contains information from ECG, PPG pulse oximetry,
and respiratory signs from impedance
pneumography. All these signals were acquired from
53 intensive care patients, with recordings lasting
8min for each patient.
Figure 2 presents the configurations performed to
obtain the experimental data. The CapnoBase and
BIDMC databases underwent an equalization process
to obtain consistent RF reference values throughout
the sampling interval. The equalization generated the
banks called CapnoBase* and BIDMC*, which
contain sensory data from 42 and 53 people,
respectively; this data corresponds to 95 PPG signals,
each with 360s of sampling.
RR results
BIDMC*
53
Sliding observation
windows (30s, 60s)
+
632
60. 040
FFT
RIIV
RIAV
RIFV
EMD
+
-
Efficacy
Reference value
CapnoBase*
Equalization
CapnoBase
Equalization
BIDMC
42
Samples
-
Efficacy
Reference value
×
95
360. 240
Assessments
Fusion
+
60. 040
60. 040
60. 040
60. 040
60. 040
60. 040
180. 120
180. 120
60. 040
Figure 2: Settings performed to obtain experimental data.
These samples were evaluated by the FFT,
Median, RIIV, and Fusion methods in sliding
observation windows of 30s and 60s to assess
estimation errors with different window sizes.
Additionally, we chose to use sliding windows
with a base of 1s to smooth the passage from one
Methods to Estimate Respiratory Rate Using the Photoplethysmography Signal
449
sample to another – this approach was also adopted
by Fikriastuti and Muhaimin (2021). Using a sliding
window of 1s, within the range of 360s, implied 331
and 301 samples for the observation windows of 30s
and 60s, respectively. We chose to work with only six
minutes (360s) of the databases containing eight-
minute samples, removing the initial and final
minutes of each patient; this choice was made
empirically to remove the edges of the databases and
eliminate possible erroneous measurements.
This procedure results in 632 observation
windows for each of the 95 PPG signals;
consequently, 60,040 evaluations must be carried out
using three of the four proposed methods – except for
the Fusion Method, which takes the results of the
FFT, Median, and RIIV methods as input. The
execution of all experiments results in 360,240 RR
estimates, whose absolute error and corresponding
effectiveness are evaluated by comparing with the
reference values included in the CapnoBase and
BIDMC databases.
The Fusion Method evaluates the quality of the
signal when it integrates the three RR values
obtained—performing this method on CapnoBase
data removed 5722 and 4949 samples for observation
windows of 30s and 60s, respectively. Similarly,
BIDMC had 7493 and 6745 samples removed for
observation windows of 30s and 60s, respectively.
This removal is not directly related to the noise in the
database but instead to the discrepancy between the
FFT, Median, and RIIV methods, which did not allow
the Fusion Method to choose the best estimate to be
taken. Because of these removals, all the percentage
analyses presented in this section subtract the samples
classified as noisy from the total amount of samples
for the Fusion Method.
The two databases contain the reference RRs for
each PPG signal. However, in some cases, the
reference values to assess the CapnoBase RR were
only present in the range of 7s to 72s or smaller
intervals. In comparison, each patient has a total of
480s (8min) to store the PPG signal and its respective
respiratory reference signal (CO
2
). To obtain the RR
reference values over the entire 360s interval
explored in the database, we applied an FFT on the
CO
2
signal.
To maintain similarity in the analysis of the two
databases, we applied the same procedure to the
Impedance signal present in the BIDMC database.
This process in both databases was called
Equalization. However, the Equalization approach
can fail when the analyzed window contains noise
that overlaps the respiratory signal, as illustrated in
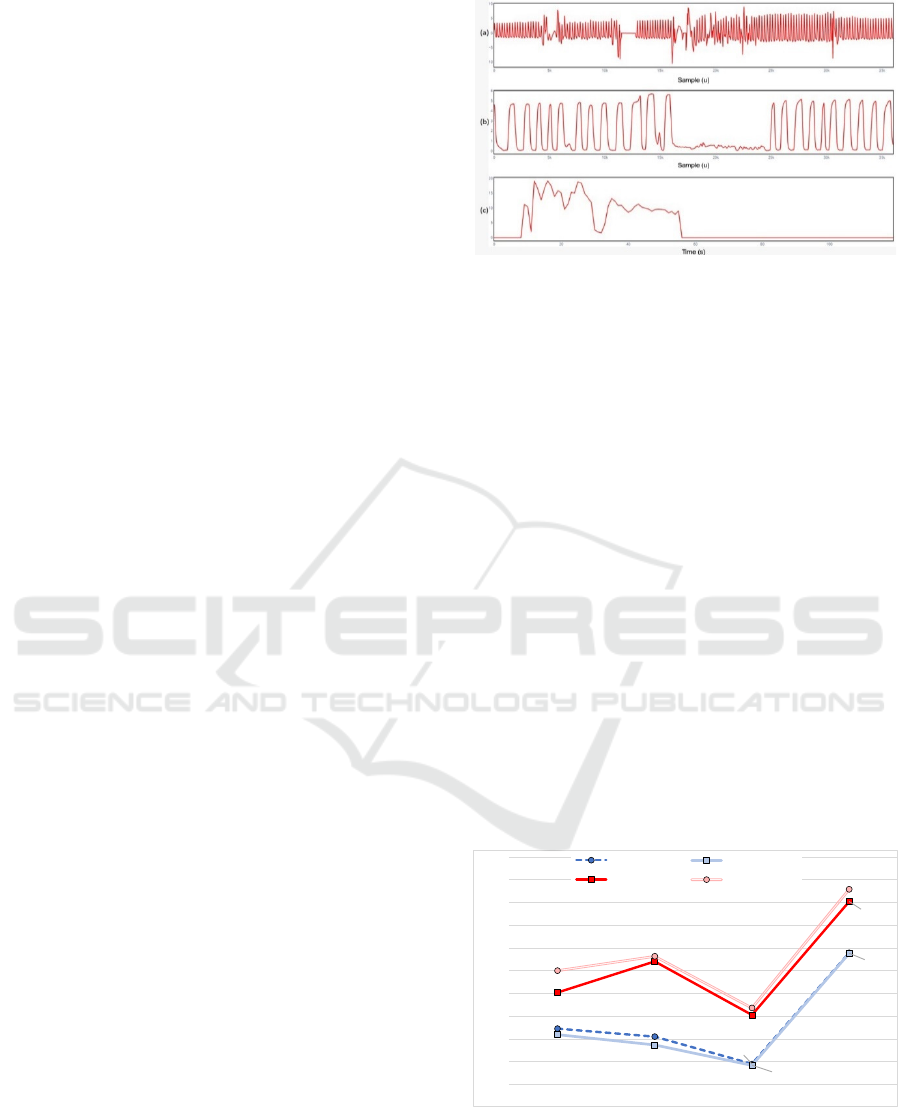
Figure 3. Since the respiratory signal is not evaluated
Figure 3: Example of CapnoBase data containing intense
noise that overlaps with (a) PPG and (b) CO
2
signal, and (c)
RR reference values.
correctly, the RR estimates will likely suffer
deviations that can alter the efficacy analysis of the
evaluated methods.
We decided to evaluate two window observation
sizes (30s and 60s), as the variability contained in the
databases can generate artifacts that can be minimized
in larger windows. Finally, we chose to work with
only 6 minutes of the databases containing eight-
minute samples, discarding the initial and final
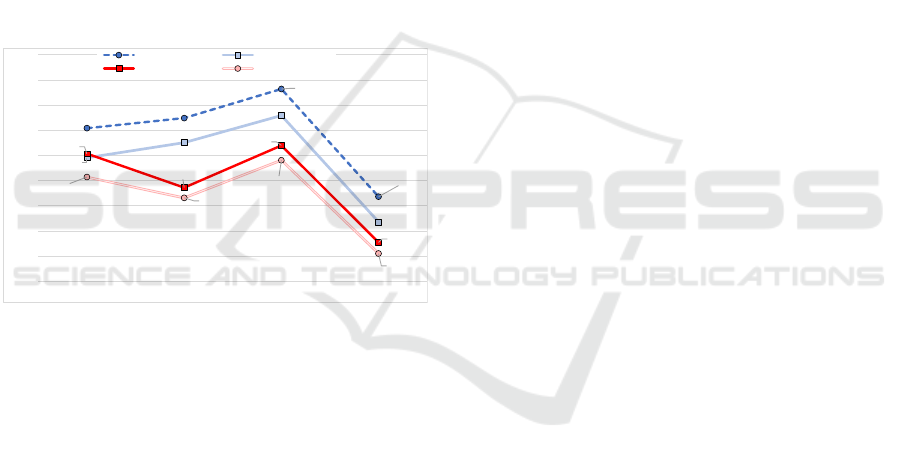
minutes of each patient. Figure shows the percentage
of samples with 100% accuracy in the RR obtained
with each evaluated method, considering the data
provided by CapnoBase and BIDMC for both
observation windows. Regarding only the CapnoBase
dataset, the result analysis shows an average variation
of practically 5% error with the observation window
reduction. This variation indicates that the proposed
methods improve the RR estimates as the observation
window increases. Additionally, the Fusion Method
obtains the highest efficacy, improving the quality of
the estimates obtained with the other methods.
Figure 4: Percentage of samples reaching 100% efficacy
using CapnoBase and BIDMC datasets and sliding
observation windows of 30s and 60s.
The results of BIDMC indicate many similarities
in the data contained in the databases. Clear examples
62.28%
60.53%
54.51%
78.98%
60.95%
58.72%
54.22%
78.86%
70.21%
77.05%
65.28%
90.24%
75.03%
78.18%
66.82%
92.93%
50%
55%
60%
65%
70%
75%
80%
85%
90%
95%
100%
FFT MEDIAN RIIV FUSION
BIDMC (30s) BIDMC (60s)
CAPNOBASE (30s) CAPNOBASE (60s)
HEALTHINF 2023 - 16th International Conference on Health Informatics
450
are the Fusion Method, which had the best results for
the BIDMC and CapnoBase databases, and the RIIV
method, which had the lowest estimates in both
databases. Additionally, the 60s observation window
performed poorly compared to the results obtained
with 30s windows.
Figure presents the same experiment as Figure
but highlights the number of RR samples that had
errors of 3 rpm or more. Once again, it is possible to
observe that the Fusion Method achieves the best
results for both databases and observation windows,
with the worst results obtained with the RIIV Method.
Although RR estimates with errors of 3 rpm or more
may be unacceptable, the number of samples with
these values is proportionally low when using Fusion
Method. Additionally, samples with high errors are
interlaced with samples of greater efficacy, enabling
filtering software to remove sudden variations
between samples and improving the average accuracy
of the RR estimate.
Figure 5: Percentage of samples with errors upper to 3 rpm
of RR using CapnoBase and BIDMC datasets and sliding
observation windows of 30s and 60s.
Additionally, Figure and Figure display that all
methods are more effective when working with the
CapnoBase database, and Fusion and RIIV methods
have the best and worst performances among the
methods, respectively. However, the same efficacy
was not achieved with the BIDMC database. A
possible reason for this achievement is acquired when
visually analyzing the PPG signals; i.e., a higher
number of samples with artifacts was identified in the
BIDMC database, which is the main reason for the
methods having lower performance compared to the
evaluations made with CapnoBase.
7 CONCLUSION
This work evaluated the effectiveness of four
methods for inferring the respiratory rate of PPG
signals available in synthetic databases. The Fusion
Method showed the highest efficiency among the
evaluated methods, mainly because the merger
achieved, on average, the best results of the correlated
methods. The proposed methods can be easily
implemented within firmware on a wearable device,
making it possible to evaluate the methods explored
in this work in real scenarios and in real-time. As a
future work, we intend to compare the methods
proposed here with other works described in the
literature to assess the relative effectiveness of the
approaches.
ACKNOWLEDGMENT
This study was financed in part by the Coordination
for the Improvement of Higher Education Personnel -
Brazil (CAPES) - Finance Code 001, National
Council for Scientific and Technological
Development (CNPq) and Financier of Studies and
Projects (FINEP).
REFERENCES
Olivadoti, G. (2022). How Advances in Sensor and Digital
Technology Yield Better Patient Care, Thought
Leadership Article, Analog Devices, pp. 1-2.
Charlton, P., Birrenkott, D., Bonnici, T., Pimentel, M.,
Johnson, A., Alastruey, J., Tarassenko, L., Watkinson,
P., Beale, R., Clifton, D. (2018). Breathing Rate
Estimation from the Electrocardiogram and
Photoplethysmogram: A Review, IEEE Reviews in
Biomedical Engineering, v. 11, pp. 2-20.
Karlen, W., Turner, M., Cooke, E., Dumont, G.,
Ansermino, J., (2010). CapnoBase: Signal database and
tools to collect, share and annotate respiratory signals,
Proceedings of the Annual Meeting of the Society for
Technology in Anesthesia (STA), pp. 1-27.
Pimentel, M., Johnson, A., Charlton, P., Clifton, D. (2018).
BIDMC PPG and Respiration Dataset,
https://physionet.org/content/bidmc/1.0.0/.
Kamal, A., Harness, J., Irving, G., Mearns, A. (1989). Skin
photoplethysmography—a review, Computer methods
and programs in biomedicine, v. 28, n. 4, pp. 257-269.
Tamura, T., Maeda, Y., Sekine, M., Yoshida, M. (2014).
Wearable photoplethysmographic sensors—past and
present, Electronics, v. 3, n. 2, pp. 282-302.
Mejıa-Mejıa, E., Allen, J., Budidha, K., El-Hajj, C.,
Kyriacou, P., Charlton, P. (2021).
Photoplethysmography Signal Processing and
Synthesis”, Photoplethysmography - Technology,
Signal Analysis and Applications, Academic Press,
chap. 4, pp. 69-146.
30.43%
32.45%
38.23%
16.83%
24.57%
27.56%
32.97%
11.82%
25.36%
18.64%
27.02%
7.74%
20.72%
16.59%
24.08%
5.55%
0%
5%
10%
15%
20%
25%
30%
35%
40%
45%
FFT MEDIAN RIIV FUSION
BIDMC (30s) BIDMC (60s)
CAPNOBASE (30s) CAPNOBASE (60s)
Methods to Estimate Respiratory Rate Using the Photoplethysmography Signal
451

Tamura, T. and Maeda, Y. (2018) Pulse and Flow –
Photoplethysmogram, Seamless Healthcare
Monitoring - Advancements in Wearable, Attachable,
and Invisible Devices, Springer, Part III, pp. 159-192.
Dehkordi, P., Garde, A., Molavi, B., Ansermino, J.,
Dumon, G. (2018). Extracting Instantaneous
Respiratory Rate from Multiple Photoplethysmogram
Respiratory-Induced Variations, Frontiers in
Physiology, v. 9, pp. 948.1-948.10.
Charlton, P., Bonnici, T., Tarassenko, L., Clifton, D., Beale,
R., Watkinson, P. (2016). An Assessment of
Algorithms to Estimate Respiratory Rate from The
Electrocardiogram and Photoplethysmogram,
Physiological Measurement, v. 37, n. 4, pp. 610-626.
Pimentel, M., Johnson, A., Charlton, P., Birrenkott, D.,
Watkinson, P., Tarassenko, L. Clifton, D. (2017).
Toward a Robust Estimation of Respiratory Rate from
Pulse Oximeters, IEEE Transactions on Biomedical
Engineering, v. 64, n. 8, pp. 1914-1923.
Orphanidou, C. (2017). Derivation of respiration rate from
ambulatory ECG and PPG using Ensemble Empirical
Mode Decomposition: Comparison and fusion,
Computers in Biology and Medicine, v. 81, pp. 45-54.
Motin, M., Karmakar, C. Palaniswami, M. (2018)
Ensemble Empirical Mode Decomposition with
Principal Component Analysis: A Novel Approach for
Extracting Respiratory Rate and Heart Rate from
Photoplethysmographic Signal, IEEE Journal of
Biomedical and Health Informatics, v. 22, n. 3, pp. 766-
774.
Khreis, S., Ge, D., Carrault, G. (2018). Estimation of
Breathing Rate from the Photoplethysmography Using
Respiratory Quality Indexes, Proceedings of the
Computing in Cardiology Conference (CinC), pp. 1-4.
Birrenkott, D., Pimentel, M., Watkinson, P., Clifton, D.
(2018). A Robust Fusion Model for Estimating
Respiratory Rate from Photoplethysmography and
Electrocardiography, IEEE Transactions on
Biomedical Engineering, v. 65, n. 9, pp. 2033-2041.
Motin, M., Karmakar, C., Palaniswami. M. (2019). Selection
of Empirical Mode Decomposition Techniques for
Extracting Breathing Rate From PPG, IEEE Signal
Processing Letters, v. 26, n. 4, pp. 592-596.
Yang, H., Li, M., He, D., Che, X., Qin, X. (2019).
Respiratory Rate Estimation from the
Photoplethysmogram Combining Multiple
Respiratory-induced Variations Based on SQI,
Proceedings of the IEEE International Conference on
Mechatronics and Automation (ICMA), pp. 382-387.
Pollreisz D. and Nejad, N. (2020). Reliable Respiratory
Rate Extraction using PPG, Proceedings of the IEEE
Latin American Symposium on Circuits & Systems
(LASCAS), pp. 1-4.
Motin, M., Karmakar, C., Kumar, D., Palaniswami, M.,
(2020). PPG Derived Respiratory Rate Estimation in
Daily living Conditions, Proceedings of the Annual
International Conference of the IEEE Engineering in
Medicine & Biology Society (EMBC), pp. 2736-2739.
Pollreisz, D. and TaheriNejad, N. (2020). Efficient
Respiratory Rate Extraction on a Smartwatch,
Proceedings of the Annual International Conference of
the IEEE Engineering in Medicine & Biology Society
(EMBC), pp. 5988-5991.
Khreis, S., Ge, D., Rahman, H., Carrault, G. (2020).
Breathing Rate Estimation Using Kalman Smoother
with Electrocardiogram and Photoplethysmogram,
IEEE Transactions on Biomedical Engineering, v. 67,
n. 3, pp. 893-904.
Lazazzera, R. and Carrault, G. (2020). Breathing Rate
Estimation Methods from PPG Signals, on CapnoBase
Database, Proceedings of the Computing in Cardiology
(CinC), v. 47, pp. 1-4.
Kozumplik, J., Smital, L., Nemcova, A., Ronzhina, M.,
Smisek, R., Marsanova, L., Kralik, M., Vitek, M.
(2021). Respiratory Rate Estimation Using the
Photoplethysmogram: Towards the Implementation in
Wearables, Proceedings of the Computing in
Cardiology (CinC), v. 48, pp. 1-4.
Fikriastuti, N. and Muhaimin, H. (2021). Respiratory Rate
Estimations using Three Respiratory-Induced
Variations on Photoplethysmogram, Proceedings of the
International Conference on Electrical Engineering
and Informatics (ICEEI), pp. 1-6.
Protopsaltis, G., Krizea, M., Gialelis, J. (2021). Continuous
Measurement of Respiratory Rate via Single-
Wavelength Reflective Photoplethysmography,
Proceedings of the Mediterranean Conference on
Embedded Computing (MECO), pp. 1-5.
Haddad, S., Boukhayma, A., Caizzone, A. (2021). PPG-
Based Respiratory Rate Monitoring Using Hybrid
Vote-Aggregate Fusion Technique, Proceedings of the
Annual International Conference of the IEEE
Engineering in Medicine & Biology Society (EMBC),
pp. 1605-1608.
Icazatti, F., Dell’Aquila, C., Leber, E. (2021). Design and
validation of a respiratory rate estimation algorithm
based on photoplethysmography (PPG) signal,
Proceedings of the Workshop on Information
Processing and Control (RPIC), pp. 1-5.
Adami, A., Boostani, R., Marzbanrad, F., Charlton, P.
(2021). A New Framework to Estimate Breathing Rate
from Electrocardiogram, Photoplethysmogram, and
Blood Pressure Signals, IEEE Access, v. 9, pp. 45832-
45844.
Chen, M., Zhu, Q., Wu, M. and Wang, Q. (2021).
Modulation Model of the Photoplethysmography
Signal for Vital Sign Extraction, IEEE Journal of
Biomedical and Health Informatics, v. 25, n. 4, pp. 969-
977.
Bluestein, L. (1970). A linear filtering approach to the
computation of discrete Fourier transform. IEEE
Transactions on Audio and Electroacoustics, v. 18, n.
4, pp. 451-455.
Awodeyi, A., Alty, S. and Ghavami, M. (2013). Median
Filter Approach for Removal of Baseline Wander in
Photoplethysmography Signals, European Modelling
Symposium, pp. 261-264.
HEALTHINF 2023 - 16th International Conference on Health Informatics
452
