LipoPose: Adapting Cellpose to Lipid Nanoparticle Segmentation
Semanti Basu
1 a
, Peter Bajcsy
2 b
, Thomas Cleveland
2 c
, Manuel J. Carrasco
3 d
and R. Iris Bahar
4 e
1
Dept. of Computer Science, Brown University, U.S.A.
2
National Institute of Standards and Technology, U.S.A.
3
George Mason University, U.S.A.
4
Colorado School of Mines, U.S.A.
Keywords:
cryoEM, Lipid Nanoparticles, Segmentation, Dataset Creation.
Abstract:
The goal of this study is to precisely localize lipid nanoparticles (LNPs) from cryogenic electron microscopy
(cryoEM) images. LNPs found in cryoEM images are characterized by nonuniform shapes with varying
sizes and textures. Moreover, there is no publicly available training dataset for LNP segmentation/detection.
Thus, accurate supervised localization must overcome the challenges posed by heterogeneity of LNPs and
nonexistent large training datasets. We evaluate benchmarks in closely related areas such as particle-picking
and cell-segmentation in the context of LNP localization. Our experimental results demonstrate that, of the
benchmarks tested, Cellpose is the best suited to LNP localization. We further adapt Cellpose to segmentation
of heterogenous particles of unknown size distribution by introducing a novel optimization pipeline to remove
uncertainty in Cellpose’s inference diameter parameter selection. The overall workflow speeds up the process
of manually annotating LNPs by approximately 5X.
1 INTRODUCTION
Lipid nanoparticles (LNPs) are formulations used to
deliver drug substances, such as mRNA vaccines, to
target cells. Cryogenic electron microscopy (cry-
oEM) can be used to visualize LNPs when develop-
ing new formulations or evaluating formulation qual-
ity. As a first step in analyzing cryoEM data, the
LNPs must be localized from images in order to ana-
lyze attributes such as particle size and internal con-
tents. Biological cryoEM images are often charac-
terized by low signal-to-noise ratio, varying intensity
across the image, and presence of ice, debris and other
artifacts that often look similar to the nanoparticles
themselves, making detection or segmentation chal-
lenging. Moreover, LNPs do not come in well-defined
shapes or sizes, and a single cryoEM image can have
particles as small as 20 nm in diameter to as large
as 200 nm. This heterogeneity in instances belong-
a
https://orcid.org/0000-0002-3129-5265
b
https://orcid.org/0000-0002-6968-2615
c
https://orcid.org/0000-0003-1992-8450
d
https://orcid.org/0000-0002-8253-2937
e
https://orcid.org/0000-0001-6927-8527
ing to the same class (i.e., LNPs) leads to additional
difficulties in training an accurate localization model.
Also, labelled training data for cryoEM images are
currently not systematically available in a repository.
Prior work on cryoEM images has focused on
particle picking, which returns bounding polygons
around objects of interests (Wagner et al., 2019),(Be-
pler et al., 2019). However, they require the size of
particles in an image as user-input, and do not trace
the exact boundary of particles. A related problem,
Cell and nucleus segmentation is of particular interest
to us, since cells roughly resemble LNPs, and there is
sufficient variation in the shapes and sizes of differ-
ent cells, similar to LNPs. One such model, known
as Cellpose (Stringer et al., 2021), has proven to be
a powerful generalist cell segmentation algorithm for
handling a wide range of image types. However, it
has not yet been used to evaluate cryoEM images.
There are no deep-learning based algorithms
which directly address LNP localization in cryoEM
images. Therefore, we first evaluate state-of-the-art
tools for particle-picking and cell-segmentation on
cryoEM images containing these LNPs as a start-
ing point to understand how well they could localize
LNPs. From this initial analysis, we selected the best
Basu, S., Bajcsy, P., Cleveland, T., Carrasco, M. and Bahar, R.
LipoPose: Adapting Cellpose to Lipid Nanoparticle Segmentation.
DOI: 10.5220/0011726800003414
In Proceedings of the 16th International Joint Conference on Biomedical Engineering Systems and Technologies (BIOSTEC 2023) - Volume 2: BIOIMAGING, pages 115-123
ISBN: 978-989-758-631-6; ISSN: 2184-4305
Copyright
c
2023 by SCITEPRESS – Science and Technology Publications, Lda. Under CC license (CC BY-NC-ND 4.0)
115

performing tool (i.e., Cellpose) and set out to further
optimize it by designing a localization methodology
that can better handle heterogeneity in particles. We
leverage transfer learning, and use the weights of a
trained cell-segmentation model as our starting point.
Our pipelined methodology semi-automates LNP seg-
mentation so we can iteratively create more data with
less effort, which further fine-tunes our predictions.
In this work we make the following contributions:
• We evaluate three state-of-the-art particle pick-
ing and cell segmentation tools (crYOLO, Topaz,
and Cellpose) on their ability to localize hetero-
geneous LNPs from cyroEM images using a com-
mon scoring scheme. We identify Cellpose as the
best performing.
• We develop an optimization pipeline to adapt
Cellpose to segmentation of heterogenous LNPs.
• We make available a repository of annotated
cryoEM images for LNP segmentation, created it-
eratively through our pipeline and corrected by an
expert.
2 RELATED WORK
Localization of lipid nanoparticles is the first step to-
wards quantification of their properties from cryoEM
images. In (Crawford et al., 2011), a semi-automated
image characterization system is developed for cry-
oEM images. They address localization of LNPs in
terms of segmentation and use a binary threshold-
ing based method to detect LNPs, followed by the
user correcting the predictions through an interactive
tool. In cryoEM images, localization has also been
explored in terms of particle-picking. Particle picking
algorithms for cryoEM images, such as Topaz (Bepler
et al., 2019) and crYOLO (Wagner et al., 2019), are
mostly focused on picking protein structures with a
relatively uniform size.
A similar problem to nanoparticle segmentation
is cell and nucleus segmentation. Several Mask-R
CNN (He et al., 2017) based algorithms have been de-
veloped to perform cell and nucleus segmentation (Lv
et al., 2019), (Vuola et al., 2019), (Xie et al., 2019).
Semantic segmentation has been widely used in cell
segmentation. U-Net (Ronneberger et al., 2015) is a
semantic segmentation model that was developed to
deal with small training sets. U-Net is a popular ar-
chitecture used in cell/nuclei analyses (Alom et al.,
2018), (Cai et al., 2020), (Zeng et al., 2019), (Stringer
et al., 2021), (Yang et al., 2020). Cell/nuclei segmen-
tation tools usually expect uniformity across particles
in an image (Yang et al., 2020), (Stringer et al., 2021).
Cellpose (Stringer et al., 2021) was developed to
be a cell-segmentation tool which can generalize to
different kinds of cells without additional training us-
ing specialized data.
In prior work (Mullen et al., 2019), the au-
thors compare the performance of different annota-
tion types such as polygons, bounding boxes and cen-
troids. They used a pixel-wise receiver operating
characteristic (ROC) curve to evaluate performance
while we used Intersection over union (IoU) overlap
between the predicted and ground truth regions.
3 METHOD
3.1 Network Selection
3.1.1 Comparing Point, Bounding Box, and
Segment-based Methods
Topaz returns the centroid of the particles detected,
crYOLO returns bounding boxes, and Cellpose re-
turns precise masks of objects. Our goal is to perform
a fair comparison of the three methods. For Topaz,
we get the centroid of each object. During both train-
ing and extraction, Topaz requires us to provide a ra-
dius value. We compute bounding circles around the
detected centroids using the extraction radius, which
has to be known a priori, to completely localize the
particles detected by Topaz.
We received masks for LNPs from a cryoEM ex-
pert, which precisely trace the boundary of each par-
ticle. This served as our ground truth for Cellpose. To
fairly evaluate crYOLO and Topaz, we modified the
ground truth to generate bounding boxes for crYOLO
and bounding circles for Topaz.
For all three methods we have now devised a
way to obtain the estimated particle region and gen-
erated corresponding ground truth to evaluate them.
We compared the predictions from each method to
their corresponding ground truths. We calculated
the Intersection over Union (IoU) of each predicted
mask/box/circle with its corresponding ground truth
region, and considered it a true positive if the pre-
dicted region had more than 50 % overlap with the
ground truth region. This helped us quantify how well
each method fully localizes particles. We then calcu-
lated precision and recall values for each method. The
ground truth regions overlaid by the predicted regions
have been shown in Fig. 1.
BIOIMAGING 2023 - 10th International Conference on Bioimaging
116
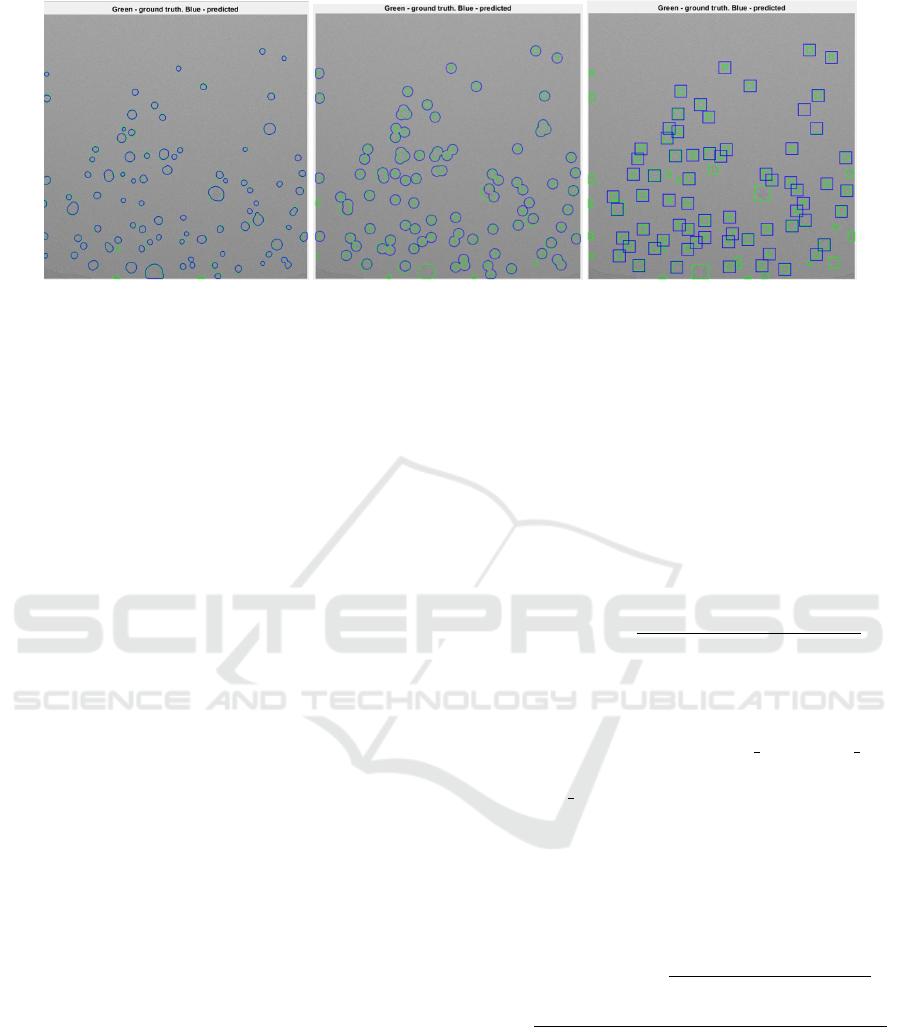
Figure 1: Ground truth (shown in green), overlaid by predicted regions (shown in blue) for Cellpose (left), Topaz (middle),
and crYOLO (right).
3.1.2 Relationship of Parameters Across
crYOLO, Topaz, and Cellpose
The user-defined parameters needed for training and
inference for each method are provided in Table 1. In
our experiments we tried 21 different combinations of
these parameters across the three methods. We eval-
uated each combination on how well they served to
localize the LNPs, as discussed earlier. The details of
these experiments have been provided in Section 4.
From our experiments, we found that Cellpose
outperformed both crYOLO and Topaz in terms of
both precision and recall. Therefore, we decided to
use Cellpose as our starting point and adapt it further
to our use-case using a novel post-processing pipeline
discussed next.
3.2 Optimization Over Diameter
Parameter for Cellpose Model
We train a Cellpose model using cryoEM images,
starting from the pre-trained model provided by Cell-
pose, called “cyto” in order to leverage transfer learn-
ing. We use the Cellpose (Stringer et al., 2021) source
code (v0.6) and commandline-interface to run train-
ing and inference. We use “cyto” as opposed to other
pre-trained models like “nuclear” because “cyto” was
trained using a wide diversity of images with varied
cell shapes, as well as certain “non-microscopy” ob-
jects such as fruits, rocks etc. (Stringer et al., 2021).
This variety would be useful in segmenting the het-
erogeneous distribution of LNPs in our dataset.
The steps after training a custom Cellpose model
are:
• Multi Inference - We run inference using multi-
ple diameter values spanning the whole range of
diameters as obtained from the training data LNP
size distribution. At this stage we have multiple
predicted masks, each for a separate inference par-
ticle diameter. These can be thought of as partial
masks which have to be strategically combined to
give a complete mask.
• Generating Confidence Map - Next, we convert
the masks to binary masks and obtain a pixelwise
confidence map. There are two different ways to
approach this:
– Averaging Approach - This involves combining
all the masks together and obtaining pixelwise
confidence scores using the following equation:
ConfMap =
(Mask
1
+ ... + Mask
n
) ∗ 100
n
(1)
It should be noted that only a few masks will
capture particles of a certain size. Therefore, no
individual pixel can be expected to have a very
high confidence value. Mask 1 and Mask 2 for
instance, will not capture the same particles as
Mask n.
– Sliding Window Approach - This involves com-
bining masks within a certain range of diameter
values, and obtaining confidence scores within
that range. The process has to be repeated until
the entire range of particle-sizes in the dataset is
covered. The following equation can be used:
ConfMap =
(Mask
1
... + Mask
k
) ∗ 100
k
+
(Mask
n−k
+ Mask
n−k−1
+ ... + Mask
n
) ∗ 100
k
(2)
Here each individual pixel will have higher
confidence scores than the previous approach.
That makes it more intuitive to the user. How-
ever, we do not know the exact size-range of
particles that will be predicted by a certain in-
ference diameter value. Therefore we cannot
predict what will be an appropriate width for
the sliding window, or the value of “k” in eq 2.
LipoPose: Adapting Cellpose to Lipid Nanoparticle Segmentation
117
Table 1: Training and Inference Parameters.
Training crYOLO Topaz Cellpose
Input Parameters needed from user BoxSize
•Expected # particles per image
•Radius of particle.
Training data format bounding boxes of all particles (x,y) center of all particles Segmentation masks
Output Bounding box (x,y) coordinate of predicted particle center Labelled mask
Inference crYOLO Topaz Cellpose
Parameters which can be adjusted Confidence threshold(0 to 1) Extraction radius Inference diameter
There is also ambiguity on how to treat particles
that are at the junction of two consecutive win-
dows. Adding or averaging confidence scores
will give a false idea. If the value of k is set
to a value too large or small, then certain par-
ticles will be in the wrong bin when the scores
are calculated, conveying a false idea.
In our approach we decided to choose the averag-
ing approach over the sliding window approach. It
is more straightforward and has no unknown vari-
able that needs to be estimated.
• Merging Masks from Multiple Thresholds -
The confidence map is queried at multiple thresh-
olds and the results are iteratively merged. For
merging, we start with the higher confidence par-
ticles, then add more particles from the lower con-
fidence masks, but only if they have no overlap
with the particles already added. The particles are
extracted by performing a connected component
analysis of the mask, and overlap between objects
is established by calculating the Intersection over
Union (IoU) for the two. The merging process
is shown in Algorithm 1. For example, we fil-
ter the confidence map at a starting threshold of
x %. This means, we remove all pixels which had
less than x % confidence score. Now we add the
objects from the filtered confidence map, all of
which have ≥ x % confidence, to the final mask.
Next, we filter the confidence map at a threshold
of y %, such that y < x. We add these new particles
into the final mask if and only if they do not over-
lap with the higher confidence particles already
added. We can continue this process of filtering
and merging for as low a threshold as we want.
The results at various stages of merging have been
shown in Fig. 3.
Algorithm 1: Merging masks from two thresholds.
procedure MERGEMASKS(confmap,thHi,thLow)
MaskHi ← con f map(thHi)
MaskLow ← con f map(thLow)
ObjInMaskHi ← ConnComp(MaskHi)
ObjInMaskLow ← ConnComp(MaskLow)
mergedMask ← MaskHi
for all ob jLow ∈ Ob jInMaskLow do
for all ob jHi ∈ Ob jInMaskHi do
if iou(ob jLow, ob jHi)! = 0 then
Flag ← 1
break
end if
end for
if Flag == 1 then
continue
else
mergedMask ← mergedMask +
ob jLow
end if
end for
return mergedMask
end procedure
The overall flow of our process is shown in Fig. 2.
4 EXPERIMENTAL RESULTS
4.1 Data Description and Preparation
We used our own dataset of 38 cryoEM images for
our experiments. Of these, 31 were used for training
and the rest for testing. Each image is 4096 x 4096
pixels in size and has a resolution of 2.22
˚
A/pixel.
The LNPs were prepared as described in (Carrasco
et al., 2021). To prepare samples for imaging, 3
µL of LNP formulation was applied to holey carbon
grids (Quantifoil, R3.5/1, 200 mesh copper). Grids
were then incubated for 30 s at 25 °C and 100 % hu-
midity before blotting and plunge-freezing into liquid
ethane using a Vitrobot Mark IV (Thermo Fisher Sci-
entific). Grids were imaged at 200 kV using a Talos
BIOIMAGING 2023 - 10th International Conference on Bioimaging
118
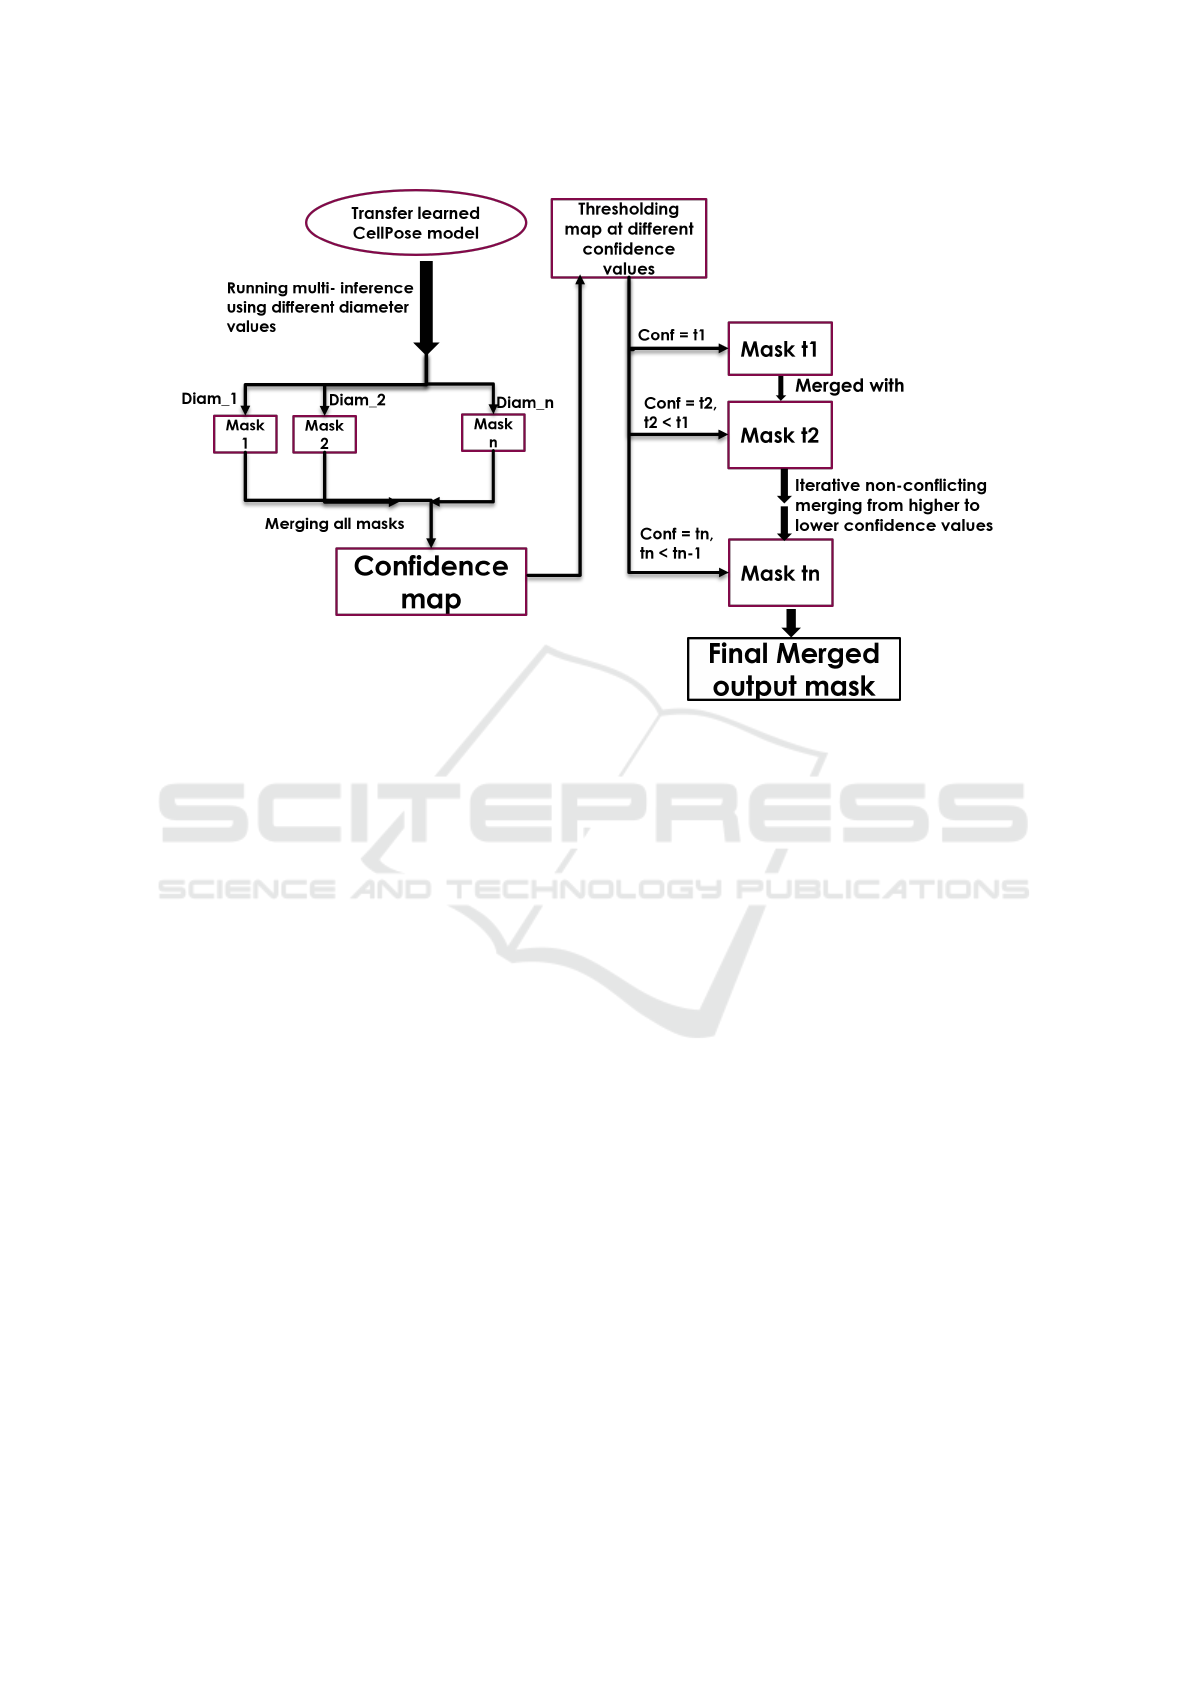
Figure 2: Overall training pipeline flow to obtain an optimal mask.
Arctica system equipped with a Falcon 3EC detector
(Thermo Fisher Scientific). A nominal magnification
of 45,000x was used, corresponding to images with a
pixel count of 4096x4096 and a calibrated pixel spac-
ing of 0.223 nm. Micrographs were collected as dose-
fractionated “movies” at nominal defocus values be-
tween -1 and -3 µm, with 10 s total exposures con-
sisting of 66 frames with a total electron dose of 120
e/
˚
A
2
. Movies were motion-corrected using Motion-
Cor2 (Zheng et al., 2017), resulting in flattened mi-
crographs suitable for downstream particle segmenta-
tion.
The LNP boundaries in the micrographs were
traced by a cryoEM expert using ROI segmentation
tools in the software Fiji (Schindelin et al., 2012),
to generate an initial set of ground-truth masks for
segmentation. Then using our pipeline several more
masks for LNPs were produced which were corrected
by the expert and added to the training repository. The
final set of images and their corresponding masks can
be found here: https://doi.org/10.18434/mds2-2753.
4.2 Initial Comparison of Cellpose,
Topaz and crYOLO
Several models were trained using different combina-
tions of parameters mentioned in Table 1 and tested
on 7 previously unseen test images.
For Cellpose, we set inference diameter to three
different values - the median diameter, the 25th per-
centile diameter and the 75th percentile diameter val-
ues. For crYOLO, we trained three different models
with the boxsize parameter set to the median (149),
the mean(184), and the 25th percentile (117) respec-
tively. For each of these models, confidence of predic-
tion threshold was set to 0.1, 0.3 and 0.5 respectively.
For Topaz, the expected number of particles per
image was fixed at 55. Since our training data is fully
annotated, this number was known apriori. We trained
three different models with the radius parameter set
to slightly less than the median, the 25th percentile
and the 75th percentile radii values respectively (ac-
cording to guidelines). For particle extraction after
training, the same three radii values were provided for
each model.
From Fig. 4 and Fig. 5, we can see that Cellpose
outperforms crYOLO (all models) in terms of both
precision and recall. In Fig. 6 and Fig. 7, we can
see that Cellpose outperforms all models of Topaz
in terms of recall. In terms of precision, a particu-
lar model of Topaz is comparable to Cellpose, how-
ever Cellpose has a better recall. Overall Cellpose is
the clear winner so, we chose Cellpose as our starting
point for developing a new pipeline flow for localiz-
ing LNPs.
LipoPose: Adapting Cellpose to Lipid Nanoparticle Segmentation
119
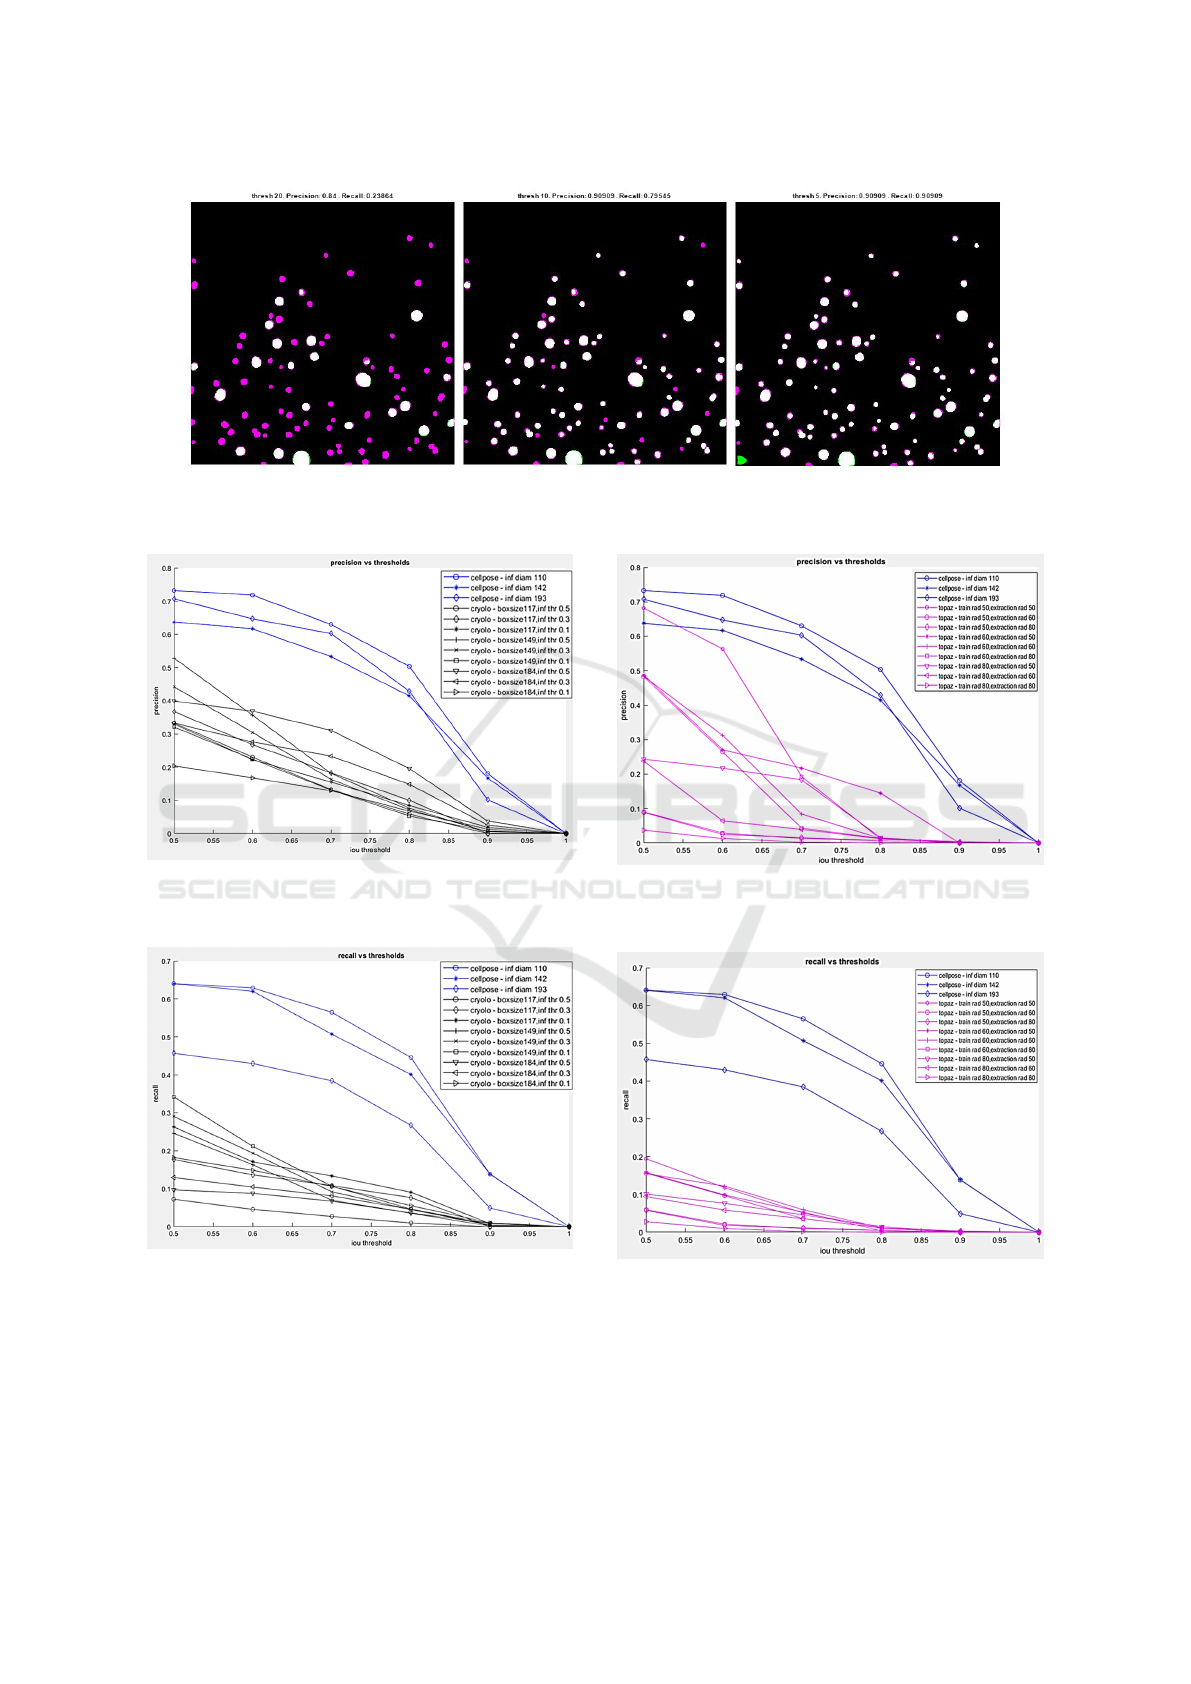
Figure 3: False negatives (magenta), True positives (white), False positives (green) at different stages of iterative merging
from threshold 20 to threshold 0. Left-most image is the result at threshold 20, the middle is the result when merged until
threshold 10, and rightmost is when we merge until threshold 5.
Figure 4: Precision(y-axis) vs IoU threshold (x-axis) for
different parameter combinations of Cellpose (in blue) and
crYOLO (in black).
Figure 5: Recall(y-axis) vs IoU threshold (x-axis) for differ-
ent parameter combinations of Cellpose (in blue) and crY-
OLO (in black).
4.3 Comparison of Cellpose Before and
After Optimization
In this section we note the results from the post-
processing pipeline. We have already determined that
Figure 6: Precision(y-axis) vs IoU threshold (x-axis) for
different parameter combinations of Cellpose (in blue) and
Topaz (in magenta).
Figure 7: Recall(y-axis) vs IoU threshold (x-axis) for differ-
ent parameter combinations of Cellpose (in blue) and Topaz
(in magenta).
Cellpose performs better than crYOLO and Topaz.
Now we show how the post-processing pipeline
adapts Cellpose to heterogenous data. Since we have
a relatively small dataset - we perform 5 fold cross-
BIOIMAGING 2023 - 10th International Conference on Bioimaging
120

validation. We train 5 different Cellpose models for
the 5 splits. Each Cellpose model is trained start-
ing from the pre-trained model ’cyto’ provided by the
Cellpose package. Then we use three different infer-
ence diameter values (sampled from the training set
to represent small, medium and large sized LNPs) to
record the performance of the transfer learned model
on our test dataset before using the pipeline.
Next we perform the steps in our pipeline, and
merge until different values of threshold ranging from
a high of 20 to a low of 0. We record how the per-
formance varies and compare to the values obtained
before post-processing. The results can be found in
Fig. 8, where we record the average precision and
recall across 5-folds when using Cellpose before and
after using the pipeline.
5 DISCUSSION
We evaluate standard benchmarks in cryoEM image
analysis and closely related areas in the context of
LNP localization, to test how well they handle hetero-
geneity in particle size distribution. To do so, we had
to compare different annotation and prediction styles.
We have a small dataset of 38 images of which
approximately 80 % were used for training and 20 %
for testing. Although the number of images is rela-
tively low, the number of particles used for training is
at par with other benchmarks used in cryoEM analy-
sis. We use an average of 1641 particles to train our
model. The authors of crYOLO state that 200–2500
particles are sufficient to train their model (Wagner
et al., 2019). Similarly, Topaz was evaluated on parti-
cle picking of the Toll Receptor protein using a model
that was trained on 686 labeled particles (Bepler et al.,
2019). Of the benchmarks tested, Cellpose outper-
formed both Topaz and crYOLO. However, applying
Cellpose to our data is not unambiguous because it re-
quires the median diameter at inference - a datapoint
we do not know a priori. Moreover, the median diam-
eter might not be the right choice if the particle size
distribution is skewed towards smaller or larger parti-
cles.
To standardize inference while using Cellpose on
segmentation of non-uniform particles, we introduce
an optimization pipeline which allows the user to op-
timize for precision or recall specifically. The goal
of the optimization pipeline to remove the guesswork
from selecting the correct inference diameter when
there is heterogeneous size distribution of particles.
In Fig. 8, our cross-validation results show that there
is no predictability in using just Cellpose without our
pipeline. The horizontal lines represent precision and
recall values when using Cellpose with different infer-
ence diameters. Across different folds, no consistent
relationship can be observed between inference diam-
eter used and corresponding precision and recall.
In contrast, if our optimization pipeline is used,
the precision value trends downwards from a high to
a low threshold while the recall value trends upwards.
The initial threshold, from which the merging process
begins, can be set by the user. It depends on the fre-
quency at which multi-inference was done. We sam-
pled diameters at every ∼ 5 pixels. We found that
a threshold of above 20 returns a blank mask or very
few particles; therefore, we used 20 as a starting point.
If denser sampling is performed, such as every 2 pix-
els, then the user should consider setting the initial
threshold to a value higher than 20. For more sparse
sampling, the initial threshold can be set to be lower
than 20. A high initial threshold will simply result in
a few masks that are empty but should not affect the
merging results. The final threshold value chosen for
merging will affect the results. By choosing a very
low threshold such as 0 or 1, we can optimize for re-
call while choosing a higher threshold such as 15 or
20 allows us to optimize for precision. If we want
to strike a balance between the two, we can choose
a value in the middle such as 5 or 8. The precision
values for higher thresholds are sometimes low be-
cause the starting threshold might have been too high
and not enough particles were captured or more false
positives than true positives were picked up at that
stage. Since the total number of predictions are lower
at higher confidence thresholds, we opted for sparsely
sampled merging thresholds at the start,increasing the
density as we moved lower. The intermediate thresh-
old values to be used can be set by the user.
The correlation between threshold and precision
and recall provides clear intuition to the user as to
which value to use based on their use case. In Fig. 8
it can be observed that on average, merging until the
lowest threshold improves recall by 6.8 % from 0.59
(when using just Cellpose with median diameter for
inference) to 0.63. Similarly, the precision improves
by 4.1 % from 0.73 (when using just Cellpose with
median diameter for inference) to 0.76 (when using
the pipeline).
Our workflow was used by a cryoEM expert to
semi-automate boundary annotation of LNPs in cry-
oEM images. He was able to generate annotations for
5X more particles per hour when using the pipeline.
In future we hope to leverage our large repository
of unlabeled data through semi-supervised learning.
We also hope to extend our analysis to localize the
mRNA which resides within LNPs.
LipoPose: Adapting Cellpose to Lipid Nanoparticle Segmentation
121
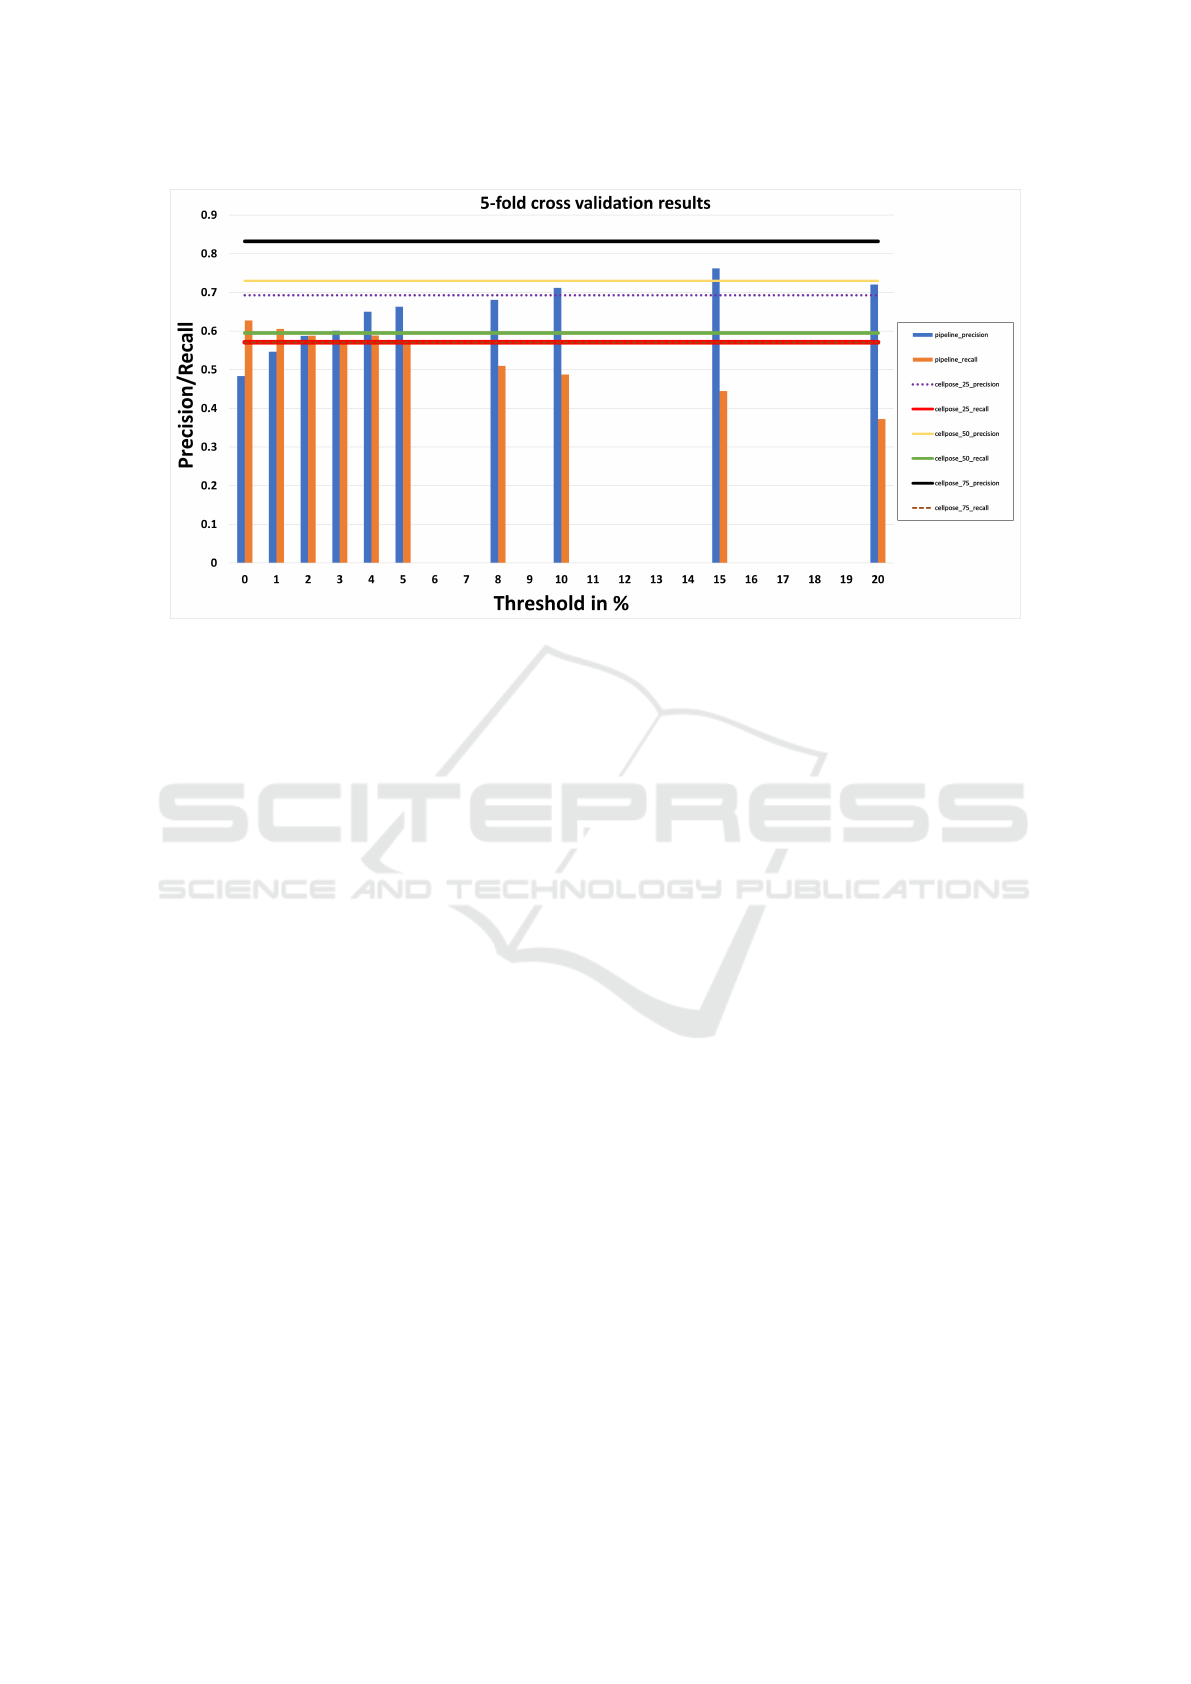
Figure 8: Average of k-fold cross validation results on using Cellpose with the pipeline (the vertical bars) and without (the
horizontal lines). The blue bar represents precision at different merging thresholds when using the pipeline, and the orange
bar represents recall. The top 3 lines represent precision when using just Cellpose with different inference diameters, and the
bottom three lines represent recall.
6 DISCLAIMER
Certain commercial equipment, instruments, materi-
als, suppliers or software are identified in this paper to
foster understanding. Such identification does not im-
ply recommendation or endorsement by the National
Institute of Standards and Technology, nor does it im-
ply that the materials or equipment identified are nec-
essarily the best available for the purpose.
ACKNOWLEDGEMENTS
We would like to thank the late Dr. Michael D.
Buschmann, who was a collaborating PI on this
project. His lab produced the LNP samples which we
used to collect the cryoEM images that were analyzed
in our work.
REFERENCES
Alom, M. Z., Yakopcic, C., Taha, T. M., and Asari, V. K.
(2018). Nuclei segmentation with recurrent resid-
ual convolutional neural networks based u-net (r2u-
net). In NAECON 2018-IEEE National Aerospace and
Electronics Conference, pages 228–233. IEEE.
Bepler, T., Morin, A., Rapp, M., Brasch, J., Shapiro,
L., Noble, A. J., and Berger, B. (2019). Positive-
unlabeled convolutional neural networks for particle
picking in cryo-electron micrographs. Nature meth-
ods, 16(11):1153–1160.
Cai, S., Tian, Y., Lui, H., Zeng, H., Wu, Y., and Chen,
G. (2020). Dense-unet: a novel multiphoton in vivo
cellular image segmentation model based on a con-
volutional neural network. Quantitative imaging in
medicine and surgery, 10 6:1275–1285.
Carrasco, M. J., Alishetty, S., Alameh, M.-G., Said, H.,
Wright, L., Paige, M., Soliman, O., Weissman, D.,
Cleveland, T. E., Grishaev, A., and Buschmann, M. D.
(2021). Ionization and structural properties of mRNA
lipid nanoparticles influence expression in intramus-
cular and intravascular administration. Communica-
tions Biology, 4(956).
Crawford, R., Dogdas, B., Keough, E., Haas, R. M.,
Wepukhulu, W., Krotzer, S., Burke, P. A., Sepp-
Lorenzino, L., Bagchi, A., and Howell, B. J. (2011).
Analysis of lipid nanoparticles by Cryo-EM for char-
acterizing siRNA delivery vehicles. International
Journal of Pharmaceutics, 403(1):237–244.
He, K., Gkioxari, G., Doll
´
ar, P., and Girshick, R. (2017).
Mask R-CNN. In Proceedings of the IEEE interna-
tional conference on computer vision, pages 2961–
2969.
Lv, G., Wen, K., Wu, Z., Jin, X., An, H., and He, J. (2019).
Nuclei R-CNN: Improve mask R-CNN for nuclei seg-
mentation. In 2019 IEEE 2nd International Confer-
ence on Information Communication and Signal Pro-
cessing (ICICSP), pages 357–362.
Mullen, J. F., Tanner, F., and Sallee, P. (2019). Comparing
the effects of annotation type on machine learning de-
tection performance. 2019 IEEE/CVF Conference on
BIOIMAGING 2023 - 10th International Conference on Bioimaging
122

Computer Vision and Pattern Recognition Workshops
(CVPRW), pages 855–861.
Ronneberger, O., Fischer, P., and Brox, T. (2015). U-net:
Convolutional networks for biomedical image seg-
mentation. In International Conference on Medical
image computing and computer-assisted intervention,
pages 234–241. Springer.
Schindelin, J., Arganda-Carreras, I., Frise, E., Kaynig, V.,
Longair, M., Pietzsch, T., Preibisch, S., Rueden, C.,
Saalfeld, S., Schmid, B., Tinevez, J.-Y., White, D.,
Hartenstein, V., Eliceiri, K., Tomancak, P., and Car-
dona, A. (2012). Fiji: An open-source platform for
biological-image analysis. Nature methods, 9:676–82.
Stringer, C., Wang, T., Michaelos, M., and Pachitariu, M.
(2021). Cellpose: a generalist algorithm for cellular
segmentation. Nature Methods, 18(1):100–106.
Vuola, A. O., Akram, S. U., and Kannala, J. (2019). Mask-
RCNN and U-net ensembled for nuclei segmenta-
tion. In 2019 IEEE 16th International Symposium
on Biomedical Imaging (ISBI 2019), pages 208–212.
IEEE.
Wagner, T., Merino, F., Stabrin, M., Moriya, T., Antoni,
C., Apelbaum, A., Hagel, P., Sitsel, O., Raisch, T.,
Prumbaum, D., Quentin, D., Roderer, D., Tacke, S.,
Siebolds, B., Schubert, E., Shaikh, T., Lill, P., Gatso-
giannis, C., and Raunser, S. (2019). Sphire-cryolo is
a fast and accurate fully automated particle picker for
cryo-em. Communications Biology, 2:218.
Xie, X., Li, Y., Zhang, M., and Shen, L. (2019). Robust
segmentation of nucleus in histopathology images via
mask r-cnn. In Crimi, A., Bakas, S., Kuijf, H., Key-
van, F., Reyes, M., and van Walsum, T., editors, Brain-
lesion: Glioma, Multiple Sclerosis, Stroke and Trau-
matic Brain Injuries, pages 428–436, Cham. Springer
International Publishing.
Yang, L., Ghosh, R. P., Franklin, J. M., Chen, S., You, C.,
Narayan, R. R., Melcher, M. L., and Liphardt, J. T.
(2020). Nuset: A deep learning tool for reliably sep-
arating and analyzing crowded cells. PLoS computa-
tional biology, 16(9):e1008193.
Zeng, Z., Xie, W., Zhang, Y., and Lu, Y. (2019). RIC-Unet:
An improved neural network based on unet for nu-
clei segmentation in histology images. Ieee Access,
7:21420–21428.
Zheng, S. Q., Palovcak, E., Armache, J., Verba, K. A.,
Cheng, Y., and Agard, D. A. (2017). Motioncor2:
anisotropic correction of beam-induced motion for
improved cryo-electron microscopy. Nature Methods,
14:331–332.
LipoPose: Adapting Cellpose to Lipid Nanoparticle Segmentation
123
