
Fixed Tasks for Continuous Authentication via Smartphone
Vincenzo Gattulli , Donato Impedovo , Tonino Palmisano and Lucia Sarcinella
Department of Computer Science, University of Studies of Bari “Aldo Moro”, Via Edoardo Orabona, 4, 70125 Bari, Italy
Keywords: Android Smartphone, Machine Learning, Fixed Tasks, Shallow Learning, Continuous Authentication.
Abstract: Mobile devices feature a variety of knowledge-based authentications such as PINs, passwords, and lock
sequences. The weakness of these approaches is that once leaked and/or intercepted, the control over the
device is lost and no more authentication steps are required. In this paper, the efficiency of a set of ML
algorithms in authenticating users is evaluated with the aim of understanding which are the best tasks to use
by submitting Fixed Tasks, which simulate the use of a device in daily life, through Touch Behaviour and
motion sensors installed in the device itself. Next, a social problem is posed, in which an attempt is made to
understand whether a group of subjects at a trial performed the assigned tasks correctly without permitting
other people to do them instead.
1 INTRODUCTION
Nowadays, smartphones can suffer multiple attacks
on the user's privacy. Mobile devices are used for
economic transactions, storing personal data, and
using social media (Vaishnav et al., 2022). As it is
well known, smartphones are protected by a password
or a simple PIN or face. For example, one of the most
widely used techniques is biometrics (Zaidi et al.,
2021)(Lamb et al., n.d.), through techniques such as
Face Recognition of the face to access the device. The
main problem with these techniques is that they are
performed only at the device's entry point (upon
unlocking) and then give complete access to the
information. There is a way around this problem:
Continuous Authentication techniques (Abuhamad et
al., 2021)(Lamb et al., n.d.). There are two modes of
Authentication, one static and one continuous (Zaidi
et al., 2021):
• Static: In this case, the user authenticates at login
or after a specific time. Passwords, PINs, unlock
sequences, fingerprints, and face recognition are
used here;
• Continuous: the user is authenticated pseudo-
continuously over time. The term pseudo-
continuous is used because Authentication, due
to resource and battery consumption issues, does
not correctly occur continuously but at regular
intervals. This mode turns out to be transparent,
nonintrusive, and user-friendly. Touch-Based
Authentication comes into play through
Continuous Authentication approaches, allowing
users to recognize how they interact with the
smartphone screen.
The idea behind this work stems from an in-depth
study conducted on a type of spyware installed on the
devices of victims who, without their knowledge, are
spied on. Generally, this type of software, also called
stalker ware, is installed by an illegitimate user who
somehow possesses the access keys of the legitimate
user's device (PIN, password, unlock-co
sequence...)(Chan, 2021; Han et al., 2021). One of the
most common attacks in the authentication domain is
observational attacks: the attacker observes the
victim's behavior and tries to imitate it to gain
illegitimate access to the device. Authentications such
as PINs, passwords, and unlocking sequences are
subject to two types of observational attacks (Ku &
Park, n.d.)(Lamb et al., n.d.)(Zaidi et al.,
2021)(Vaishnav et al., 2022):
• Shoulder-surfing: in this case, the attacker
observes the victim "from over his shoulder" and
tries to figure out his access key by observing the
victim's movements. Of course, this is not always
done directly but can also be done through video
recordings without the victim's consent;
• Smudge-attack: this type of attack is prevalent
with mobile devices, given the presence of the
display. Here the attacker tries to deduce the key
by observing the fat traces that fingers leave on
the screen (Aviv et al., 2010).
Gattulli, V., Impedovo, D., Palmisano, T. and Sarcinella, L.
Fixed Tasks for Continuous Authentication via Smartphone.
DOI: 10.5220/0011718300003411
In Proceedings of the 12th International Conference on Pattern Recognition Applications and Methods (ICPRAM 2023), pages 905-913
ISBN: 978-989-758-626-2; ISSN: 2184-4313
Copyright
c
2023 by SCITEPRESS – Science and Technology Publications, Lda. Under CC license (CC BY-NC-ND 4.0)
905

Behavioral biometric data can be acquired being the
user unconsciously while using the device. This
technique has the advantage of having a lower cost,
as no additional hardware is needed (in fact, sensors
already present on the devices are used), and being
less invasive, the user can more readily accept them.
As a final important aspect, they can be used for
continuous control, which takes place in the
background without the user's knowledge and without
harming usability and User Experience (Matyáš &
Říha, 2010).
The acquisition of raw data can be made according to
two methodologies:
• Fixed Tasks: users are required to perform a
specific task using certain fingers or he/she is
required to complete specific actions with a
given screen orientation.
• Open Tasks: users can use the device without
any constraints.
It has been observed that predefined fixed tasks
tend to perform better than free open tasks because
they involve more stable and less unpredictable
movements (Zaidi et al., 2021).
In this work, Touch data and smartphone sensor
data were retrieved from two different Android
smartphone applications. The two experiments were
placed in the Fixed Task category. In the first
experimentation, it was verified through EER and
AUC curves whether the tasks designed in the first
application are used to authenticate a user. The
second experimentation adds a social side with a
second Android application that extracts the same raw
data as the previous one, and it is intended to try to
understand whether the single questionnaire was
completed by one person or by several people at the
same time, given the issue adopted in the
questionnaire namely bullying and cyberbullying.
The goal of the following article is to test the
efficiency of a set of ML algorithms (mentioned
above) using the application's predefined tasks and
trying to figure out which tasks work best. The social
objective is to the subjects of a questionnaire, for the
classification of bullying and cyberbullying, are they
who filled out the questionnaire. This paper is
structured as follows: The second chapter called "2.
State of the Art" discusses the literature regarding
Touch Dynamics. The third chapter called "3.
Material" deals with the description of the datasets
that will be used for the Dataset First Experiment and
Dataset Second Experiment. The fourth chapter
called "4. Methods" deals with the models used for
the classification phase. The fifth chapter called "5.
Experimental Setup" deals with the pipeline of the
experiment performed. The sixth chapter called "6.
Results" reports the results of the experiment with
attached observations. Finally, conclusions are given
in chapter "7. Conclusion".
2 STATE OF THE ART
Lamb et al. (Lamb et al., n.d.) explore the concept of
observational attracts by implementing a
noncontinuous, swipe-based authentication method
performed within a banking application. They then
experimented with Blind-Attackers and Shoulder-
Surfers to see how Swipe Behaviour may or may not
affect the outcome of these attacks. As classifiers,
they use Bayesian models, particularly Shrunk
Covariance, Bayesian Multivariance Gaussian, and
Infinite Gaussian Mixture, reporting ERRs ranging
from 4.54% to 15.70%, depending on the classifier
used. Vaishnav et al (Vaishnav et al., 2022)
developed a framework called KDSmart (Keystroke
Dynamics Smart) for the Android system. It consists
of three phases: Registration, Login, and Final Test
Phase. Using this method, they achieved an FRR of
6.73% and a FAR of 1.66% for a resulting EER of
4.1%. Ku et al (Ku & Park, n.d.) implemented an
application allowing users to access their mobile
devices using a public unlock pattern. The concept is
to make the pattern visible to anyone and authenticate
the user using touch behaviors. The goal is to avoid
observational attacks. The classifiers used are
Decision Tree, Support Vector Machine, k-Nearest
Neighbor, Gaussian Naive Bayes, Random Forest,
and Logistic Regression. An EER of 2.66% was
reported for tasks performed while sitting, 3.53% on
tasks performed while walking, and 5.83% on a
combination of the above. Frank et al. (Frank et al.,
2013) introduced 30 different features that could be
used in the context of continuous authentication.
They monitored only simple movements such as up-
down and left-right swipes. Their results were an
average EER of 0% for intra-session authentications,
between 2% and 3% in inter-session authentications,
and 4% for all sessions done after the enrollment
phase. Levi et al. (Levi et al., 2022) identified a
framework capable of creating, through behavioral
feature extraction, global models capable of
identifying each user in a system but avoiding sharing
other users' data as in the case of binary classifiers.
Their method achieved an AUC of 91.8% and an EER
of 15.6%. Incel et al. (Incel et al., 2021) developed a
system called DAKOTA capable of recording user
behavior within a banking application. Using a binary
SVM classifier with an RBF kernel, they achieved a
ICPRAM 2023 - 12th International Conference on Pattern Recognition Applications and Methods
906

minimum EER of 3.5% and a TPR of 90%. Estrela et
al. (Estrela et al., 2021) created a continuous
authentication system based on bio-touch for a
banking application, an area where observational
attacks are more frequent. They proposed a
framework capable of achieving an EER between
9.85% and 1.88% for static verifications such as login
and post-login.
3 MATERIAL
The first/second experiments share the problem of
continuous authentication but have a different
semantic nature. The first experiment aims to better
characterize the task type and thus understand which
task may be more discriminating and which may be
less discriminating in authenticating an individual.
The second experiment is useful to understand
whether the individual questionnaire was completed
by one person or by several people at once, given the
issue adopted in the questionnaire namely bullying
and cyberbullying. The dataset of the first experiment
was created through an Android application
implemented to collect touch and smartphone sensor
data and includes the implementation of three tap,
swipe, and zoom tasks (3.1 Dataset First
Experiment). The dataset of the second experiment
was created through another Android application,
different from the previous one, which implements a
questionnaire aimed at understanding people's
attitudes about bullying and cyberbullying, and touch
and smartphone sensor features were extrapolated.
Two experiments aimed at authentication and fixed
tasks.
3.1 Dataset First Experiment
This dataset concern 6 users as the work (Reichinger
et al., 2021). The tasks implemented in the first
Android application required to be performed while
using mobile devices are tap, swipe, and zoom
(Mottelson & Hornbæk, 2016).
1. Tap: In this Task, the user must click 15 keys,
plus an initial one not considered. The 15 keys
are arranged circularly, and the user must click
them consecutively. Apart from data previously
mentioned, the following ones are acquired too:
• x and y coordinates of the user's tap;
• pressure;
• number of the key is clicked;
• coordinates of the center of the keys;
• dimensions of the key (height and length).
2. Swipe (or slide): In this case, the user is asked to
drag a dot from the starting position inside a
yellow square. In this case, the application
returns also:
• the task number;
• the start and end coordinates of the slide;
• the velocities on the various points of the
movement on the x and y axes;
• the pressure on the various points of the
movement.
3. Zoom-in (scale): This Task involves zooming in
on the inner circle with two fingers, making it
into the gray area. This case is like the previous
one, but data are acquired for two fingers, each
identified by an id.
3.2 Dataset Second Experiment
In the second Android application, the touch and
sensor smartphone activities of 89 users who filled
out a questionnaire for the classification of bullying
and cyberbullying were collected. In this
questionnaire, there are buttons (5 Likert scales) and
open-ended questions that could characterize the
individual's attitude as a bully or victim of bullying,
the same for cyberbullying.
Two different sessions were conducted on
different days with different users but the same
android application and the same questionnaire. The
sum of the users in the two sessions is 89. The datasets
will be available after publication.
4 METHODS
The following of the most widely used state-of-the-
art classifiers on this topic were considered for both
experiments:
• Support Vector Machine (SVM): Generally,
nonlinear kernels, such as polynomials, are going
to be used, which permits higher performance for
separation between two classes as in this case
(Zaidi et al., 2021). SVM has been frequently
used in continuous authentication tasks (Frank et
al., 2013)(Kumar et al., 2018)(Chang et al.,
2018);
• k-Nearest Neighbours (k-NN): This can be a
good solution, but it is likely to lose effectiveness
when maneuvering a lot of data where it is
needed to compare a test datum with all features
in a training set (Zaidi et al., 2021). Used by
(Frank et al., 2013; Incel et al., 2021);
Fixed Tasks for Continuous Authentication via Smartphone
907
• Decision Tree (DT): The leaves of the tree, on
the other hand, rap-present the decision made,
i.e., to which of the two classes a given test class
instance belongs (Zaidi et al., 2021). Used by
(Incel et al., 2021; Zhou et al., 2016);
• Random Forest (RF): This classifier is always
based on decision trees. It contains nDTs. During
the training phase, multiple DTs are randomly
generated, while in the testing phase, the class to
which a test instance belongs is the one that is
returned by the various DTs (Zaidi et al., 2021).
Used by (Smith-Creasey & Rajarajan,
2019)(Incel et al., 2021b)
Generally, the performance of a biometric system is
measured in terms of FAR (False Acceptance Rate,
also called FPR, False Positive Rate) and FRR (False
Rejection Rate, also called FNR, False Negative
Rate). The FAR allows one to understand the
percentage of test samples misplaced as positive,
while the FRR shows the percentage of samples that
are mistakenly recognized as false. These values,
however, reflect the behavior of the system only for a
specific acceptance threshold value, so that for
generalization aims, the ROC curve (Receiver
Operating Characters) has been here considered,
which shows the TPR (True Positive Rate, where TPR
= 1 - FNR) about the FPR for each possible
acceptance threshold value. Through this curve,
another metric arises, which is the AUC (Area Under
the Curve), which is the area below the ROC curve.
The closer this area is to 1, the better the performance
of the model. This is because if the curve is projected
upward to the left, it means that with a low threshold,
could have low FPR and high TPR. Another very
useful metric is EER (Equal Error Rate), which is
nothing but the value where FAR and FRR are equal.
This is a widely used metric to compare results with
other studies.
5 EXPERIMENTAL SETUP
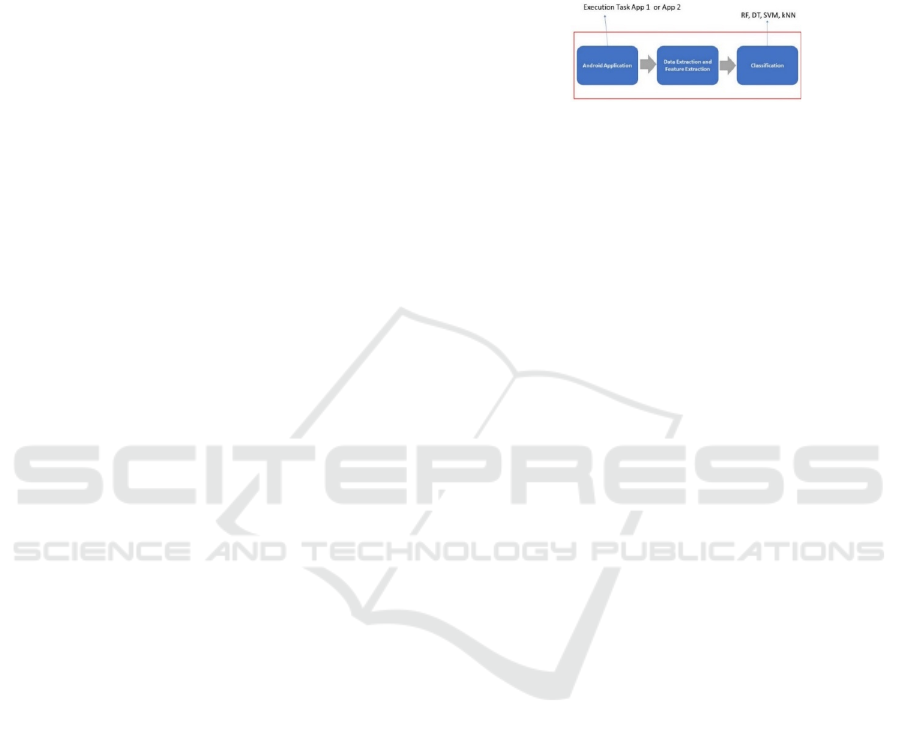
The workflow is structured as follows (Figure 1):
• Android Application: Android Application 1 is
useful for the first experiment. In the first android
application, the three different tasks namely: are
tap, swipe, and zoom are implemented; Android
application 2 useful for the second
experimentation. In the second android
application the questionnaire performed by the
89 users is implemented;
• Data Extraction and Feature Extraction: The
Data Extraction phase deals with transforming
the raw data obtained from the mobile device into
a table format-oriented data manipulation. In
addition, different features were extracted for the
two datasets, described later;
• Classification: The most popular state-of-the-art
classifiers are used in this phase.
Figure 1: Workflow.
5.1 Android Application
The following raw data have been acquired for the
two Datasets:
• ACTION_DOWN_<TASK_NAME>: indicates
the start of an interaction with the screen and in
its values returns the x and y coordinates, the
press, the task number, and in the case of the tap
the coordinate of the center of the button and its
size in pixels;
• ACTION_UP_<TASK_NAME >: task number
and x and y coordinates of end of movement;
• ACTION_MOVE_<NAME- TASK >: task
number, finger id, speed of movement on as-se x
and y, coordinates of the instant of movement,
pressure, and surface;
• ACTION_POINTER_DOWN_<NAME- TASK
>: same as ACTION_DOWN but with finger id;
• ACTION_POINTER_UP_<NAME- TASK >:
like ACTION_UP but with the finger id;
• ACCELEROMETER: value read from the
accelerometer in terms of x, y, and z coordinates;
• GYROSCOPE: value read from the gyroscope in
terms of x, y, and z coordinates;
• MAGNETOMETER: value read from the
magnetometer in terms of x, y, and z coordinates.
The first Dataset Experiment is created with this data
capture. The data capture was done through the use of
an application that uses a background service called
KeyloggerService (which is responsible for keeping
track of all open apps, any text string keystrokes,
selected menu items, the raw data from embedded
sensors, etc.) and an AccessibilityService (created to
assist users with disabilities, this service receives a
call when AccessibilityEvents are created, which in
turn allow the user to capture any interaction with the
interface: key press, text entry, etc.). When the app
opens, it allows the user to give the necessary
permissions to allow the background services to
function properly. Once permissions have been
ICPRAM 2023 - 12th International Conference on Pattern Recognition Applications and Methods
908

obtained, the test can be started by clicking the Next
button, and immediately afterward the user is
informed about how the experiment is being carried
out. Then the training phase begins, in which the user
tries out all the tasks as he or she must perform them
in the actual experiment. The sequence of tasks is, as
mentioned above: 15 taps, 4 slides, and 4 zooms.
When the actual phase begins, the user is carefully
notified. Once the test is finished, the user can click
on the "Quit" button, which terminates the test.
The second dataset experiment was created with
this similar data acquisition, but with a different
Android application. This Android application
implements a questionnaire designed to understand
people's attitudes toward bullying and cyberbullying,
and the touch and sensor functions of the smartphone
were extracted.
5.2 Feature Extraction
In the first Experiment Dataset, the features have been
computed starting from raw data previously
described. Each task has its engineered features as
described below.
Tap:
• Precision (px), Pressure (p), Duration (ms),
Acceleration (m/s
2
), Rotation (rad/s),
MagneticField (Asp/m).
Swipe:
• Precision (px), AvgXSpeed (px/ms), AvgYSpeed
(px/ms), AvgPressure,
xMedianSpeedOfLast5Points (px/ms) (Frank et
al., 2013), yMedianSpeedOfLast5Points (px/ms)
(Frank et al., 2013), Duration (ms),
AvgAcceleration (m/s
2
), AvgRotation (rad/s),
AvgMagneticField (Asp/m)
Zoom:
• CenterDistanceXf0 (px), AvgXSpeedf0 (px/ms),
AvgYSpeedf0 (px/ms), AvgPressuref0 (px/ms),
xMedianSpeedOfLast5Pointsf0 (px/ms) (Frank et
al., 2013), yMedianSpeedOfLast5Pointsf0
(px/ms) (Frank et al., 2013), Durationf0,
AvgAccelerationf0 (m/s2), AvgRotationf0
(rad/s), AvgMagneticFieldf0 (Asp/m).
Where f
0
refers to the first finger that touched the
screen this is repeated for the second finger, which is
labeled f
1
.
• AllTask: In this case, there is the union of all
tasks. For each user, all instances of the various
tasks should be entered, i.e., all instances of the
slide (24 in total), plus all instances of the zoom
(also 24), plus 24 instances of the tap, to be
chosen randomly from the 90 available.
After the experimentation:
• The data for 15 taps × 6 users × 6 intakes = 540
taps;
• The data related to 4 slides × 6 users × 6 intakes
= 140 slides;
• The data for 4 zoom-ins × 6 users × 6 intakes =
140 zoom-ins.
In the second Dataset Experiments are extracted this
Feature Extraction is:
• Coordinates (x, y) of tap, Pressure, Surface
(mm
2
), Duration (ms), Acceleration (m/s
2
),
Rotation (rad/s), MagneticField (Asp/m).
More features have not been calculated because data
are referred to as generic gestures which remain
mostly unknown. In addition, information such as the
initial coordinates is also used (Reichinger et al.,
2021). The following detail is like the two
experiments: Being features in different ranges, data
normalization has been performed by adopting the
Min Max scaler. This scaler takes care of bringing all
the data into the range of [0,1] and to do, so, it sets the
feature with the largest value equal to 1 and the
feature with the smallest value equal to 0. This will
all be tested by Machine Learning algorithms defined
in Chapter "4. Methods".
6 RESULTS
This section reports results obtained in the different
experiments, and the graphs inherent in the
experiments performed, each illustration has the
following abbreviations (lx: far left-graph, clx:
center-left graph, crx: center-right graph, rx: far-
right graph).
6.1 First Experiment
The Results have been computed considering
different gestures: tap, swipe, zoom in, and finally, a
combination of the three tasks. Note that each curve
represents a user. For each task, a distinction is drawn
based on the trained model, and, in the observations,
the best performance is considered, thus the highest
AUC and the lowest EER.
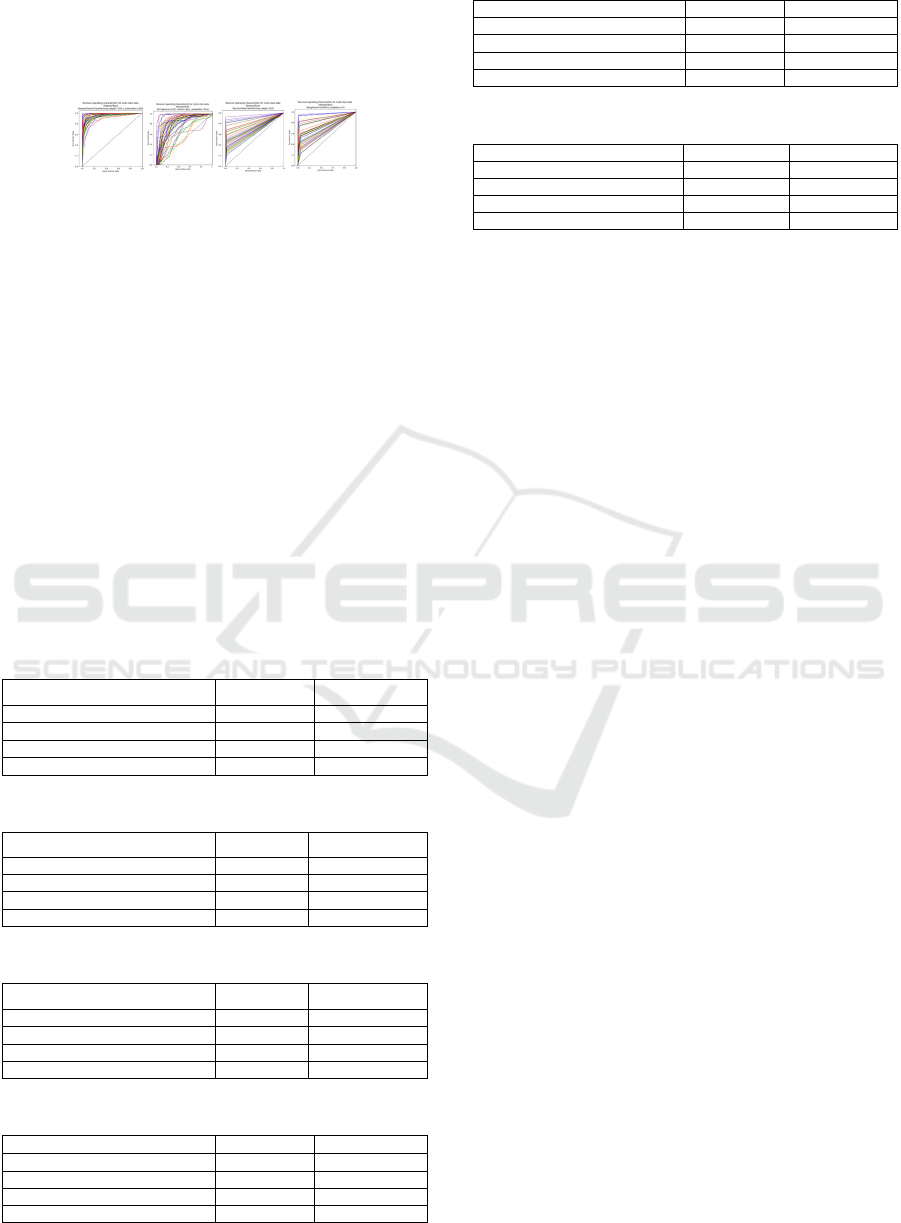
6.1.1 Tap
Figure 2: Tap task (lx RF, clx SVM, crx DT, rx Knn).
Fixed Tasks for Continuous Authentication via Smartphone
909

Figure 2 (lx) shows a curve just above the diagonal
with a maximum AUC of 83% and an EER of
24.22%. In Figure 2 (clx), the SVM is the worst-
performing classifier, with a ROC curve that medially
lies below the diagonal, an AUC of 49%, and an EER
of 40%. In Figure 2 (crx) there are fair but not good
results, with relatively low EER (10.22%) but AUC
of 60%. In Figure 2 (rx), on the other hand, there are
similar results to DT, with a maximum AUC of 75%
and an EER of 26.44%. As was expected, the Tap task
is the one that performed worst (see successive results
for more comparison), as the gesture in question has
little discrimination. It can be said that the classifier
that performed the highest was Random Forest, with
a maximum AUC of 83% and a minimum EER of
24.22%. The poor performance is also evident from
the trend of the curve, which is much shifted toward
the diagonal of the quadrant.
6.1.2 Swipe
Figure 3: Swipe task (lx RF, clx SVM, crx DT, rx Knn).
Figure 3 (lx) reports a maximum AUC of 100% and a
minimum EER of 0%. Also, in Figure 3 (clx) the
SVM performed worse, obtaining an AUC of 53%
and an EER of 45%. In Figure 3 (crx) there are clear
improvements over the tap, with AUC of 88% and
EER of 3.33%. In Figure 3 (rx) the situation is also
better than the tapping task, with an AUC of 99% and
an EER of 5%. Once again, RF is the best, and in this
case a projected curve was seen in the upper left
corner, just the expected result. The swipe had higher
performance than the tap, this is because, as a
movement, it allows the use of more characteristics
that allow for better discrimination. With RF, an AUC
of 100% and an EER of 0% were obtained. kNN also
performed very well with an AUC of 99% and an
EER of 5%.
6.1.3 Zoom-in
Figure 4: Zoom-in task (lx RF, clx SVM, crx DT, rx Knn).
In Figure 4 (lx), excellent performance was obtained
with an AUC of 100% and an EER of 3.33%. Also, in
Figure 4 (clx) the SVM found an AUC of 53% and
EER of 42.5%. In Figure 4 (crx) other discrete results
were noted for this DT with an AUC of 89% and an
EER of 4.17%. In Figure 4 (rx), the kNN again
performs very well with an AUC of 99% and an EER
of 3.33%. The Zoom-in also performed very well,
with the RF achieving an AUC of 100% and an EER
of 3.33%, and with the kNN achieving an AUC of
99% and an EER of 3.33%.
6.1.4 All-Tasks
Figure 5: All tasks (lx RF, clx SVM, crx DT, rx Knn).
In Figure 5 (lx) the RF performs to its all-time
maximum with an AUC of 100% and an EER of 0%.
In Figure 5 (clx) the SVM still shows problems
consistent with the previous ones, with an AUC of
52% and an EER of 45%. In Figure 5 (crx) discrete
results are observed here with an AUC of 88% and an
EER of 3.33%. In Figure 5 (rx), excellent results are
also noted here, with an AUC of 99% and an EER of
2.5%. The combination of the features of the various
tasks led to a very high performance, which is evident
in the RF with an AUC of 100% and an EER of 0%.
But the kNN also performed very well with an AUC
of 99% and an EER of 2.5%.
6.2 Second Experiment
For the following experiment, the ROC curve is
calculated on the two feature files obtained for each
Test, each curve representing one user. For each test,
a distinction was made according to the model
trained. Session 1 and Session 2 cover the same
questionnaire but with different users a different time.
The sum of the users in Session 1 and Session 2 is 89
users.
6.2.1 Session 1
Figure 6: Session1 (lx RF, clx SVM, crx DT, rx Knn).
In Figure 6 (lx) the RF is confirmed to be the best
performing, with a maximum AUC of 100% and
minimal EER of 0%. In Figure 6 (clx) the SVC tends
to perform slightly better here, but only with some
users, for others, it still gets low results. In Figure 6
(crx), compared to the first experiment, the DT has
lost a little performance but only in terms of AUC, as
ICPRAM 2023 - 12th International Conference on Pattern Recognition Applications and Methods
910
the EERs still turn out to be very low. Also, in Figure
6 (rx), for some users, the performance is very low,
but only in terms of AUC.
6.2.2 Session 2
Figure 7: Session2 (lx RF, clx SVM, crx DT, rx Knn).
In Figure 7 (lx) the same applies to RF, which is the
one that performs best here as well. In Figure 7 (clx)
the SVC performed worse than Session 1, and it is
evident from the trend of the various curves. In Figure
7 (crx), the DT remains consistent with what it
accredited in Session 1. In Figure 7 (rx), the kNN is
consistent with Session 1, with low average
performance. With these two tests, useful
confirmations were sought for the first experiment.
As usual, the RF had very high performance, while
the one with lower performance was the SVM, which
was also found in the first experiment. In addition, in
the second experimentation, it could be considered
that the data collected were from free tasks, and
therefore obtaining these kinds of results (with the RF
a maximum AUC of 100% and a minimum EER of
0%) is more than excellent.
Table 1: First Experiment Tap task.
Model AUC (%) EER (%)
RandomForest 78 29.6
DecisionTree 62 12.52
kNearestNeighbors 69 29.41
Su
pp
ortVectorMachine 48 50
Table 2: First Experiment Swipe task.
Model AUC (%) EER (%)
RandomForest 97 10.13
DecisionTree 77 7.49
kNearestNeighbors 93 11.8
Su
pp
ortVectorMachine 52 46.8
Table 3: First Experiment Zoom-in task.
Model AUC (%) EER (%)
RandomForest 97 9.44
DecisionTree 77 7.78
kNearestNei
g
hbors 89 14.01
Su
pp
ortVectorMachine 52 46.25
Table 4: First experiment AllTask.
Model AUC (%) EER (%)
RandomForest 99 2.64
DecisionTree 80 6.67
kNearestNei
g
hbors 96 6.66
Su
pp
ortVectorMachine 51 47.78
Table 5: Second Experiment Session 1.
Model AUC (%) EER (%)
RandomForest 95 10.54
DecisionTree 71 1.19
kNearestNei
g
hbors 72 3.81
Su
pp
ortVectorMachine 78 27.46
Table 6: Second Experiment Session 2.
Model AUC (%) EER (%)
RandomForest 96 9.77
DecisionTree 74 1.21
kNearestNeighbors 76 3.83
Su
pp
ortVectorMachine 79 25.2
7 CONCLUSIONS
This paper dealt with the problem of continuous
authentication. Two Datasets were extracted from
two Android applications and two experiments were
created. The goal was to find the best task for the first
experiment and observe whether the uniqueness of
filling out the bullying questionnaire could be
inferred in the second experiment. For the first
experiment look at Tables 1, 2, 3, and 4 and
summarize the results for the tasks of tap, scroll,
zoom and their combination respectively. RF was
always the classifier with the best performance.
Furthermore, it can be concluded that the best-
performing task is the combined task (AllTask),
which sees the features of all tasks combined and
achieves an average AUC of 99% and an EER of
2.64% with RF. When considered alone, the tapping
task is the least performing task. For the second
experiment given the good performance of
DecisionTree in terms of EER, it can be inferred that
the users who filled out the questionnaires were
always the same and therefore, most likely, there was
no switching of devices during the experiment (Table
5-6). In addition, the average best-performing model
was RF and DT, as can be seen in Table 5-6. It would
be appropriate to create an application that would
allow the models tested here to be used for user
identification. Since these are binary-type models, it
would be necessary to create a system that would also
allow other users' data to be shared among the various
authentication devices anonymously, to train the
various models in use. After that, one can decide
whether to have this application work continuously or
not, that is, whether to have the user authenticate once
or continuously and completely invisibly in the
background (the second case is the most interesting).
Another thing that could be done is to go and verify
that this type of authentication is effective against
observational attacks, such as those mentioned at the
Fixed Tasks for Continuous Authentication via Smartphone
911

beginning. It would be useful, for example, to create
groups of three individuals of which one is the victim,
one is an attacker carrying out an observational
attack, and the other is an attacker attempting to
access/use the device(s) without having previously
observed the user. Another interesting aspect could be
to go and test other models and see if they have lower
performance than those already obtained. In the
future, it may be useful to test with one-class
algorithms and a larger data set.
ACKNOWLEDGMENTS
This work is supported by the Italian Ministry of
Education, University, and Research within the
PRIN2017 - BullyBuster project - A framework for
bullying and cyberbullying action detection by
computer vision and artificial intelligence methods
and algorithms.
REFERENCES
Abuhamad, M., Abusnaina, A., Nyang, D., & Mohaisen, D.
(2021). Sensor-Based Continuous Authentication of
Smartphones’ Users Using Behavioral Biometrics: A
Contemporary Survey. IEEE Internet of Things
Journal, 8(1), 65–84. https://doi.org/10.1109/
JIOT.2020.3020076
Aviv, A. J., Gibson, K., Mossop, E., Blaze, M., & Smith, J.
M. (2010). Smudge attacks on smartphone touch
screens. 4th USENIX Workshop on Offensive
Technologies, WOOT 2010.
Chan, S. (2021). Hidden but deadly: Stalkerware usage in
intimate partner stalking. Introduction To Cyber
Forensic Psychology: Understanding The Mind Of The
Cyber Deviant Perpetrators, 45–66. https://
doi.org/10.1142/9789811232411_0002
Chang, I., Low, C. Y., Choi, S., & Teoh, A. B. J. (2018).
Kernel deep regression network for touch-stroke
dynamics authentication. IEEE Signal Processing
Letters, 25(7), 1109–1113. https://doi.org/10.1109/
LSP.2018.2846050
Estrela, P. M. A. B., Albuquerque, R. de O., Amaral, D. M.,
Giozza, W. F., & de Sousa Júnior, R. T. (2021). A
framework for continuous authentication based on
touch dynamics biometrics for mobile banking
applications. Sensors, 21(12). https://doi.org/10.
3390/S21124212
Frank, M., Biedert, R., Ma, E., Martinovic, I., & Song, D.
(2013). Touchalytics: On the applicability of
touchscreen input as a behavioral biometric for
continuous authentication. IEEE Transactions on
Information Forensics and Security, 8(1), 136–148.
https://doi.org/10.1109/TIFS.2012.2225048
Han, Y., Roundy, K. A., & Tamersoy, A. (2021). Towards
Stalkerware Detection with Precise Warnings. ACM
International Conference Proceeding Series, 957–969.
https://doi.org/10.1145/3485832.3485901
Incel, O. D., Gunay, S., Akan, Y., Barlas, Y., Basar, O. E.,
Alptekin, G. I., & Isbilen, M. (2021a). DAKOTA:
Sensor and Touch Screen-Based Continuous
Authentication on a Mobile Banking Application. IEEE
Access, 9, 38943–38960. https://doi.org/10.1109/
ACCESS.2021.3063424
Incel, O. D., Gunay, S., Akan, Y., Barlas, Y., Basar, O. E.,
Alptekin, G. I., & Isbilen, M. (2021b). DAKOTA:
Sensor and Touch Screen-Based Continuous
Authentication on a Mobile Banking Application. IEEE
Access, 9(99), 38943–38960. https://doi.org/10.1109/
ACCESS.2021.3063424
Ku, Y., & Park, L. H. (n.d.). Draw It As Shown: Behavioral
Pattern Lock for Mobile User Authentication.
https://doi.org/10.1109/ACCESS.2019.2918647
Kumar, R., Kundu, P. P., & Phoha, V. v. (2018).
Continuous authentication using one-class classifiers
and their fusion. 2018 IEEE 4th International
Conference on Identity, Security, and Behavior
Analysis, ISBA 2018,
2018-January, 1–8.
https://doi.org/10.1109/ISBA.2018.8311467
Lamb, P., Millar, A., & Fuentes, R. (n.d.). Swipe Dynamics
as a Means of Authentication: Results From a Bayesian
Unsupervised Approach.
Levi, M., Hazan, I., Agmon, N., & Eden, S. (2022).
Behavioral embedding for continuous user verification
in global settings. Computers & Security, 119, 102716.
https://doi.org/10.1016/J.COSE.2022.102716
Matyáš, V., & Říha, Z. (2010). Security of biometric
authentication systems. 2010 International Conference
on Computer Information Systems and Industrial
Management Applications, CISIM 2010, 19–28.
https://doi.org/10.1109/CISIM.2010.5643698
Mottelson, A., & Hornbæk, K. (2016). An affect detection
technique using mobile commodity sensors in the wild.
UbiComp 2016 - Proceedings of the 2016 ACM
International Joint Conference on Pervasive and
Ubiquitous Computing, 781–792. https://doi.org/
10.1145/2971648.2971654
Reichinger, D., Sonnleitner, E., Kurz, M., & Duque, R.
(2021). Continuous Mobile User Authentication Using
Combined Biometric Traits. https://doi.org/10.3390/
app112411756
Smith-Creasey, M., & Rajarajan, M. (2019). A novel word-
independent gesture-typing continuous authentication
scheme for mobile devices. Computers & Security, 83,
140–150. https://doi.org/10.1016/J.COSE.2019.02.001
Vaishnav, P., Kaushik, M., & Raja, L. (2022).
DESIGN AN ALGORITHM FOR CONTINUOUS
AUTHENTICATION ON SMARTPHONE
THROUGH KEYSTROKE DYNAMICS AND
TOUCH DYNAMICS. Indian Journal of Computer
Science and Engineering, 13(2), 444–455. https:
//doi.org/10.21817/INDJCSE/2022/V13I2/221302111
Zaidi, A. Z., Chong, C. Y., Jin, Z., Parthiban, R., & Sadiq,
A. S. (2021). Touch-based continuous mobile device
ICPRAM 2023 - 12th International Conference on Pattern Recognition Applications and Methods
912

authentication: State-of-the-art, challenges and
opportunities. Journal of Network and Computer
Applications, 191. https://doi.org/10.1016/J.JNCA.
2021.103162
Zhou, L., Kang, Y., Zhang, D., & Lai, J. (2016).
Harmonized authentication based on ThumbStroke
dynamics on touch screen mobile phones. Decision
Support Systems, 92, 14–24. https://doi.org/
10.1016/J.DSS.2016.09.007.
Fixed Tasks for Continuous Authentication via Smartphone
913
