
Convolutional Networks Versus Transformers:
A Comparison in Prostate Segmentation
Fernando V
´
asconez
1 a
, Maria Baldeon Calisto
2 b
, Daniel Riofr
´
ıo
1 c
, Zhouping Wei
3
and Yoga Balagurunathan
3
1
Colegio de Ciencias e Ingenier
´
ıas “El Polit
´
ecnico”, Universidad San Francisco de Quito, Campus Cumbay
´
a,
Casilla Postal 17-1200-841, Quito, Ecuador
2
Departamento de Ingenier
´
ıa Industrial and Instituto de Innovaci
´
on en Productividad y Log
´
ıstica CATENA-U.S.A.FQ,
Colegio de Ciencias e Ingenier
´
ıas, Universidad San Francisco de Quito, Diego de Robles s/n y V
´
ıa Interoce
´
anica, Quito,
Ecuador 170901, Ecuador
3
Department of Machine Learning, H. Lee Moffit Cancer Center, Tampa, FL, U.S.A.
Keywords:
Prostate Segmentation, Deep Learning, Transformers, Fully Convolutional Networks, Residual U-Net,
UNETR.
Abstract:
Prostate cancer is one of the most common types of cancer that affects men. One way to diagnose and treat it
is by manually segmenting the prostate region and analyzing its size or consistency in MRI scans. However,
this process requires an experienced radiologist, is time-consuming, and prone to human error. Convolutional
Neural Networks (CNNs) have been successful at automating the segmentation of the prostate. In particular,
the U-Net architecture has become the de-facto standard given its performance and efficacy. However, CNNs
are unable to model long-range dependencies. Transformer networks have emerged as an alternative, obtaining
better results than CNNs in image analysis when a large dataset is available for training. In this work, the
residual U-Net and the transformer UNETR are compared in the task of prostate segmentation on the ProstateX
dataset in terms of segmentation accuracy and computational complexity. Furthermore, to analyze the impact
of the size of the dataset, four training datasets are formed with 30, 60, 90, and 120 images. The experiments
show that the CNN architecture has a statistical higher performance when the dataset has 90 or 120 images.
When the dataset has 60 images, both architectures have a statistical similar performance, while when the
dataset has 30 images UNETR performs marginally better. Considering the complexity, the UNETR has 5×
more parameters and takes 5.8× more FLOPS than the residual U-Net. Therefore, showing that in the case of
prostate segmentation CNNs have an overall better performance than Transformer networks.
1 INTRODUCTION
Cancer is the second most common cause of death
in the United States of America (USA), taking the
life of 1 in every 4 people. It is caused by a defect
in the control mechanism of the cells which includes
survival, proliferation and differentiation (Katzung,
2017). Furthermore, it is an expensive disease that in
the USA costs an average of $123,400,000 annually
for medical services and medications (Yabroff et al.,
2021). Prostate cancer is the second most frequent
type of cancer in men (Rawla, 2019a). It is more
likely to appear at older ages, and is hard to detect
a
https://orcid.org/0000-0002-4879-9320
b
https://orcid.org/0000-0001-9379-8151
c
https://orcid.org/0000-0001-9815-2659
because it has no symptoms until it is in advanced
stages. This is why screening is usually recommended
for men after turning 45 and at the start of any symp-
tom (Rawla, 2019b).
Many methods have been developed to screen for
prostate cancer, such as prostate-specific antigen test
(PSA), Direct Rectal Examination (DRE), transrectal
biopsy, and magnetic resonance imaging (MRI) anal-
ysis (Eklund et al., 2021). Although, there is no con-
sensus on the test that should be applied to a patient,
it is common to use the PSA or DRE (Eldred-Evans
et al., 2020). However, both have their disadvantages.
On one hand, PSA values could be affected by medi-
cations, medical procedures, prostate infection or en-
larged prostate (Centers for Disease Control and Pre-
vention, 2022). Meanwhile, DRE may result in a high
600
Vásconez, F., Baldeon Calisto, M., Riofrío, D., Wei, Z. and Balagurunathan, Y.
Convolutional Networks Versus Transformers: A Comparison in Prostate Segmentation.
DOI: 10.5220/0011717600003393
In Proceedings of the 15th International Conference on Agents and Artificial Intelligence (ICAART 2023) - Volume 3, pages 600-607
ISBN: 978-989-758-623-1; ISSN: 2184-433X
Copyright
c
2023 by SCITEPRESS – Science and Technology Publications, Lda. Under CC license (CC BY-NC-ND 4.0)

number of false positives that could lead to an un-
necessary biopsy, over-diagnosis, and over-treatment
(Naji et al., 2018).
Screening through prostate MRI analysis has
gained popularity because it allows to identify ar-
eas suggestive of cancer and improves the accuracy
of the diagnosis (Eklund et al., 2021). Furthermore,
MRI provides images with higher resolution, an in-
creased soft tissue contrast, and better motion correc-
tion (Ehman et al., 2017). However, MRI analysis is
time-consuming, subjective, and prone to human er-
ror. Moreover, the diagnosis may differ between ex-
perts (Razzak et al., 2017).
Deep learning has improved the analysis of med-
ical data by integrating enormous amounts of het-
erogeneous data for diagnosis and disease recogni-
tion (Lundervold and Lundervold, 2019). In the
area of medical image analysis, Convolutional Neu-
ral Networks (CNNs) are the most popular architec-
tures in deep learning due to their astonishing results
on object recognition and segmentation (Calisto and
Lai-Yuen, 2021). CNNs extract features from data
by applying convolutional operations, whose weights
are automatically learned through training (Li et al.,
2021).
In the task of image segmentation, Fully Convo-
lutional Networks (FCN) have become the dominant
structure. The FCN architecture consists of two sym-
metric paths, an encoder and a decoder. The encoder
is a contracting path that extracts the most impor-
tant image features for the task, while the decoder is
an expanding path that extracts positions while up-
sampling the feature maps into the original size of the
image. Various architectures based on the FCN struc-
ture have been implemented for prostate segmenta-
tion, such as the U-Net (Ronneberger et al., 2015), Z-
Net (Zhang et al., 2019), PSNet (Tian et al., 2018),
AdaEn-Net (Calisto and Lai-Yuen, 2020), Residual
U-Net (Kerfoot et al., 2019), Densenet-like U-net (Al-
doj et al., 2020), and Hybrid 3D-2D U-Net (Ushinsky
et al., 2021). Even though CNNs have obtained an
exceptional performance, they struggle at capturing
long-range information because of the regional local-
ity of convolutional operations and its poor scaling
properties (Ramachandran et al., 2019).
In Natural Language Processing (NLP), Trans-
formers have become the algorithm of choice be-
cause of their computational efficiency and scala-
bility. Moreover, Transformers implement a global
self-attention mechanism that highlights the impor-
tant features from the input word sequence (Chen
et al., 2021). Transformers have also been success-
fully implemented in image processing by splitting
an image into sequential patches (Dosovitskiy et al.,
2020). In computer vision, Transformers can model
highly-localized features through the self-attention
modules, capturing the visual token interactions (Wu
et al., 2020). Transformers architectures developed
for the task of medical image segmentation include
the TransU-Net (Chen et al., 2021), TransBTSV2
(Li et al., 2022), Swin UNETR (Hatamizadeh et al.,
2022), RTNet (Huang et al., 2022), and UNETR
(Hatamizadeh et al., 2021).
The main difference between CNNs and Trans-
formers in computer vision applications is the way
they analyze image data. CNNs learn the feature rep-
resentations of images by applying convolution ker-
nels at different stages (Gu et al., 2018). Trans-
formers, on the other hand, encode the images as a
sequence of 1D patch embeddings and utilize self-
attention modules to focus on the most important
patches (Hatamizadeh et al., 2021). This allows
Transformers to capture with ease the global context.
Transformers have shown to outperform CNNs in
computer vision tasks where large datasets are avail-
able. However, given their learning over-flexibility,
Transformers have a tendency of overfitting small
datasets. Considering that in medical scenarios ac-
quiring labelled datasets can be quite costly and time-
consuming, it is indispensable to test their predictive
performance in small datasets.
In this work, the Transformer UNETR
(Hatamizadeh et al., 2021) and the CNN resid-
ual U-Net (Kerfoot et al., 2019) are compared for
the task of prostate MRI segmentation in terms of
segmentation accuracy and computational complex-
ity. The prostate MRI dataset from the PROSTATEx
challenge is divided into four datasets with 30, 60,
90, and 120 images, and the performance of the
two networks evaluated using the metrics of the
dice similarity coefficient, jaccard, and 95 hausdorff
distance. The results show that the residual U-Net
has a statistical higher performance than the UNETR
when the dataset has 90 or 120 images. When
the dataset has 60 images, both architectures have
a statistical similar performance, while when the
dataset has 30 images UNETR performs marginally
better. However, the difference in performance is
small in all experiments, in all cases being less than
1.5% in terms of the dice coefficient. Considering
the network complexity, the UNETR has 5× more
parameters and takes 5.8× more FLOPS than the
residual U-Net. Therefore, showing that in the case
of prostate segmentation CNNs have an overall better
performance than Transformer networks.
Convolutional Networks Versus Transformers: A Comparison in Prostate Segmentation
601
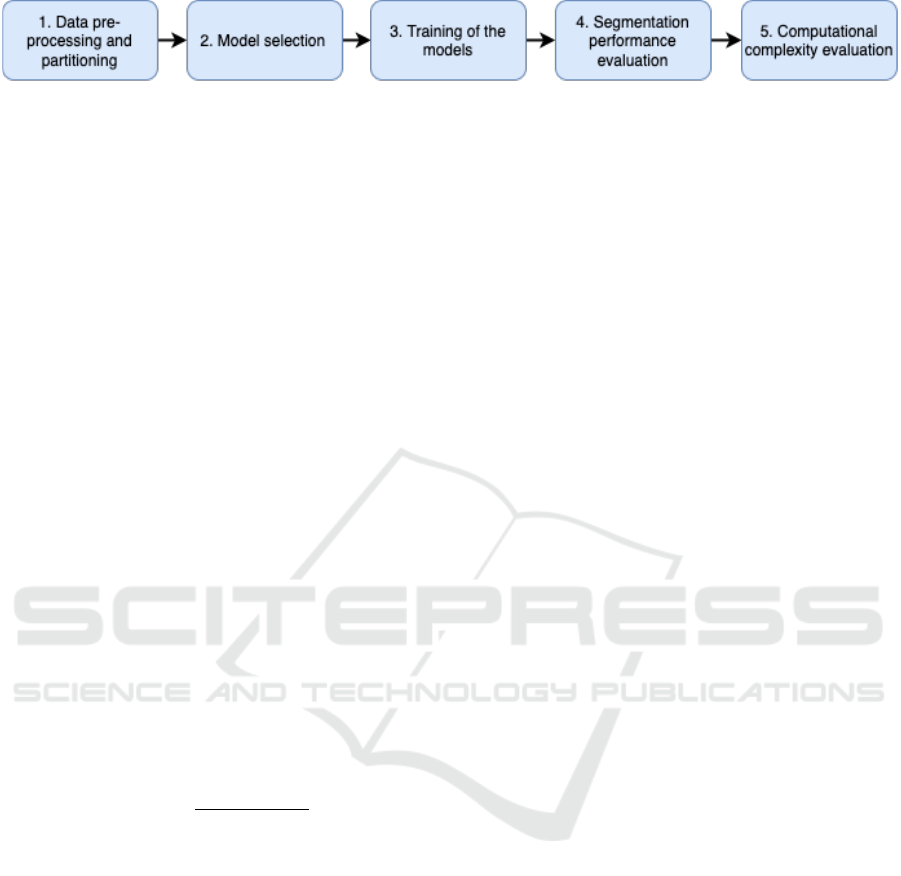
Figure 1: Comparison Metholodogy.
2 MATERIALS AND METHODS
The residual U-Net and UNETR are compared using
a five-step approach as presented in Fig. 1. Each step
is detailed next.
2.1 Dataset Pre-Processing and
Partitioning
The experiments are performed on a prostate MRI
dataset from the 2017 PROSTATEx Challenge (Rad-
boud University Medical Centre, 2017). It consists
of 150 volumetric MRI images from different pa-
tients. Images vary in sizes from (320 × 320 × 18) to
(640 × 640 × 27), with an inter-slice resolution rang-
ing from (0.3mm × 0.3mm) to (0.6mm × 0.6mm),
and intra-slice resolution between 3mm to 4.5mm.
The data has been acquired from two different types
of Siemens scanners: the MAGNETOM Trio and
Skyra. The aim is the segmentation of the prostate
gland, which has been annotated by expert radiolo-
gists from Moffit Cancer Center. Each image is read,
transposed, and casted into 32 bit float. Pixel values
are normalized to a maximum value of 1 and a mini-
mum value of 0 through a pixel-wise linear transfor-
mation, as shown in Eq. 1.
O = (I − I
min
) ×
(O
max
− O
min
)
I
max
− I
min
+ O
min
(1)
Where O is the output pixel, I is the pixel to be
normalized, I
min
is the minimum pixel value in the
image, and I
max
is the maximum pixel value in the
image. Finally, the O
max
is 1 and O
min
is 0 to obtain a
normalization between [0-1].
Moreover, the images of the dataset are rescaled
to a (0.5mm, 0.5mm, 1.5mm) voxel spacing using
a B-spline interpolation from the Simpleitk library.
Finally, images are center cropped to the size of
(256 × 256 × 32).
The dataset is divided using a 5-fold cross-
validation scheme, where 120 images are assigned for
training and 20 images for testing. Moreover, to eval-
uate the influence of the size of the dataset, the train-
ing dataset is further randomly divided into 30, 60,
90, and 120 images. Hence, creating for each fold 4
training datasets whose validation dataset remains the
same.
2.2 Models
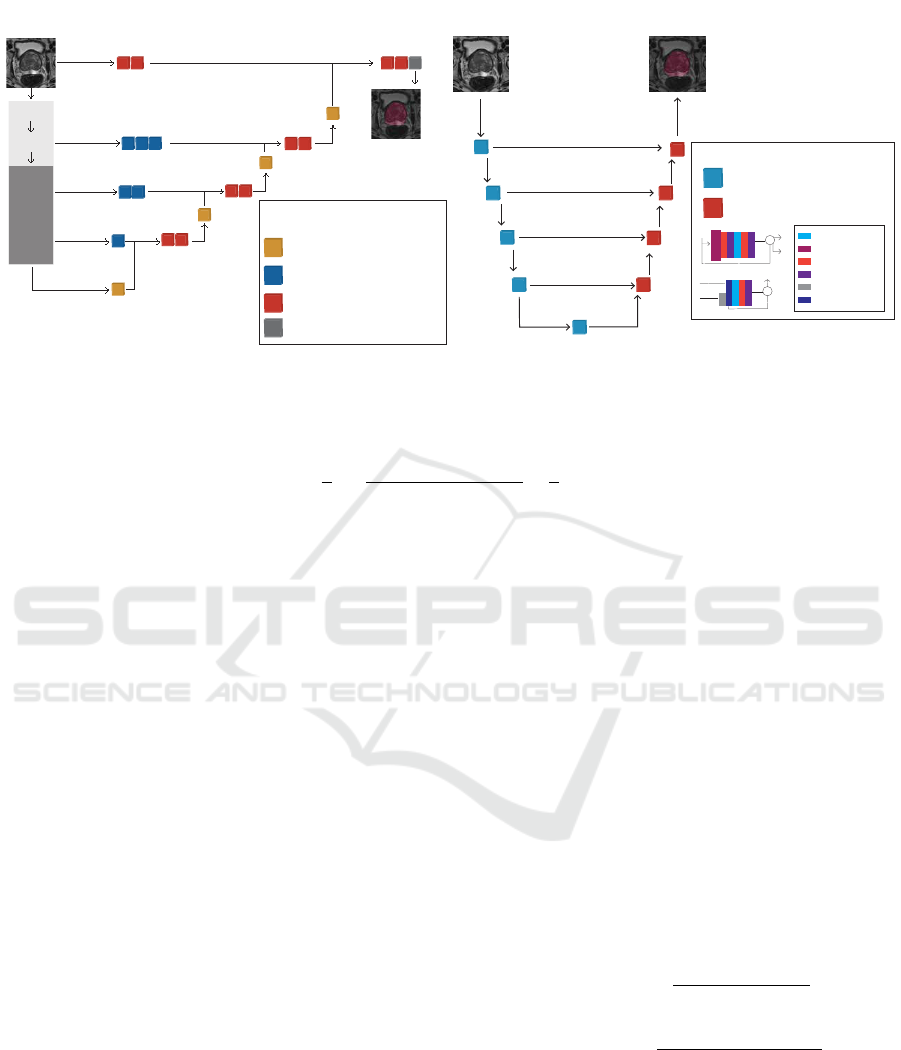
The Residual U-Net, Fig. 2b, is an encoder-decoder
architecture with 5 residual units in the encoder path
and 4 up-sample units in the decoder path. Each resid-
ual unit consists of two convolutional modules, where
each module is composed of a convolutional layer
with a stride of 2, an instance normalization layer to
prevent contrast shifting, and a parametric rectifying
linear unit (PReLU). Only the first residual unit has a
stride of 1. The up-sample units, on the other hand,
are composed of a transpose convolutional layer that
doubles the size of the feature map, a convolutional
layer, instance normalization layer, and PReLU ac-
tivation function. The encoder and decoder paths are
connected through a concatenation operation between
residual and up-sample units on opposite sides. The
benefit of these connections is that the low and high
level details extracted in the architecture are consid-
ered to produce the final segmentation.
The UNETR, Fig. 2a, has a contracting-
expanding structure that implements both a Trans-
former and CNN network. The encoder has a stack
of transformer blocks, which are comprised of multi-
head self-attention (MSA) layers and multilayer per-
ceptron (MLP) sublayers. The MLP sublayers have
two linear layers with a Gaussian Error Linear Unit
(GELU) activation function. In the MSA layers, there
are parallel self-attention (SA) heads whose weights
are calculated by measuring the similarity between
key and query and their key-value pairs. Meanwhile,
the decoder has the CNN portion. It is composed of
4 convolutional blocks with 2 convolutional modules
each. The convolutional block consists of a convolu-
tional layer, batch normalization layer, and ReLU ac-
tivation function. Furthemore, inspired by the U-Net,
the encoder and decoder are connected through skip
connections. Since Transformers work with 1D input,
the 3D images of size (H,W, D,C) are transformed to
1D by flatenning them into uniform non-overlapping
patches of size P
3
C , where (P,P,P) denotes the reso-
lution of each patch, and N = (H ×W × D)/P
3
is the
length of the sequence. Afterwards, a linear layer is
applied to project the patches into a K dimensional
embedding space. This layer is constant through-
out the Transformer layers. Moreover, to preserve
the spatial information of the extracted patches, a 1D
learnable positional embedding is added to the patch
ICAART 2023 - 15th International Conference on Agents and Artificial Intelligence
602
Linear
Projection
Embedded
Patches
Multi-Head
Attention
Norm
MLP
Norm
x12
Input:
H x W x D x 1
UNETR
Deconv 2 x 2 x 2
Deconv 2 x 2 x 2, Conv 3 x 3 x 3, BN, ReLu
Conv 3 x 3 x 3, BN, ReLU
Conv 1 x 1 x1
Network Units
Output:
H x W x D x 2
(a) UNETR architecture (Hatamizadeh et al., 2021).
Residual U-Net
Network Units
Residual Units
Upsampling Units
Conv 3 x 3 x 3
Conv 3x3x3 +Stride
Instance Norm
PReLU
ConvTrans 2x2x2+Stride
Concat
+
+
Residual Units
UpSample Units
Input:
H x W x D x 1
Output:
H x W x D x 2
(b) Residual U-net architecture (Kerfoot et al., 2019).
Figure 2: The CNN and Transformer models compared.
L(G,Y ) = 1 −
2
J
J
∑
j=1
∑
I
i=1
G
i, j
Y
i, j
∑
I
i=1
G
2
i, j
+
∑
I
i=1
Y
2
i, j
−
1
I
I
∑
i=1
J
∑
j=1
G
i, j
logY
i, j
(2)
HD(G
0
,P
0
) = max{max
g
0
∈G
0
min
p
0
∈P
0
||g
0
− p
0
||,max
p
0
∈P
0
min
g
0
∈G
0
||p
0
− g
0
||} (3)
embedding.
2.3 Experimental Setup
2.3.1 Training the Models
For each fold, the architectures are trained four times
with the different dataset sizes mentioned in subsec-
tion 2.1. The loss function optimized during train-
ing is a combination of the soft dice loss and cross-
entropy loss, as displayed in Eq. 2, where I is the
number of voxels, J is the number of classes, Y
i j
is the
output probability for voxel i and class j, and G
i j
the
ground truth for the corresponding voxel. Both mod-
els are trained with the AdamW optimizer for 1000
epochs, a learning rate of 1×10
−5
, and a batch size of
3. The weight initialization is done based on the type
of layer. Transformers layers are initialized with the
xavier-uniform initialization method, while the con-
volutional and linear layers with the Kaiming method.
Data augmentation is not applied during training to
evidence the effect the dataset sizes have on the net-
work´s performance. The architectures are imple-
mented in PyTorch (v. 1.12.0) and MONAI (v.0.9.0),
using a NVIDIA DGX Station A100 for training.
The size of the training set was varied during train-
ing from 30, 60, 90, and 120 images to evaluate the
performance of each model as the dataset increased.
2.3.2 Segmentation Performance Evaluation
The models are evaluated in the same test set of the
corresponding fold using the 95% Hausdorff distance
(HD) (Eq.3), Dice similarity coefficient (Eq.4), and
Jaccard distance (Eq. 5) metrics. The Hausdorff dis-
tance is a distance metric that calculates the maxi-
mum distance between the ground truth and the near-
est point of the segmented zone. The 95
th
percent
of the boundaries are reported to eliminate the im-
pact of outliers. The Dice similarity coefficient and
Jaccard distance are overlap based measures. The
Dice measures the volumetric overlap between the
predicted segmentation and the ground truth segmen-
tation, while the Jaccard distance calculates the extent
of overlap between the ground truth and the prediction
zone.
Dice(G,P) =
2
∑
I
i=1
G
i
P
i
∑
I
i=1
G
i
+
∑
I
i=1
P
i
(4)
D
J
(G
0
,P
0
) =
|G
0
∪ P
0
| −
∑
I
i=1
G
0
i
P
0
i
|G
0
∪ P
0
|
(5)
The results reported are an average over the 5-
folds with its respective standard deviation. More-
over, to make sure the conclusions obtained are statis-
tically significant, a one-tailed paired t-test with 95%
confidence level is applied.
Convolutional Networks Versus Transformers: A Comparison in Prostate Segmentation
603
UnetR
Res. Unet
MRI & Label
30 60
120
90
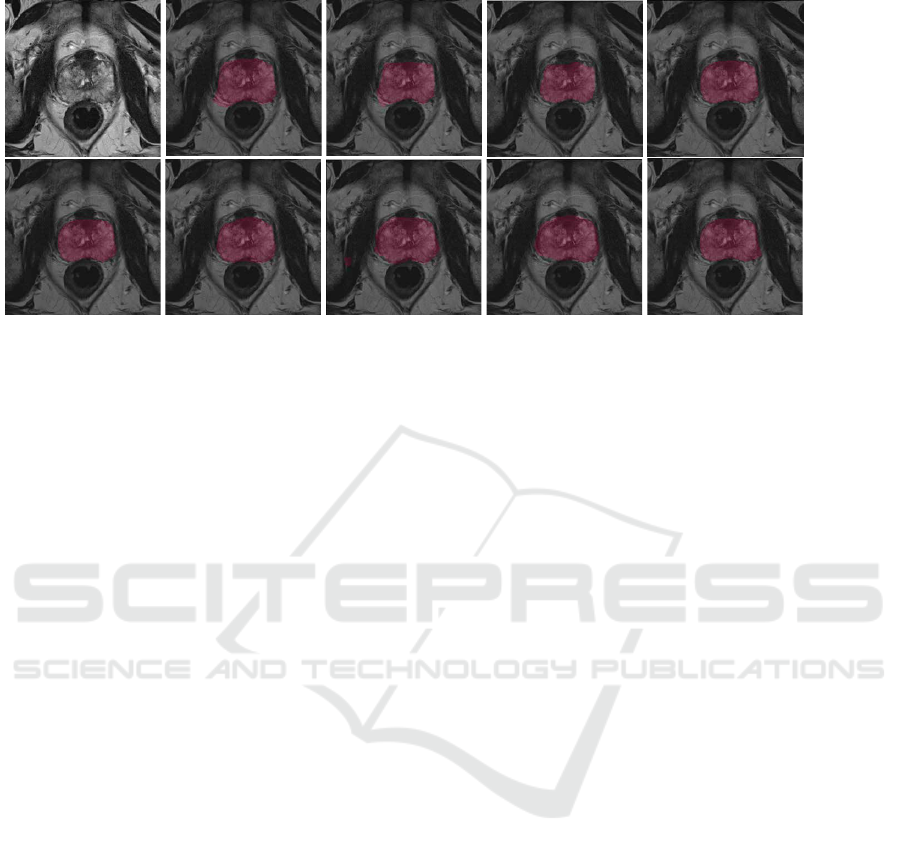
Figure 3: Results of UNETR and Residual Unet segmentation, on the first row the predictions of UNETR. On the second row
the predictions of Residual Unet.
2.4 Computational Complexity
Evaluation
The computational complexity of the models is eval-
uated by calculating the number of trainable param-
eters and the floating-point operations per second
(FLOPS). The number of model parameters mea-
sures the width and depth of the network; in gen-
eral, more parameters means higher complexity. The
FLOPS measure the hardware’s effort to perform a
task, higher FLOPS imply higher complexity.
3 RESULTS AND DISCUSSION
The results of the segmentation evaluation for each
model and size of dataset are presented in Table 1, the
complexity evaluation is displayed in Table 2, while
examples of the segmentation results in Fig. 3. The
experiments show that when the dataset has 30 im-
ages, UNETR has a statistically higher mean dice and
mean jaccard. Nevertheless, the difference is rather
small, being of 1.2% in the dice score and 1.3% in
the jaccard distance. In terms of the 95% Hausdorff
distance, both architectures have a statistically simi-
lar performance. When the number of images is in-
creased to 60, both architectures perform statistically
the same in terms of the mean dice, the U-Net per-
forms statistically better in the jaccard distance, and
the UNETR in the 95% Hausdorff distance. Finally,
when the dataset has 90 or 120 images, the U-Net sur-
passes the performance of the UNETR in the mean
dice and mean jaccard. Although the differences are
statistically significant, the magnitude of the differ-
ence is small in all dataset sizes. There are three pos-
sible reasons for these results. First, that Transform-
ers do need large datasets to outperform CNNs due to
their absence of strong inductive biases. Although we
partitioned the dataset to evaluate this behaviour, the
whole dataset might still be too small to see the in-
crease in the UNETR performance. The second rea-
son might be the importance of long-range dependen-
cies in this task. Transformers are good at capturing
global information, however if for a prediction this
information is not as impactful, the regional local-
ity of convolutional operations is enough. Third, the
CNNs inductive biases of locality and weight shar-
ing are adequate for prostate segmentation. Finally,
similar results as ours were presented in (Matsoukas
et al., 2021) for the task of medical image classifica-
tion. The authors showed that CNNs outperformed
vision Transformers when trained from scratch, and
both architectures were on the par when pretrained on
ImageNet.
In the experiments, we are also able to evidence
how the size of dataset affects the performance of
a model. As expected, when the number of images
grow, so does the segmentation accuracy. Interest-
ingly, the major improvement is achieved when the
dataset increases from 30 to 60 images. After this, the
improvement reduces and remains almost constant.
This behaviour is also visible on the segmentation re-
sults from Fig. 3. As the dataset becomes larger, the
predicted segmentations are closer to the ground truth
shape. On the datasets with 30 and 60 images the
predicted segmentations have irregular borders, even
over the prostate region. Considering the computa-
tional complexity, the UNETR has 5× more parame-
ters than the residual U-Net and requires 5.8× more
FLOPS. It is well known that the self-attention mod-
ules in Transformers have a high computational and
memory costs that is quadratic to the resolution of the
ICAART 2023 - 15th International Conference on Agents and Artificial Intelligence
604
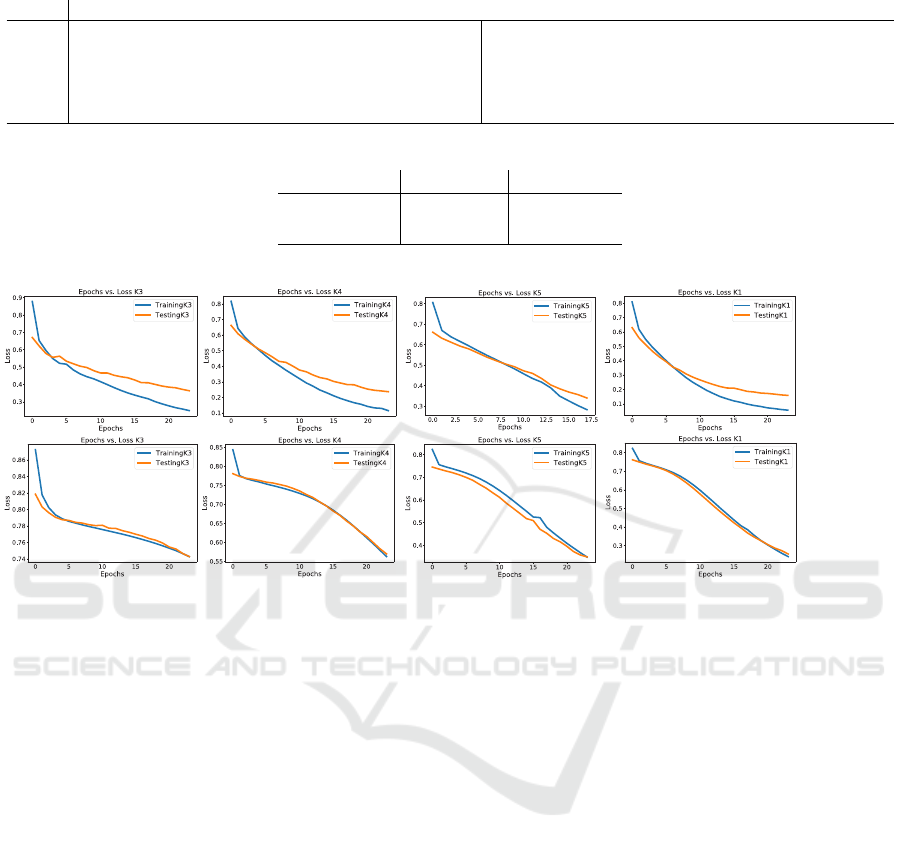
Table 1: Average Results obtained from UNETR and Residual Unet for the different datasets groups.
Arch. UNETR Res. U-net
Data Loss ±σ Dice ±σ Jaccard ±σ 95 HD ±σ Loss ±σ Dice ±σ Jaccard ±σ 95 HD±σ
120 0.16 ± 0.05 0.86 ± 0.01 0.75 ± 0.02 9.12 ± 1.25 0.14 ± 0.01 0.87 ± 0.01 0.77 ± 0.02 9.72 ± 5.31
90 0.24 ± 0.09 0.85 ± 0.02 0.74 ± 0.02 9.53 ± 1.30 0.17 ± 0.02 0.86 ± 0.01 0.75 ± 0.02 12.11 ± 3.26
60 0.29 ± 0.09 0.84 ± 0.01 0.73 ± 0.02 8.82 ± 1.37 0.18 ± 0.02 0.84 ± 0.02 0.73 ± 0.02 12.66 ± 3.67
30 0.44 ± 0.03 0.81 ± 0.02 0.69 ± 0.02 11.49 ± 2.98 0.35 ± 0.23 0.80 ± 0.02 0.67 ± 0.02 17.46 ± 5.36
Table 2: Parameter and Flops per model.
Arch. UNETR Res. U-net
Parameters 24.15M 4.8M
Flops 138.462 G 23.672 G
UnetR
30
60
12090
Res. Unet
Figure 4: Training plots of the UNETR and Residual Unet displaying Epochs vs. Loss. UNETR overfits the training set early
in the training process.
input. Given that the additional computational costs
of Transformers are not justified by a performance
improvement, we conclude that in the task of prostate
segmentation CNNs are still the leading methods.
Finally, the graphs of loss versus epochs for each
group of data is presented in Fig. 4, where we can see
that the UNETR tends to overfit earlier in the train-
ing process. Meanwhile, the Residual U-Net does
not show any signs of overfitting. This can be caused
by the larger size of the UNETR architecture, which
makes it vulnerable to overfitting a small dataset.
Future directions of research include testing Trans-
former networks on other medical segmentation tasks
and increasing the size of the dataset.
4 CONCLUSIONS
CNNs have become dominant in medical image seg-
mentation due to their exceptional representation
power. Nevertheless, CNNs struggle at capturing
long-range information because of the intrinsic local-
ity of convolution operations. Hence, Transformer
networks have emerged as an alternative that through
the implementation of self-attention modules can cap-
ture global context information. In this work, we eval-
uate the performance of the CNN U-Net and Trans-
former UNETR in the task of prostate segmentation
from the PROSTATEx dataset. Moreover, to ana-
lyze the effect the dataset size has on the segmen-
tation accuracy, four datasets are formed with 30,
60, 90, and 120 images. Our results shows that the
U-Net and UNETR have an overall similar perfor-
mance in all datasets, with the U-Net architecture hav-
ing a slightly statistical higher segmentation accuracy.
Moreover, the U-Net architecture has a lower compu-
tational complexity when considering the number of
parameters and FLOPS. Therefore, being a better op-
tion than the Transformer network.
ACKNOWLEDGEMENTS
Authors would like to thank research radiologists
(Drs. Hong Lu, Qian Li and Jin Qi) and clinical radi-
ology colleague (Dr. Choi) at H. Lee. Moffitt cancer
Convolutional Networks Versus Transformers: A Comparison in Prostate Segmentation
605

center, who helped to provide consensus opinion on
the regions of prostate anatomy. We are also thank-
ful to the support staff (Ms. Tribene & Mr. Garcia)
who helped with data organization. We also thank
the Applied Signal Processing and Machine Learning
Research Group of USFQ for providing the comput-
ing infrastructure (NVidia DGX workstation) to im-
plement and execute the developed source code, re-
spectively.
REFERENCES
Aldoj, N., Biavati, F., Michallek, F., Stober, S., and Dewey,
M. (2020). Automatic prostate and prostate zones
segmentation of magnetic resonance images using
DenseNet-like u-net. Scientific Reports, 10(1).
Calisto, M. B. and Lai-Yuen, S. K. (2020). Adaen-net: An
ensemble of adaptive 2d–3d fully convolutional net-
works for medical image segmentation. Neural Net-
works, 126:76–94.
Calisto, M. B. and Lai-Yuen, S. K. (2021). Emonas-net:
Efficient multiobjective neural architecture search us-
ing surrogate-assisted evolutionary algorithm for 3d
medical image segmentation. Artificial Intelligence in
Medicine, 119:102154.
Centers for Disease Control and Prevention (2022). What
is screening for prostate cancer?
Chen, J., Lu, Y., Yu, Q., Luo, X., Adeli, E., Wang, Y., Lu, L.,
Yuille, A. L., and Zhou, Y. (2021). Transunet: Trans-
formers make strong encoders for medical image seg-
mentation.
Dosovitskiy, A., Beyer, L., Kolesnikov, A., Weissenborn,
D., Zhai, X., Unterthiner, T., Dehghani, M., Min-
derer, M., Heigold, G., Gelly, S., Uszkoreit, J., and
Houlsby, N. (2020). An image is worth 16x16 words:
Transformers for image recognition at scale. CoRR,
abs/2010.11929.
Ehman, E. C., Johnson, G. B., Villanueva-Meyer, J. E., Cha,
S., Leynes, A. P., Larson, P. E. Z., and Hope, T. A.
(2017). Pet/mri: Where might it replace pet/ct? Jour-
nal of Magnetic Resonance Imaging, 46:1247–1262.
Eklund, M., J
¨
aderling, F., Discacciati, A., Bergman, M.,
Annerstedt, M., Aly, M., Glaessgen, A., Carlsson,
S., Gr
¨
onberg, H., and Nordstr
¨
om, T. (2021). MRI-
targeted or standard biopsy in prostate cancer screen-
ing. New England Journal of Medicine, 385(10):908–
920.
Eldred-Evans, D., Tam, H., Sokhi, H., Padhani, A. R.,
Winkler, M., and Ahmed, H. U. (2020). Rethinking
prostate cancer screening: could MRI be an alternative
screening test? Nature Reviews Urology, 17(9):526–
539.
Gu, J., Wang, Z., Kuen, J., Ma, L., Shahroudy, A., Shuai,
B., Liu, T., Wang, X., Wang, G., Cai, J., and Chen,
T. (2018). Recent advances in convolutional neural
networks. Pattern Recognition, 77:354–377.
Hatamizadeh, A., Nath, V., Tang, Y., Yang, D., Roth, H.,
and Xu, D. (2022). Swin unetr: Swin transformers for
semantic segmentation of brain tumors in mri images.
Hatamizadeh, A., Tang, Y., Nath, V., Yang, D., Myronenko,
A., Landman, B., Roth, H., and Xu, D. (2021). Unetr:
Transformers for 3d medical image segmentation.
Huang, S., Li, J., Xiao, Y., Shen, N., and Xu, T. (2022).
RTNet: Relation transformer network for diabetic
retinopathy multi-lesion segmentation. IEEE Trans-
actions on Medical Imaging, pages 1–1.
Katzung, B. G. (2017). Basic and Clinical Pharmacology
14th Edition, page 948. McGraw Hill Professional.
Kerfoot, E., Clough, J., Oksuz, I., Lee, J., King, A. P.,
and Schnabel, J. A. (2019). Left-ventricle quantifi-
cation using residual u-net. In Statistical Atlases and
Computational Models of the Heart. Atrial Segmen-
tation and LV Quantification Challenges, pages 371–
380. Springer International Publishing.
Li, J., Wang, W., Chen, C., Zhang, T., Zha, S., Wang, J., and
Yu, H. (2022). Transbtsv2: Towards better and more
efficient volumetric segmentation of medical images.
Li, Z., Liu, F., Yang, W., Peng, S., and Zhou, J. (2021).
A survey of convolutional neural networks: Analy-
sis, applications, and prospects. IEEE Transactions
on Neural Networks and Learning Systems, pages 1–
21.
Lundervold, A. S. and Lundervold, A. (2019). An overview
of deep learning in medical imaging focusing on MRI.
Zeitschrift f
¨
ur Medizinische Physik, 29(2):102–127.
Matsoukas, C., Haslum, J., S
¨
oderberg, M., and Smith, K.
(2021). Is it time to replace cnns with transform-
ers for medical images? arxiv 2021. arXiv preprint
arXiv:2108.09038.
Naji, L., Randhawa, H., Sohani, Z., Dennis, B., Lautenbach,
D., Kavanagh, O., Bawor, M., Banfield, L., and Pro-
fetto, J. (2018). Digital rectal examination for prostate
cancer screening in primary care: A systematic review
and meta-analysis. The Annals of Family Medicine,
16(2):149–154.
Radboud University Medical Centre (2017). Prostatex-
grand challenge. [Accessed 07-May-2022].
Ramachandran, P., Parmar, N., Vaswani, A., Bello, I., Lev-
skaya, A., and Shlens, J. (2019). Stand-alone self-
attention in vision models. CoRR, abs/1906.05909.
Rawla, P. (2019a). Epidemiology of prostate cancer. World
Journal of Oncology, 10(2):63–89.
Rawla, P. (2019b). Epidemiology of prostate cancer. World
Journal of Oncology, 10:63–89.
Razzak, M. I., Naz, S., and Zaib, A. (2017). Deep learning
for medical image processing: Overview, challenges
and future.
Ronneberger, O., Fischer, P., and Brox, T. (2015). U-net:
Convolutional networks for biomedical image seg-
mentation. CoRR, abs/1505.04597.
Tian, Z., Liu, L., Zhang, Z., and Fei, B. (2018). PSNet:
prostate segmentation on MRI based on a convolu-
tional neural network. Journal of Medical Imaging,
5(2):1 – 6.
Ushinsky, A., Bardis, M., Glavis-Bloom, J., Uchio, E.,
Chantaduly, C., Nguyentat, M., Chow, D., Chang,
ICAART 2023 - 15th International Conference on Agents and Artificial Intelligence
606

P. D., and Houshyar, R. (2021). A 3d-2d hybrid u-net
convolutional neural network approach to prostate or-
gan segmentation of multiparametric mri. American
Journal of Roentgenology, 216(1):111–116. PMID:
32812797.
Wu, B., Xu, C., Dai, X., Wan, A., Zhang, P., Tomizuka, M.,
Keutzer, K., and Vajda, P. (2020). Visual transformers:
Token-based image representation and processing for
computer vision. CoRR, abs/2006.03677.
Yabroff, K. R., Mariotto, A., Tangka, F., Zhao, J., Islami, F.,
Sung, H., Sherman, R. L., Henley, S. J., Jemal, A., and
Ward, E. M. (2021). Annual Report to the Nation on
the Status of Cancer, Part 2: Patient Economic Burden
Associated With Cancer Care. JNCI: Journal of the
National Cancer Institute, 113(12):1670–1682.
Zhang, Y., Wu, J., Chen, W., Chen, Y., and Tang, X. (2019).
Prostate segmentation using z-net. In 2019 IEEE
16th International Symposium on Biomedical Imaging
(ISBI 2019). IEEE.
Convolutional Networks Versus Transformers: A Comparison in Prostate Segmentation
607
