
Analysis of Driving Behavior by Applying LDA Topic Model at
Intersection Using VR Simulator
Hyeokmin Lee
1a
, Hosang Moon
1b
, Jaehoon Kim
1c
, Jaeheui Lee
1d
,Eunghyuk Lee
2e
and
Sungtaek Chung
3f
1
Department of IT Semiconductor Convergence Engineering, Tech University of Korea, 237,
Sangidaehak-ro, Siheung-si, Gyeonggi-do, Republic of Korea
2
Department of Electronic Engineering, Tech University of Korea, 237, Sangidaehak-ro,
Siheung-si, Gyeonggi-do, Republic of Korea
3
Department of Computer Engineering, Tech University of Korea, 237, Sangidaehak-ro,
Siheung-si, Gyeonggi-do, Republic of Korea
Keywords: Driving Behaviors, Driving Style, Latent Dirichlet Allocation, Topic Model.
Abstract: The present study aims to analyze driving style and latent driving behavior typically at intersections where
various driving habits show up. To this end, 6 different scenarios were simulated and data on the gaze of the
drivers were analyzed using topic modeling. Their driving styles (topics) latent in the driver’s driving
behaviors (words) following a driving scenario (document) were analyzed by using the latent dirichlet
allocation of topic modeling, the most frequently used in discovering latent topics in documents generally
made up of words. For the study, six participants in their twenties were selected whose driver licenses were
more than a year old. They were asked to drive in a virtual reality simulator, while wearing a head mounted
display capable of tracking their gazes. The experimental results showed that the less experienced the drivers
were, the more frequently and longer they gazed at the navigation and the speed instrument panel and repeated
the start and stop. On the other hand, the more experienced the drivers were, the more they gazed briefly at
the objects within the car, maintained speed after glancing at the most distant objects, and applied braking
only when necessary.
1 INTRODUCTION
Driving is a complex activity which requires high
capability of visual recognition of traffic situations,
such as vehicles, traffic signs, and traffic lights, and
driving efficiency to control the vehicle, such as
speed control and steering. For safe driving, proper
visual recognition is critical in identifying certain
latent danger elements, such as pedestrians waiting
for the traffic signal before crossing or the vehicles
changing lanes lanes (Miller et al., 2021).
Furthermore, a long gaze on a single object or a visual
search can distract attention while driving. This can
a
https://orcid.org/0000-0002-9965-4623
b
https://orcid.org/0000-0002-8527-323X
c
https://orcid.org/0000-0001-7735-7639
d
https://orcid.org/0000-0003-2638-9416
e
https://orcid.org/0000-0002-4434-0694
f
https://orcid.org/0000-0002-8692-0179
lead to intermittent mistakes such as losing control of
the vehicle or delayed response to abrupt events (Sun
et al., 2018).
To prevent accidents, it is imperative that the
visual information collected by gazing the road
objects is identified correctly and the driving is
adjusted accordingly. Such driving through visual
search and vehicle control depends on various factors,
such as age, occupation, personality and driving
experience of the driver. Even under the same
conditions, drivers can show different driving
behaviors (de Zepeda et al., 2021). In this regard, by
evaluating the various driving styles habitually
432
Lee, H., Moon, H., Kim, J., Lee, J., Lee, E. and Chung, S.
Analysis of Driving Behavior by Applying LDA Topic Model at Intersection Using VR Simulator.
DOI: 10.5220/0011716900003414
In Proceedings of the 16th International Joint Conference on Biomedical Engineer ing Systems and Technologies (BIOSTEC 2023) - Volume 5: HEALTHINF, pages 432-438
ISBN: 978-989-758-631-6; ISSN: 2184-4305
Copyright
c
2023 by SCITEPRESS – Science and Technology Publications, Lda. Under CC license (CC BY-NC-ND 4.0)
adopted by the drivers, inconsistent or dangerous
driving styles (e.g. fatigue driving, drunk driving, or
aggressive driving) can be detected and distinguished
(Martinelli et al., 2020). Studies with classified
driving styles as aggressive, anxious, economic, keen
or sedate from ratings of simulated scenarios, and into
aggressive, anxious and keen from Fuzzy Logic
Model based on the accelerator data (Liao et al., 2022;
Bar et al., 2011). However, since the driving
behaviors classified considered only the speed and
acceleration data, drivers with the same personalities
can exhibit different driving behaviors. Thus, to
analyze personalized driving styles, recent studies
tried to discover the latent meanings from the
behavioral data using the topic model with pLSA
(Probabilistic Latent Sematic Analysis) and LDA
(Latent Dirichlet Allocation) for searching latent
subjects in natural language process (Chen et al.,
2019).
At intersections, where traffic environment is
complicated, driving requires a lot more attention,
and the driver’s driving behavior appears in various
ways, such as decision making at traffic light change
in the dilemma region (yellow light), yielding to the
right of way vehicles, and attention to pedestrian
crossing (Li et al., 2019). Generally, driving is
evaluated through actual driving on road. However, if
dangerous driving is evaluated the same way on the
roads, there is a high chance of accident during the
test, particularly if the driver is inexperienced.
Therefore, such type of driving should be conducted
in a Virtual Reality (VR) driving simulator
environment due to repetitive experimental
procedures and the safety issue. The environment of
a VR driving simulator is very similar to that of real
driving on actual road. The VR driving simulator has
an advantage to evaluate the responses of participants
to life threatening driving situations, which are
impossible in the actual driving, by controlling
certain driving events, such as the degree of difficulty
of driving routes, and traffic jams. Especially, the VR
driving simulator comprising a Head Mount Display
(HMD) has the advantage of providing higher
concentration to driving, immersion, and interest than
the existing 3D environmental devices (e.g. Full HD,
Smart TV) (Lang et al., 2018; Gonzalez et al., 2020).
In the current study, scenario of driving at
intersection was designed where the driving
behaviors are most diverse in the VR environment.
Data related to drivers’ gaze while driving and
vehicle control (viz. accelerometer, brake and the
current speed) were collected. The data were then
converted to words applying LDA topic modeling to
analyze and compare the drivers’ driving habits. The
latent driving habits of each driver, that is, the
dangerous behaviors, were identified by confirming
the probability distributions of driving behavior by
topic for each scenario. Through the results obtained,
the present study contributed to the identification and
analysis of a driver's dangerous behaviors that can
cause traffic accidents.
2 METHODS AND MATERIALS
2.1 Experiment Participants
This study was conducted 6 healthy volunteers (3
males and 3 females) aged between 20 and 30 years
were selected. All the participants already held
license for at least one year. Whether the participants
had actual driving experience or had their own cars
did not matter. Table 1 shows the annual driving
distance during the latest year and the driving
frequency during the latest month of four participants,
and the remaining two did not have any driving
experience.
Table 1: Characteristics and the information on driving of
participants.
Age
(Gender)
License
(years)
Mileage
(last 1
year)
Frequency
(last 1
month)
Subject 1
24
(Male)
2 - -
Subject 2
24
(Female)
2 - -
Subject 3
26
(Male)
4 2478 km 7 times
Subject 4
25
(Female)
3 2087 km 6 times
Subject 5
27
(Male)
8 21783 km 20 times
Subject 6
29
(Male)
8 22524 km 25 times
2.2 VR Driving Simulator Scenarios
Eye tracking data (sampling rate: 30 Hz) were
obtained by VIVE PRO EYE with the participants
wearing an HMD (resolution 1440 x 1600 pixels per
eye, scanning rate 90 Hz) of VIVE PRO EYE
product. Figure 1 shows the simulator which
comprised a steering wheel capable of a 900 degree
turn, a bottom pedal to which accelerator and brake
were integrated, a 6 speed H pattern gear shift, and a
Analysis of Driving Behavior by Applying LDA Topic Model at Intersection Using VR Simulator
433
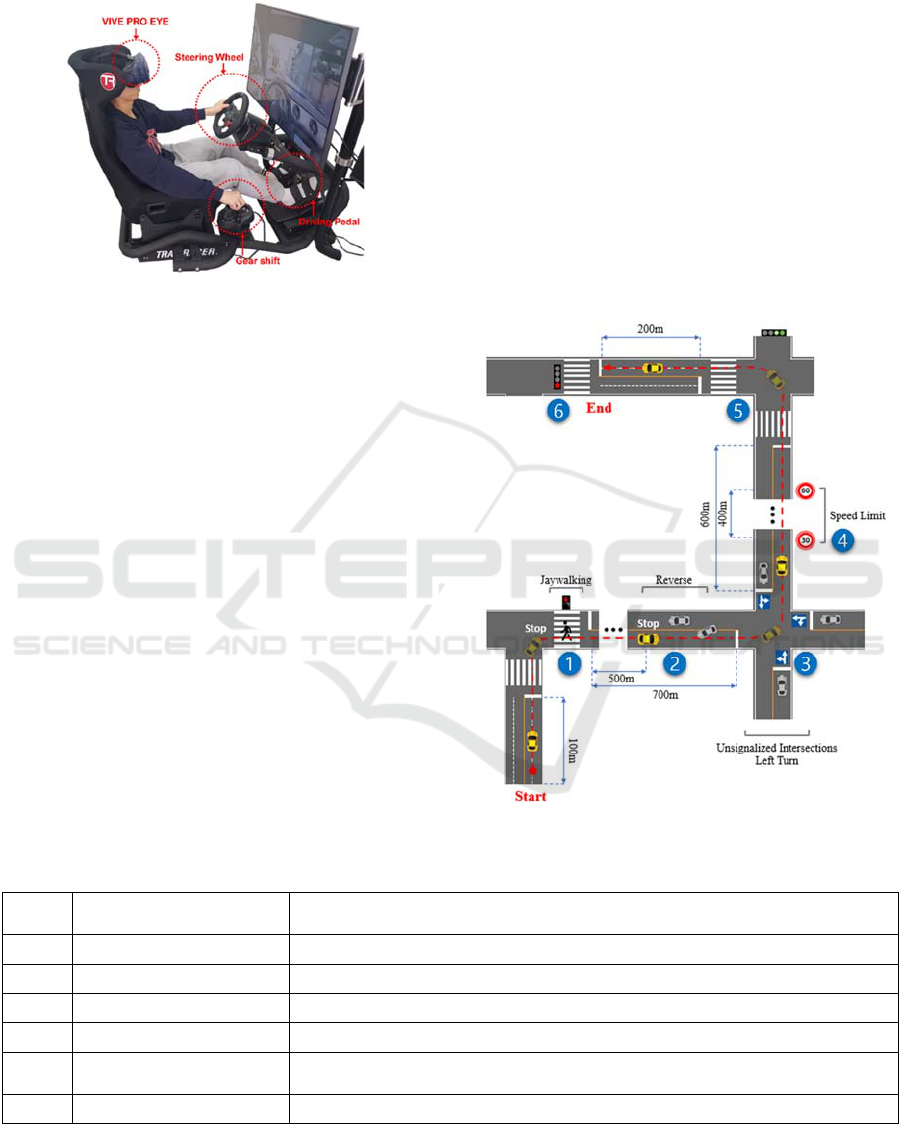
Logitech G29 Driving Force connected to operate the
VR environment vehicle.
Figure 1: The experimental apparatus and environment.
The participants performed autonomous driving
for about 10 minutes after they were told how to
operate the simulator. Figure 2 shows a 4-minute
driving scenario comprising pedestrians crossing
(Jaywalk) after going straight and turning left,
intruding into the next lane due to stopped cars
(Reversing vehicle collision), turning left at an
intersection without a traffic light (turning left), a 30
km/hour speed limit section (Speed limit), and a red
traffic light (Traffic light) after stopping and turning
left at an intersection (Stop and go). The participants
were asked to drive at least at a speed of 50 km/h
according to their usual driving habits. The session
ended when it was difficult to continue to drive due
to a collision or VR sickness.
Table 2 shows the driving scenario by sections.
First, the ‘Jaywalk’ is a sudden situation while turning
right at an intersection with a traffic light. A
pedestrian crosses the crosswalk at the same time
when the traffic light turns to red. Participants should
control the vehicle appropriately by recognizing the
pedestrian and try not to hit the pedestrian. Second,
for ‘Reversing vehicle collision’, participants should
recognize a vehicle which trespasses the centerline
from the opposite direction to the driving direction,
and the participant should hit the brake or turn the
steering wheel. Third, for ‘Turning left’, the
participants should turn left at an intersection with no
traffic light after searching for any neighboring car so
that they do not collide with the car. Fourth, for
‘Speed limit’, the participants should recognize a 30
km/h speed limit sign and slow down the vehicle.
Fifth, for ‘Stop and go’, participants should identify a
yellow signal or a green left turn signal, and drive the
vehicle accordingly. Last, for ‘Traffic lights’, the
participants should recognize a red stop signal on a
four-lane street and stop the vehicle before the stop
line.
Figure 2: The driving scenario on the VR simulator.
Table 2: Driving scenario by sections.
Section Scenario Description
1 Jaywalk A pedestrian crosses a crosswalk as soon as the traffic light turns to red
2 Reversing vehicle collision A vehicle crosses the centerline and drives in the wrong direction
3 Turning left Turn left safely at uncontrolled intersection while watching neighboring car
4 Speed limit Slow down after seeing a 30 km/h speed limit sign on a two-lane highway
5 Stop or go
Stop or turn left after identifying yellow or left turn signal at controlled
intersection
6 Traffic lights Stop on the stop line on a four-lane highway after identifying the red signal.
HEALTHINF 2023 - 16th International Conference on Health Informatics
434
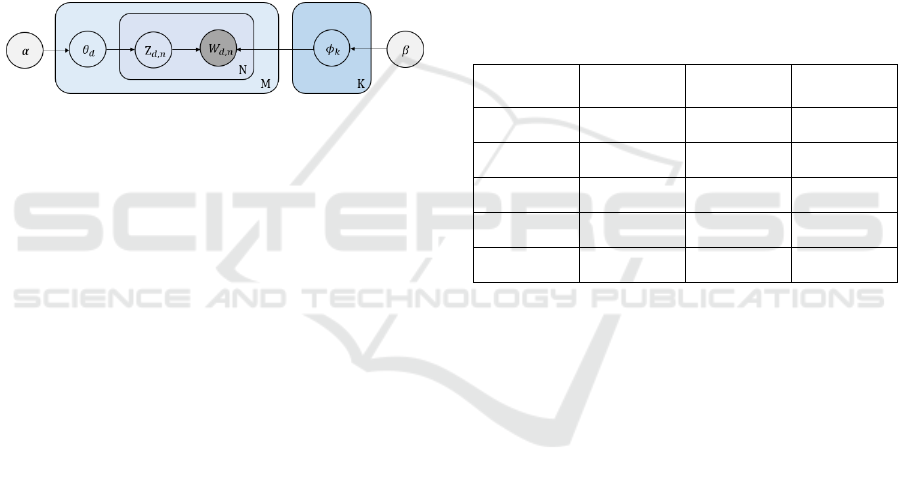
2.3 Probabilistic Topic Model
In general, a topic model is a statistical model to find
latent “topics” in a document. The topic model is used
to find hidden meaning structures in the text and is
used in various fields, such as text mining, image
classification, tag recommendation, and social
network. The Latent Dirichlet Allocation (LDA), the
most general method of topic modeling used at
present, is used to form latent topics in documents
composed of words (Jelodar et al., 2019; Merino et
al., 2018). Therefore, we used the LDA model to
analyze the driving style (topic) latent in the driving
behavior (words) for each driving scenario
(document) in the current work. Figure 3 shows a
schematic diagram of probability graph model and the
formation process of the LDA model.
Figure 3: Graphical model of Topic Modeling with LDA.
In Figure 3, α and β are Dirichlet hyper parameter
values that represent the distribution of driving styles
of drivers and the density of the driving behaviors. Κ
indicates the hyper parameter value of the number of
driving styles. M means the total number of scenarios,
N the number of driver’s driving behaviors in the 𝑀
scenario, w means driving behavior, and z means
driving style. Here, if the initial parameter values (α,
β, and K) are set, 𝜃
can be determined at the
Dirichlet probability distribution of driving style in
the 𝑑
scenario, 𝜑
at the Dirichlet probability
distribution of the kth driving behavior. According to
the determined probability distribution, the driving
behavior of the nth driver under the dth scenario,
𝑊
,
data was allocated to the driving style of the nth
driver under the 𝑑
scenario. When all the driving
behaviors (W) were allocated to the driving style (Z),
it converged to the set Dirichlet distribution (𝜃
).
To apply the topic model in this study, the
quantitative data of driving behaviors, viz. increase
and decrease in the vehicle speed, the frequency and
strength on the accelerator and brake depending on
the objects of gaze in each scenario were classified
into five intervals by dividing the maximum values.
Table 3 shows the converted words corresponding to
the five intervals. Generally, drivers drive at different
average speeds in each scenario. So, the relative feel
on the speed can be different, for example the feel of
driving at 10 km/h will be different for an average
speed of 30km/h and 60 km/h. Therefore, after the
maximum speed in each scenario was set to 100% and
divided into five intervals, the quantitative data were
converted to words. For example, in the first scenario,
when the maximum speed, the maximum brake
pressure, and the longest gaze were 70 km/h, 40 kgf,
and 10 seconds, respectively, if a driver’s driving
speed, brake pressure, and the gaze were 50 km/h, a15
kgf, and 2 seconds, the words converted from the data
will be: “high speed, brake light, very short”.
Moreover, if the present (t) and next (t+1) driving
behaviors are identical in terms of converted words,
the next driving behavior was converted to ‘keep’.
For driving at a constant speed, it was converted to
‘keep speed’. The latent driving styles were analyzed
and the differences were compared depending on the
driving experiences based on the words regarding the
driver’s driving behavior.
Table 3: The words for conversions for the five intervals in
percent of speed, brake, and gaze time data.
Value (%)
Speed
(km/h)
Brake (kgf)
Gaze time
(sec)
81-100 Very high Very hardly Very long
61-80 High Hardly Long
41-60 Normal Normal Medium
21-40 Low Softly Short
0-20 Very low Very softly Very short
3 RESULTS
Among the participants, Subject 1 and Subject 6
were expected to show the largest difference in the
driving speed due to differences in their driving
experiences. Figure 4 shows the driving speeds in
different scenario sections of Subject 6 with the most
driving experience and Subject 1 with no driving
experience. The average driving speed (34.2 km/h)
of Subject 1 was faster than the average speed (25.4
km/h) of Subject 6. Both drove at similar speeds in
the scenarios of jaywalk, reversing vehicle collision,
and turning left at the controlled intersection.
However, while Subject 1 started and stopped
frequently and repeatedly in the scenario of turning
left at the uncontrolled intersection (Section A),
Subject 6 turned left while gazing at neighboring
vehicles with little change in speed. At the
intersection with traffic signals (Section B), Subject
1 turned left without braking actions, but Subject 6
drove and turned left while controlling the speed.
Analysis of Driving Behavior by Applying LDA Topic Model at Intersection Using VR Simulator
435
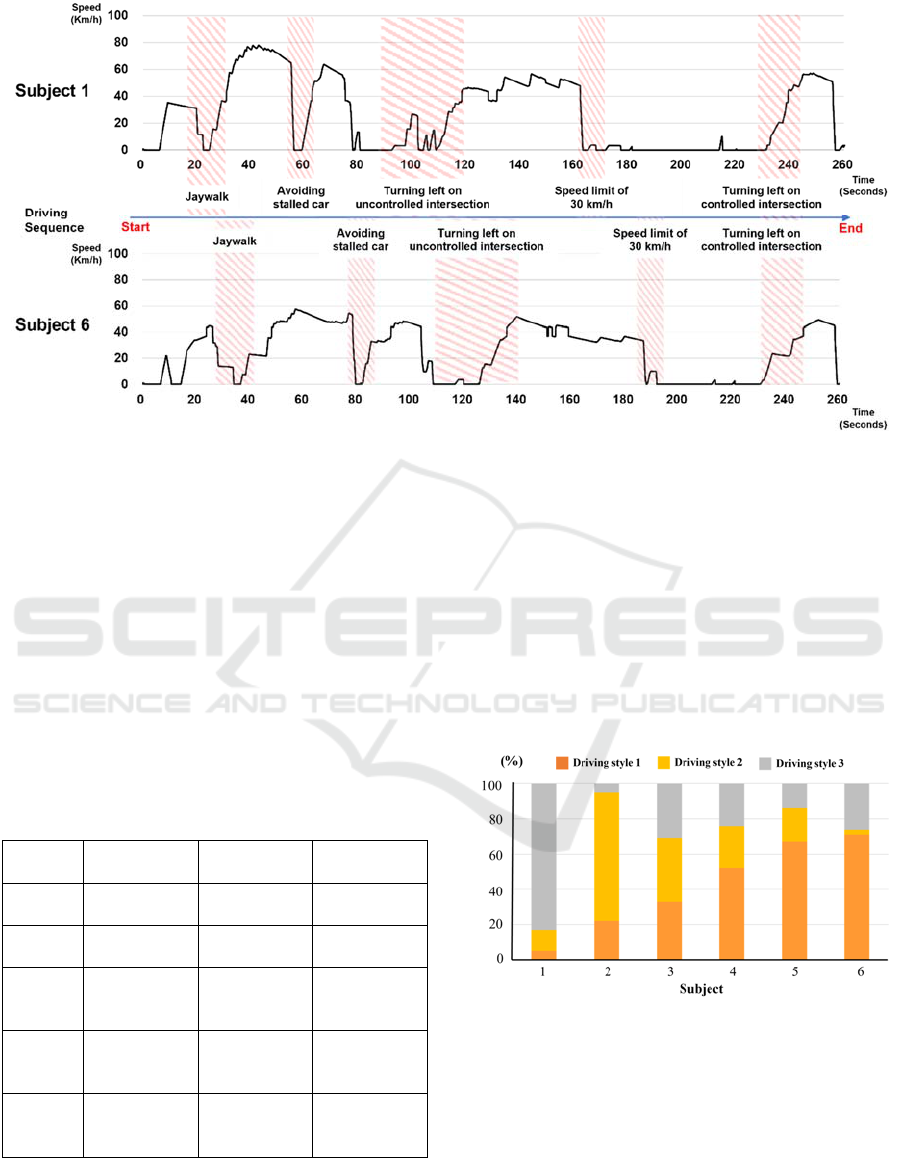
Figure 4: Driving speeds of Subject 1 and Subject 6 during scenario execution.
Table 4 shows the most frequently appearing, top
5 driving behaviors and the objects that the drivers
gazed upon at the intersection with no traffic signals
where the drivers’ driving behaviors were the most
diverse. Figure 5 shows the distribution of driving
styles of participants with the topic model applied. In
Table 4, the first driving style (Style 1) gazes briefly
at the navigation and the side mirror, and then, turns
left at a relatively fast speed. The second (Style 2)
gazes at the navigation and the front road and turns
left at a slow speed while maintaining the speed. The
third (Style 3) repeats fast starts and stops.
Table 4: Top 5 driving behaviors on the scenario at the
intersection with no traffic signal.
Behavior
Style 1
(Counts)
Style 2
(Counts)
Style 3
(Counts)
1
High speed
(
69
)
low speed
(
58
)
Very high
s
p
eed
(
27
)
2
Brake softly
(
44
)
Keep speed
(
47
)
Brake very
hardl
y
(
15
)
3
Look
navigation
shortl
y
(
34
)
Look front
road medium
(
22
)
Very low
speed (13)
4
Look left side
mirror
medium (17)
Look
navigation
medium (7)
Look speed
pointer short
(4)
5
Brake very
softly (12)
Keep brake
(4)
Look traffic
light medium
(2)
Figure 5 shows the distribution of driving styles
composed of the driving behaviors of each
participant. Subject 1 exhibited Style 3 the most
(83%), indicating that he showed a driving behavior
of repeating very fast starts and stops. Subject 2
exhibited Style 2 the most (79%), indicating that she
showed a driving behavior of turning left at a slow
speed while maintaining the speed. Subjects 4, 5, and
6 exhibited Style 1 the most (52%, 66%, and 71%,
respectively), indicating that they showed driving
behavior of turning left at a relatively fast speed after
gazing briefly at the side mirror. Subject 3 exhibited
a mixed driving style (Style 1 33%, Style 2 36%, and
Style 3 31%), different from the other participants.
Figure 5: Distributions of driving styles of each participant
with the topic model applied.
4 DISCUSSION
In most of the driving scenario, the drivers with little
driving experiences exhibited a repeating tendency to
depart and brake suddenly. This is because they
recognized relatively late the events and danger
HEALTHINF 2023 - 16th International Conference on Health Informatics
436

factors that occurred after they had gazed at the
objects in short distances on the road. Additionally,
they only gazed at the road near ahead and the cars on
the side rather than the cars or the danger factors at
longer distance. This is because they gazed long at the
navigation and the speed instrument panel of the car.
The behavior maintaining speed limit was most found
for the drivers having a long driving experience. The
experienced drivers were also found to move at a
higher speed than the less experienced ones while
turning at intersections or on the road with no
neighboring cars. For sudden braking in unexpected
situations, the drivers with little driving experience
braked with 60% or more pressure, while the
experienced drivers used 30% pressure. It was also
found that the experienced drivers recognized
relatively quickly braked in an appropriate distance
when a vehicle moving through the opposite lane
crossed the centerline due to stopped cars. Upon
applying the topic model, Subject 1 exhibited the
most the driving behavior of repeating fast starts and
stops. Such driving behavior seems to be caused due
to gazing often at short intervals at the navigation
panel inside the car and side mirrors rather than the
objects in front due to inexperience in controlling the
vehicle. Subject 2, similar to Subject 1, also did not
have driving experience, but exhibited the driving
behaviors of not pressing the accelerator, moving at
low speed, gazing at the objects for a while when
there were objects ahead, and not increasing the speed
even if there were no objects. On the other hand,
Subjects 4, 5 and 6, having a lot of driving experience,
exhibited the driving behavior of gazing at the side
mirror briefly, turning left at a relatively fast speed,
gazing briefly at the traffic signs and lights and
slowing down or braking lightly. It appears that they
made quick judgments based on the actual driving
experiences by gazing briefly at the objects related to
the traffic (traffic lights, signs, pedestrians) and by
controlling the vehicle speed or the brake only when
necessary. Subject 3 exhibited a mixture of the
classified driving styles. It can be said that Subject 3
exhibited the characteristics of drivers with little
driving experiences in unpredictable situations
maybe because she has weakness toward particular
situations, and in general situations, showed the
characteristics of experienced drivers.
5 CONCLUSIONS
This study collected the data regarding the gaze of
drivers and driving behavior to control the vehicle,
such as accelerator, brake, and speed. The driving
habits of drivers were analyzed and compared by
applying LDA topic modeling converted the collected
data into words. To this end, 6 driving scenarios were
developed, namely intersections with traffic signals
and without signals, pedestrians illegally crossing the
driving lanes, sudden events such as vehicles driving
in the wrong direction, and traffic information to be
recognized visually such as neighboring vehicles,
traffic signs, and traffic lights. Six participants, with
different driving frequencies and distances in the
previous year were compared. The results showed
that lesser the driving experience the drivers had, the
slower was their speed to recognize events and
information related to traffic, and the longer was their
gaze. Especially, while turning left, a large
differences in driving behavior was observed–the
drivers with less driving experiences frequently
repeated sudden starts and stops, whereas the drivers
with a lot of experiences exhibited driving with little
changes in speed.
Future studies need a more detailed classification
by optimizing the number of topics. Studies on the
driving behavior of drivers need to be done with
various driving situations other than intersections.
Moreover, the vehicle control parameters, such as
steering angle and moving out of the lane should be
expanded. The driving behaviors of elderly drivers by
their ages and professional drivers like taxi drivers
should also be compared. In addition, if the driving
behaviors of elderly drivers are studied by expanding
the vehicle control parameters like steering angle and
moving out of the lane, it will be possible to
objectively identify dangerous driving behaviors and
give alarms to restrict driving.
ACKNOWLEDGEMENTS
This work was supported by the National Research
Foundation of Korea (NRF-2020R1A2C1011960)
grant funded by the Korea government (MSIT).
REFERENCES
Miller, K. A., Chapman, P., & Sheppard, E. (2021). A
cross-cultural comparison of where drivers choose to
look when viewing driving scenes. Transportation
research part F: traffic psychology and behaviour, 81,
639-649.
Sun, Q. C., Xia, J. C., He, J., Foster, J., Falkmer, T., & Lee,
H. (2018). Towards unpacking older drivers’ visual-
motor coordination: A gaze-based integrated driving
assessment. Accident Analysis & Prevention, 113, 85-96.
Analysis of Driving Behavior by Applying LDA Topic Model at Intersection Using VR Simulator
437

de Zepeda, M. V. N., Meng, F., Su, J., Zeng, X. J., & Wang,
Q. (2021). Dynamic clustering analysis for driving
styles identification. Engineering applications of
artificial intelligence, 97, 104096.
Martinelli, F., Mercaldo, F., Orlando, A., Nardone, V.,
Santone, A., & Sangaiah, A. K. (2020). Human
behavior characterization for driving style recognition
in vehicle system. Computers & Electrical
Engineering, 83, 102504.
Liao, X., Mehrotra, S., Ho, S., Gorospe, Y., Wu, X., &
Mistu, T. (2022). Driver Profile Modeling Based on
Driving Style, Personality Traits, and Mood States. In
2022 IEEE 25th International Conference on
Intelligent Transportation Systems (ITSC). 709-716.
Bär, T., Nienhüser, D., Kohlhaas, R., & Zöllner, J. M.
(2011). Probabilistic driving style determination by
means of a situation based analysis of the vehicle data.
In 2011 14th International IEEE Conference on
Intelligent Transportation Systems (ITSC) 1698-1703.
Chen, Z., Zhang, Y., Wu, C., & Ran, B. (2019).
Understanding individualization driving states via
latent Dirichlet allocation model. IEEE Intelligent
Transportation Systems Magazine, 11(2), 41-53.
Li, G., Wang, Y., Zhu, F., Sui, X., Wang, N., Qu, X., &
Green, P. (2019). Drivers’ visual scanning behavior at
signalized and unsignalized intersections: A naturalistic
driving study in China. Journal of safety research, 71,
219-229.
Lang, Y., Wei, L., Xu, F., Zhao, Y., & Yu, L. F. (2018).
Synthesizing personalized training programs for
improving driving habits via virtual reality. In 2018
IEEE Conference on Virtual Reality and 3D User
Interfaces (VR), pp. 297-304.
González-Ortega, D., Díaz-Pernas, F. J., Martínez-
Zarzuela, M., & Antón-Rodríguez, M. (2020).
Comparative analysis of kinect-based and oculus-based
gaze region estimation methods in a driving simulator.
Sensors, 21(1), 26.
Jelodar, H., Wang, Y., Yuan, C., Feng, X., Jiang, X., Li, Y.,
& Zhao, L. (2019). Latent Dirichlet allocation (LDA)
and topic modeling: models, applications, a survey.
Multimedia Tools and Applications, 78(11), 15169-
15211.
Merino, S., & Atzmueller, M. (2018). Behavioral topic
modeling on naturalistic driving data. Proceedings of
BNAIC. Jheronimus Academy of Data Science, Den
Bosch, The Netherlands.
Qi, G., Wu, J., Zhou, Y., Du, Y., Jia, Y., Hounsell, N., &
Stanton, N. A. (2019). Recognizing driving styles based
on topic models. Transportation research part D:
transport and environment, 66, 13-22.
HEALTHINF 2023 - 16th International Conference on Health Informatics
438
