
Mathematical Morphology Based Volumetric Analysis of Bone
Density Around Implant in Post-Operational Follow-up of
Per-Trochanteric Fractures
Robertas Petrolis
1,2 a
, Vėtra Markevičiūtė
4b
, Šarūnas Tarasevičius
4c
, Deepak Raina
5d
,
Lars Lidgren
5e
, Saulius Lukoševičius
3f
and Algimantas Kriščiukaitis
1,2 g
1
Department of Physics, Mathematics and Biophysics, Lithuanian University of Health Sciences,
Eiveniu str. 4, Kaunas, Lithuania
2
Neuroscience Institute, Lithuanian University of Health Sciences,
Eiveniu str. 4, Kaunas, Lithuania
3
Department of Radiology, Lithuanian University of Health Sciences,
Eiveniu str. 2, Kaunas, Lithuania
4
Department of Orthopaedics and Traumatology, Lithuanian University of Health Sciences,
Eiveniu str. 2, Kaunas, Lithuania
5
Faculty of Medicine, Department of Clinical Sciences Lund, Lund University, Sweden
Keywords: Femoral Head, Implant, Dynamic Hip Screw, Point Cloud, Mathematical Morphology.
Abstract: Per trochanteric fractures are common in an ageing population with osteoporosis and account for about half
of all hip fractures. Treatment of per trochanteric fractures with extramedullary or intramedullary implants is
challenging especially in unstable fractures. In order to improve the mechanical anchorage of the screw and
prevent re-operations, various attempts have been made to reinforce the fragile bone with polymer based
injectable materials. However, volumetric control of delivered material and/or measurement of bone density
in post-operative follow-up remains challenging. This study presents the basic principles of a new algorithm
for CT based volumetric analysis of the bone density in the region adjacent to the implant in the femoral head
in comparison to the non-operated hip. The method was also used to track long term bone density changes at
3 to 6 months of follow up.
1 INTRODUCTION
Per trochanteric fractures are common in elderly, and
account for about half of all hip fractures (Hermann
et al. 2012). Treatment of per trochanteric fractures
with extramedullary or intramedullary implants is
challenging because of poor bone quality, which
eventually leads to reoperations in up to 5% of the
cases mainly in unstable fractures. Special
mechanical solutions are proposed to cope with the
problem of implant anchorage (Aros et al. 2008). In
a
https://orcid.org/0000-0003-3487-733X
b
https://orcid.org/0000-0003-1009-5042
c
https://orcid.org/0000-0003-1013-3766
d
https://orcid.org/0000-0001-8767-892X
e
https://orcid.org/0000-0002-5204-1029
f
https://orcid.org/0000-0002-8725-4737
g
https://orcid.org/0000-0003-4392-1937
order to improve the mechanical anchorage of the
screw and prevent re-operations, various attempts
have been made to reinforce the fragile bone with
polymer based injectable materials, such as poly
methyl methacrylate (PMMA) (Stoffel et al., 2008;
Gupta et al., 2012) or Calcium phosphate (CaP)
(Mattsson and Larsson, 2004; Fuchs et al., 2019).
Bioresorbable calcium sulphate/hydroxyapatite
(CaS/HA) is reported as a promising solution of
implant anchoring problem. The compressive
strength of the material is higher than the cancellous
110
Petrolis, R., Markevi
ˇ
ci
¯
ut
˙
e, V., Tarasevi
ˇ
cius, Š., Raina, D., Lidgren, L., Lukoševi
ˇ
cius, S. and Kriš
ˇ
ciukaitis, A.
Mathematical Morphology Based Volumetric Analysis of Bone Density Around Implant in Post-Operational Follow-up of Per-Trochanteric Fractures.
DOI: 10.5220/0011714600003414
In Proceedings of the 16th International Joint Conference on Biomedical Engineering Systems and Technologies (BIOSTEC 2023) - Volume 2: BIOIMAGING, pages 110-114
ISBN: 978-989-758-631-6; ISSN: 2184-4305
Copyright
c
2023 by SCITEPRESS – Science and Technology Publications, Lda. Under CC license (CC BY-NC-ND 4.0)

bone (Nilsson et al., 2003). A recent study (Kok et al.,
2021) has verified that the CaS/HA material spreads
in the trabecular structures and protects the bone from
fracturing at low loads compared to control trabecular
bone. Special procedures during per trochanteric
fracture surgery and control of the delivery of
CaS/HA at the interface of lag-screw and osteoporotic
bone can enhance the immediate anchorage (Raina et
al. 2022). The biological anchorage can be further
increased by systemically administering zoledronic
acid (ZA), a bisphosphonate that seeks the HA
material placed around the implant and induces
cancellous bone regeneration. However, precise
volumetric control of material delivery and/or bone
density in post operational follow-up remains
challenging. Areal bone mineral density obtained
from dual energy X-ray absorptiometry (DEXA),
currently used in osteoporosis diagnostics, could now
be outperformed by volumetric bone mineral density
estimated by peripheral quantitative computed
tomography (pQCT) (Watcher et al. 2001). In case of
per trochanteric fractures treatment with implants,
pQCT could be used for both: volumetric control of
material delivery and measurement of longitudinal
bone density changes. Volumetric representation and
precise delineation of volume of interest surrounding
the implant in bone allows the follow up of bone
density and implant anchoring during the whole
treatment process.
The aim of this study was to elaborate a
volumetric analysis of region surrounding the implant
in femur and algorithms for evaluation of bone
density changes over time and in regard to non-
operated areas.
2 METHODS
Trochanteric fracture patients undergoing internal
fixation with a dynamic hip screw (DHS) system
were included in the study at the department of
Orthopaedics and Traumatology, Lithuanian
University of Health Sciences. The study was
ethically approved by the hospital ethics board (P1
BE-2-76/2019). In the control group, all patients were
treated per standard care guidelines and were given a
systemic infusion of zoledronic acid, 1-2 weeks post-
surgery. The experimental arm consisted of DHS
augmented with a CaS/HA biomaterial followed by
systemic ZA administration. A volumetric imaging of
pelvic region of 9 patients (3: control, 6: treatment)
was performed by applying a GE Revolution™
Discovery™ HD CT machine (GE Healthcare,
Waukesha, WI). Slice thickness was 0,625 mm,
matrix of 512*512, postprocessing was not applied,
each voxel was representing 0.70312 x 0.70312 x
0.625 mm of space. The intensity of images was 256
levels resolution represented in Hounsfield units.
Points of metal implant had a few fold higher
intensities over the rest of points representing bone or
muscle tissues. Therefore, they were forming an easy
delineable reference object for determination of
volume of interest. Actual volume of interest –
implant surrounding environment – was determined
using 3D mathematical morphology procedure
“dilation” (MatLab function “imdilate”, using
“sphere” structural element):
𝐴
⨂𝐵 𝑧|𝐵
∩ ∅ , (1
)
while 𝐵
is the reflection of the structuring element B.
In other words, it is the set of pixel locations z, where
the reflected structuring element overlaps with
foreground pixels in A when translated to z. The
procedure selects points surrounding the reference
object. We used 7-point radius structural element to
select whole volume of interest, excluding the closest
space to the implant selected by 1-point radius
structural element. The final volume of interest was
14-voxel-thick environment surrounding the implant
and excluding 2-voxel-thick closest points to the
metal implant. Considering the voxels’ size, it
roughly could be estimated as 10 mm – thick
environment around the metal. Such volume of
interest was accepted by experts as most suitable for
implant anchoring and bone density investigations.
Determined volume of interest was transformed into
point cloud representation, where every point at
certain coordinates was carrying information about
original intensity of CT-scan representation in
Hounsfield units.
Reference volume of interest was taken from the
counterpart volume on the other side of the body –
non-operated femur. As far the anatomical pelvis-
femur structures on the left and the right side are
almost symmetric, we identified the vertical axis of
symmetry of pelvis and aligned flipped point cloud
representation of operated pelvis-femur side to the
non-operated one. For this procedure we used sparse
point cloud representation of the structures only by
selected key-points, having empirically selected
intensity of 470 - 480 Hounsfield units. It resulted in
representation of bone structures by roughly 50000
points instead of 13000000 original representation
points. The validity of representation was visually
controlled by the experts. Such reduction in
representation allowed stable and comparatively
quick operation of point cloud alignment procedures
(Matlab functions “pcregistericp”; “pctransform”)
Mathematical Morphology Based Volumetric Analysis of Bone Density Around Implant in Post-Operational Follow-up of Per-Trochanteric
Fractures
111
and gave visually confirmed good result. The
obtained point cloud transformation matrix was used
to transform coordinates of point cloud, representing
determined implant surrounding environment, to
obtain image intensities in reference region of interest
on the unoperated side. The described procedure
allowed to compare the bone density around the
implant to the unoperated reference side. Graphical
representation in form of point cloud of the
differences can reveal detailed changes in bone
density.
Long term follow-up of the bone density changes
around the implant was based on the same principle
of spatial alignment by sparse representations of the
bone structures. At this time, compared CT
volumetric representations were taken in 3- or 6-
months interval, so, spatial point cloud
representations of compared structures eventually can
have certain geometrical differences. Therefore, we
estimated differences in points of compared clouds,
which were pairwise closest to each other by
Euclidean distance in space. Pairs of such closest
points in compared point clouds were found using the
Kd-tree based search algorithm (Muja et al. 2009)
(MatLab function “findNearestNeighbors”).
3 RESULTS
Process of volume of interest determination in CT
scan volumetric lower body representation is
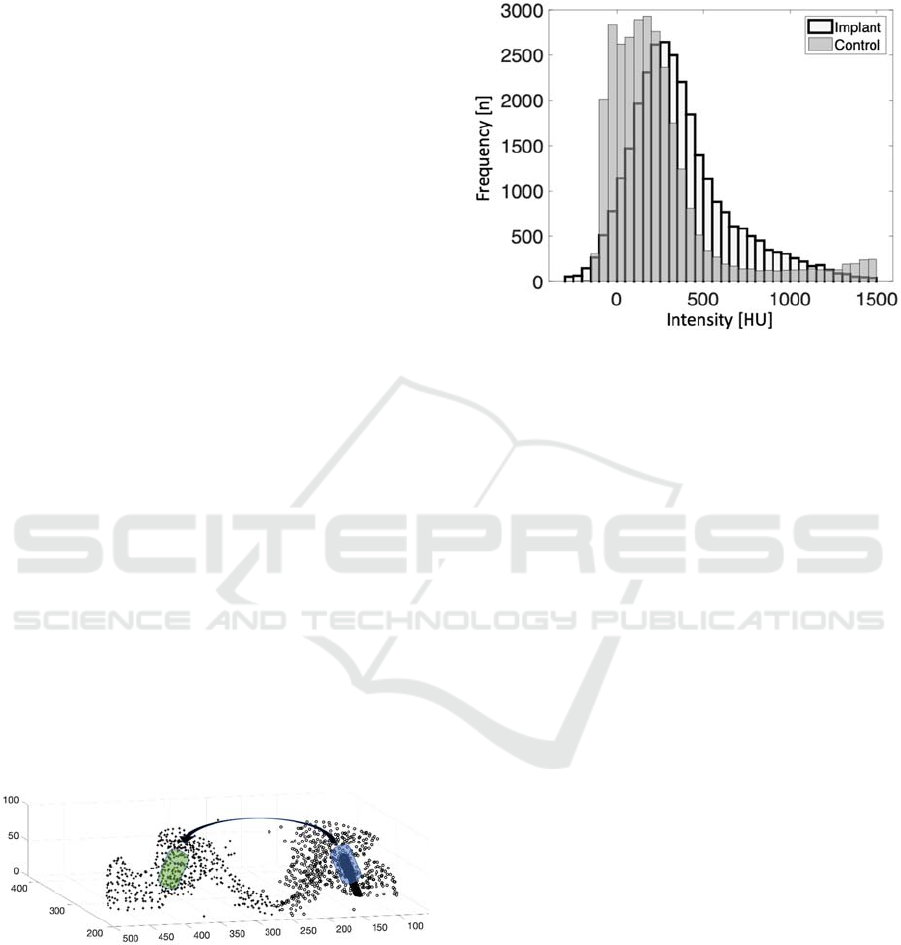
illustrated in Figure 1 by typical real clinical image.
The key-points selected for sparse spatial
representation of left and right parts of pelvis area are
marked by “o” and “+” respectively. Implant, as solid
body, is shown in black. Implant surrounding
environment is shown in blue.
Figure 1: Sparse representation of left and right pelvis for
determination of region of interest surrounding the implant
(blue cylinder body) and its counterpart on the opposite side
(green cylinder body). The number of points representing
structure of pelvis here is reduced for visual clarity.
After determination of implant surrounding
environment, the sparsely represented spatial
structure (marked by “o”) is flipped and aligned to its
counterpart on the other side (marked by “+”). The
corresponding volume in the unoperated side is
marked in green as control volume of interest. The
whole procedure can be visually controlled.
Figure 2: Histograms of intensity values of implant
surrounding environment together with counterpart
environment from unoperated side.
Histogram of intensity values of implant and the
surrounding cancellous bone compared with the
unoperated side is presented in Figure 2. As one can
notice, bone density adjacent to implant is
significantly higher than in control volume from the
unoperated side. Detail spatial distribution of
differences across the whole volume of interest is
obtained by 3-D presentation of points in actual space
positions where differences are represented by colour
and marker size. Such representation is illustrated in
Figure 3 and revealed a noticeably bigger differences
are situated close to the implant surface in patient
where CaS/HA filling was used to enhance anchorage
of the implant (see right side of the graph). There is
no such clearly visible difference in case when
CaS/HA filling was not used.
Histograms of bone density differences in cases
illustrated in Figure 3 are presented in Figure 4. This
is preliminary, yet promising result, showing the
increased bone density when CaS/HA filling was
used.
Example of investigation results of long-term
changes in bone density during three months follow-
up is shown as histograms of spatial points intensity
in implant surrounding environment immediately
after operation and after three months (Figure 5).
Slightly visible difference in histogram
supplemented by spatial representation of pairwise
comparison of intensities in each point of point cloud
of implant surrounding environment gives much
more detailed diagnostic information (Figure 6).
BIOIMAGING 2023 - 10th International Conference on Bioimaging
112
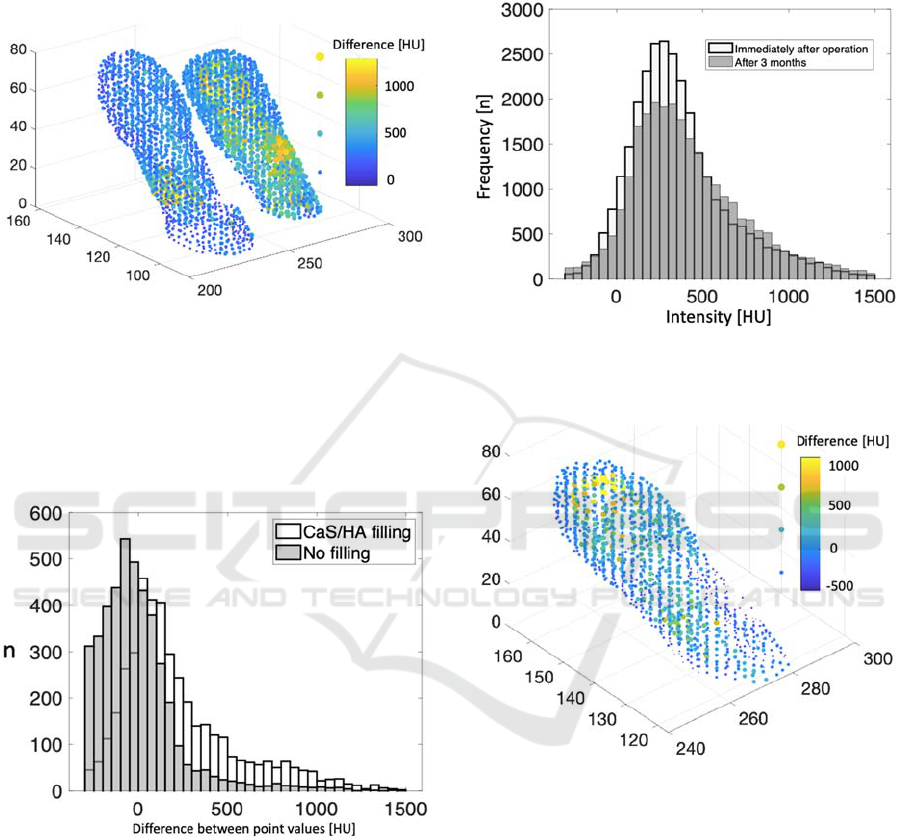
Most visible positive changes in bone density
after three months are in the implant surrounding
area, at the tip of the implant. It is a promising result
showing that bone density increased at the region
where most of CaS/HA filling was delivered.
Figure 3: 3-D presentation of points of implant surrounding
environment in actual space positions in the patient when
CaS/HA filling was used (right side) and in the contralateral
side of the same patient where no filling was used (left
side). The differences between intensity of implant
surrounding environment and counterpart unoperated side
are represented by colour and marker size as indicated on
the right side of the graph.
Figure 4: Histograms of bone density differences in case
when CaS/HA filling was used compared with un-
augmented controls. The data are from cases illustrated in
Figure 3.
4 DISCUSSION
Dual energy X-ray absorptiometry (DEXA),
routinely used for evaluation of bone mineral density
in osteoporosis diagnostics gives Ca concentrations
estimates in absolute values. However, the region of
interest for estimates could not be defined so
precisely as we show for CT-scan volumetric images.
Usage of calibrating technics, as in peripheral
quantitative computed tomography, could offer
acceptable precision for Ca concentration estimation.
Figure 5: Histograms of intensity values of implant
surrounding environment immediately after operation and
after 3 months.
Figure 6: 3-D presentation of differences between intensity
of implant surrounding environment immediately after
operation and after three months.
On the other hand, we are mostly interested in
changes of Ca concentration than absolute values
during post operational follow up, therefore CT-scan
volumetric imaging supplemented with algorithms of
precise determination of volumes of interest, as we
present here, could outperform DEXA in diagnostic
value.
The presentation of volume of interest as point
cloud gives us the new possibilities of facile data
management and evaluation using comparatively
small computational resources. Methods of spatial
transform and alignment allow to perform detailed
Mathematical Morphology Based Volumetric Analysis of Bone Density Around Implant in Post-Operational Follow-up of Per-Trochanteric
Fractures
113

comparison of intensity in every particular spatial
point of real investigated object. Point-to-point
comparison of intensities revealed detail dynamics in
bone density caused by implant insertion and special
chemical means to reinforce implant anchorage.
Detail 3D representation of differences in bone
density gives us a visual control for selection of
difference estimates to be used for evaluation of
effect of chemical reinforcement materials used. In
this study we have very limited amount of patient data
and we show only preliminary results. However, the
aim of this study was to show the technical means to
be used in such studies and to reveal the directions of
further development.
One of the challenging tasks revealed in this
process was determination of volume of interest in the
particular anatomical structures (counterpart volume
of interest in the unoperated side) – determination of
reference points. In this work we selected the points
in the lower body CT scan according the intensity,
which was empirically selected by visual control. The
expert was aiming to have as much as possible area
of pelvis to be represented with minimal number of
points. After several attempts we ended up with
roughly 50000 points selected out of 13000000
original representation points. Changing the number
of selected points even by 2-folds up or down from
the used one did not have any significant impact on
accuracy of spatial representation and subsequent
alignment procedures. Nevertheless, additional
investigation of optimal number of points and
methods of their selection is needed. We simply
selected the existing original points of volume
representation, but construction of new reference
points in regard to local geometric properties of
special anatomic structures would be a promising
direction of investigations.
5 CONCLUSION
Point cloud presentation of objects or volumes of
interest in volumetric CT-scan data reveals the new
possibilities of facile data management and
evaluation using comparatively small computational
resources at the same time giving the valuable
diagnostic results.
REFERENCES
Herman A, Landau Y, Gutman G et al (2012) Radiological
evaluation of intertrochanteric fracture fixation by the
proximal femoral nail. Injury 43:856–863.
doi:10.1016/j.injury.2011.10. 030
Aros B, Tosteson AN, Gottlieb DJ et al (2008) Is a sliding
hip screw or im nail the preferred implant for
intertrochanteric fracture fixation? Clin Orthop Relat
Res 466:2827–2832. doi:10. 1007/s11999-008-0285-5
Stoffel, K. K., Leys, T., Damen, N., Nicholls, R. L., and
Kuster, M. S. (2008). A New Technique for Cement
Augmentation of the Sliding Hip Screw in Proximal
Femur Fractures. Clin. Biomech. 23, 45–51.
doi:10.1016/j.clinbiomech.2007.08.014
Gupta, R., Gupta, V., and Gupta, N. (2012). Outcomes of
Osteoporotic Trochanteric Fractures Treated with
Cement-Augmented Dynamic Hip Screw. Indian J.
Orthop. 46, 640–645. doi:10.4103/0019-5413.104193
Mattsson, P., and Larsson, S. (2004). Unstable Trochanteric
Fractures Augmented with Calcium Phosphate Cement:
a Prospective Randomized Study Using
Radiostereometry to Measure Fracture Stability. Scand.
J. Surg. 93, 223–228. doi:10.1177/145749690409300310
Fuchs, A., Langenmair, E., Hirschmüller, A., Südkamp, N.,
and Konstantinidis, L. (2019). Implant Augmentation
for Trochanteric Fractures with an Innovative, Ready to
Use Calcium-Phosphate-Cement. J. Orthopaedics Bone
Res. 1, 104. doi: 10.3389/fbioe.2022.816250
Kok, J., Törnquist, E., Raina, D., Le Cann, S., Novak, V.,
Sirka, A., et al. (2021). “Fracture Behavior of a
Composite of Bone and Calcium Sulfate/
hydroxyapatite,” in XXVIII Congress of the
International Society of Biomechanics, Remote,
France, July, 2021. doi: 10.1016/j.jmbbm.2022.105201
Nilsson, M., Wielanek, L., Wang, J. S., Tanner, K. E., and
Lidgren, L. (2003). Factors Influencing the
Compressive Strength of an Injectable Calcium Sulfate-
Hydroxyapatite Cement. J. Mater. Sci. Mater. Med. 14,
399–404. doi:10. 1023/a:1023254632704
Raina DB, Markevičiūtė V, Stravinskas M, Kok J, Jacobson
I, Liu Y, Sezgin EA, Isaksson H, Zwingenberger S,
Tägil M, Tarasevičius Š and Lidgren L (2022) A New
Augmentation Method for Improved Screw Fixation in
Fragile Bone. Front. Bioeng. Biotechnol. 10:816250.
doi: 10.3389/fbioe.2022.816250
N.J Wachter, P Augat, M Mentzel, M.R Sarkar, G.D
Krischak, L Kinzl, L.E Claes, Predictive value of bone
mineral density and morphology determined by
peripheral quantitative computed tomography for
cancellous bone strength of the proximal femur, Bone,
Volume 28, Issue 1, 2001, 133-139, doi:10.1016/
S8756-3282(00)00455-5
Muja, M. and David G. Lowe. "Fast Approximate Nearest
Neighbors with Automatic Algorithm Configuration".
In VISAPP International Conference on Computer
Vision Theory and Applications. 2009. pp. 331–340.
doi:10.5220/0001787803310340.
BIOIMAGING 2023 - 10th International Conference on Bioimaging
114
