
Automatic Defect Detection in Leather
Jo
˜
ao Soares
1
, Lu
´
ıs Magalh
˜
aes
1
, Rafaela Pinho
2
, Mehrab Allahdad
2
and Manuel Ferreira
2
1
ALGORITMI Research Centre / LASI, University of Minho, Portugal
2
Neadvance, Braga, Portugal
Keywords:
Machine Learning, Leather, Defects Detection, Novelty Detection.
Abstract:
Traditionally, leather defect detection is manually solved using specialized workers in the leather inspection
process. However, this task is slow and prone to error. So, in the last two decades, distinct researchers
proposed new solutions to automatize this procedure. At this moment, there are already efficient solutions
in the literature review. However, these solutions are based on supervised machine learning techniques that
require a high-dimension dataset. As the leather annotation process is time-consuming, it is necessary to find
a solution to overcome this challenge. So, this research explores novelty detection techniques. Moreover, this
work evaluates SSIM Autoencoder, CFLOW, STFPM, RDOCE, and DRAEM performances on leather defects
detection problem. These techniques are trained and tested in two distinct datasets: MVTEC and Neadvance.
These techniques present a good performance on MVTEC defects detection. However, they have difficulties
with the Neadvance dataset. This research presents the best methodology to use for two distinct scenarios.
When the real-world samples have only one color, DRAEM should be used. When the real-world samples
have more than one color, the STFPM should be applied.
1 INTRODUCTION
Leather is a natural material derived from cattle hides
through a set of physical and chemical processes. It
has been used for a very long time to shield people
from the weather, keeping their bodies dry and their
temperatures steady. It is still used to create high-
quality products like clothing, shoes, purses, and fur-
niture. Because leather is a soft, flexible, and durable
material,
In many developing countries, cattle raising plays
a critical role in their economic system, being the
meat industry the principal economic financial return.
However, the value of the cattle hides can represent
3% to 10% of the animal’s market value (ALLPI,
2016). So it is important to maximize the leather sell-
ing price. At this moment, the following question
emerged ”What defines the leather selling price?”.
The main factor is the percentage of defective areas
present in a leather piece. The presence of wrinkles,
cuts, tick bites, stains, and hot iron marks can reduce
the leather piece’s selling price. A leather sample with
a reduced defective area is beneficial for cattle pro-
ducers because they sell the leather at a higher price
and it is also beneficial for leather goods producers.
Because, leather goods produced using non-defective
leather reduce the number of defective products, in-
creasing the profit.
Traditionally, the leather inspection process is
manual, the workers manipulate the leather samples
from distinct points of view to detect defects. Even
using specialized workers for this task, the perfor-
mance of the manual task is low. The defects are very
difficult to detect and after some hours of work, the
human vision is tired, reducing the defect detection
performance. Beyond that, this process is very slow.
So, in the last two decades, distinct researchers started
to look for automated solutions for these tasks. Using
an automated solution, they pretend to increase the
number of defects detected and reduce the inspection
time.
The related work splits into two: solutions based
on Machine Learning (ML) and Deep Learning (DL).
The ML solutions extract features using Computer Vi-
sion (CV) techniques, like edge detectors and statisti-
cal features, to learn to detect defects using supervised
ML algorithms. One of the first works applies X
2
cri-
teria to compute the difference between the grey-level
histogram of a standard image and an inspected image
(Georgieva et al., 2003). This criterion worked be-
cause, defective samples generate distinct histograms
from the standard histogram, allowing defects detec-
tion. Recent research proposes to detect tick bite de-
fects on calf leather (Liong et al., 2019). The authors
use hand-crafted feature descriptors to extract local
information on leather patches. The hand-crafted fea-
196
Soares, J., Magalhães, L., Pinho, R., Allahdad, M. and Ferreira, M.
Automatic Defect Detection in Leather.
DOI: 10.5220/0011707000003417
In Proceedings of the 18th International Joint Conference on Computer Vision, Imaging and Computer Graphics Theory and Applications (VISIGRAPP 2023) - Volume 5: VISAPP, pages
196-204
ISBN: 978-989-758-634-7; ISSN: 2184-4321
Copyright
c
2023 by SCITEPRESS – Science and Technology Publications, Lda. Under CC license (CC BY-NC-ND 4.0)

tures were obtained from statistical approaches like
the histogram of pixel intensity values, histogram of
oriented gradient, and local binary pattern from edge
detector results. The extracted features were com-
bined to detect tick bites using supervised techniques
such as decision tree, discriminant analysis, Support
Vector Machine (SVM), K-Nearest Neighbor (KNN),
and some ensemble classifiers. For the statistical ap-
proach, the histogram of pixel intensity values com-
bined with SVM obtains the best result with 80%
accuracy. In this research, the authors also experi-
ment with an ANN using ApproxCanny as the pre-
processing, obtaining 82.49% classification accuracy.
In 2020, statistical techniques are also used to ex-
tract local features from image patches (Gan et al.,
2020). They obtain the statistical features from the
histogram of pixel intensity: median, variance, skew-
ness, kurtosis, lower quartile value, and upper quartile
value. After that, the K-S test selects the three rep-
resentative statistical features from image patches to
train a KNN. As a result, the proposed solution ob-
tains an accuracy of 97% in one of the datasets. In
another research, the authors present an automated
system for detecting and classifying defects (scars,
scratches, and pinholes) on the leather surface (Bong
et al., 2019). The authors use morphological opera-
tions in a pre-processing step to highlight defective re-
gions. Thereafter, the Laplacian operator was applied
to threshold the defect boundary. Before the classifi-
cation task, it was necessary to collect features from
the leather images. In that paper, the author extracts
features like color moments, color correlograms, and
Zernike moments. With these features, it was possi-
ble to train a SVM model with a Radial basis kernel
to classify defects on the leather surface. This ap-
proach obtained a good performance with more than
98% of accuracy. Other solutions emerged in the last
years based on DL. In 2020, an experiment ensembled
models to automatize the leather inspection (Aslam
et al., 2020). Firstly, EfficientNet-B3 and DenseNet-
201 were trained from scratch using the skin, con-
crete, and ImageNet datasets, combining knowledge
from distinct domains. After that, the models fine-
tune with leather image data. They verified that using
transfer learning with the ImageNet dataset had bet-
ter results than using the skin and concrete dataset.
Thus, different models trained by transfer-learning
with ImageNet and fine-tuned by leather image data
were ensemble because ensemble models obtain a
higher accuracy than a single classifier. In the end,
they conclude that EfficientNet-B3+ResNext-101 are
the best models to ensemble for this problem. Also
in 2020, a research suggests a leather defect classifi-
cation and segmentation system following five steps
(Liong et al., 2020). The first is image elicitation
where images are captured by a 6-DOF robot arm.
In step two, images are selected to remove ambigu-
ity, and in step three images are pre-processed. Af-
ter that, in step four, the images are annotated to ob-
tain the ground truth labeling to be able to train su-
pervised models. In the end, defect classification and
segmentation models are trained and tested. In the
classification task, they propose to use a pre-trained
network to classify defects in three classes (no de-
fect, black line, and wrinkle). The architecture cho-
sen was AlexNet trained in the ImageNet dataset. The
highest three-category classification performance ob-
tained using the proposed method is 95% accuracy.
For the segmentation task, convolutional and decon-
volutional neural networks were used and the chosen
architecture is U-Net. The mean IoU and the mean
pixel accuracy achieve are 99% and 99% respectively.
The previously mentioned solutions require a su-
pervised dataset. As dataset acquisition is a time-
consuming process and requires specialized workers
to annotate the leather samples, supervised techniques
are not an option to solve this problem. Beyond
that, the leather samples available are unbalanced, and
most of the samples are non-defective. So, this work
explores an unsupervised approach, known as nov-
elty detection, capable of discriminating anomalous
pixels, and learning the non-defective pattern. This
work experiments five novelty detection techniques,
a reconstruction based technique (Bergmann et al.,
2019b), and three Embedding Similarity based tech-
niques: CFLOW (Gudovskiy et al., 2022), Student-
Teacher Feature Pyramid Matching (STFPM) (Wang
et al., 2021) and Reverse Distillation from One-Class
Embedding (RDOCE) (Deng and Li, 2022). Beyond
these methodologies, Discriminatively Trained Re-
construction Anomaly Embedding Model (DRAEM)
(Zavrtanik et al., 2021) is used to convert the unsu-
pervised problem into a supervised problem to de-
tect defects using supervised architectures. In ta-
ble 1, there are presented the AUROC results of the
mentioned Novelty Detection techniques on Leather
MVTEC dataset (Bergmann et al., 2019a).
Table 1: Novelty Detection techniques AUROC results on
Leather MVTEC dataset.
Model Detection Localization
SSIM AE - 78.00%
CFLOW 98.26% 98.62%
STFPM 95.50% 97.00%
RDOCE 100% 99.10%
DRAEM 98.0% 97.30%
In summary, the contributions of this research
work are listed as follows:
Automatic Defect Detection in Leather
197

1. A presentation of the disadvantages of the leather
detection state-of-art solutions;
2. A presentation of a novelty detection approach
and experiments with five novelty detection-based
methodologies;
3. A report on the experiments results and present
the best methodology for distinct real-world sce-
narios.
The rest of the paper is structured as follows. Sec-
tion 2 presents the novelty detection approach in de-
tail. The experiment configuration, such as the two
databases used and evaluation metrics, are presented
in Section 3. The results are discussed in Section 4
and finally, the conclusions are presented in Section
5, suggesting the methodologies that should be used
in distinct scenarios.
2 METHODOLOGY
The novelty detection approach was developed to
solve problems like this, where the presence of
anomalous samples (outliers) are rare. The novelty
detection techniques learn the pattern from the unsu-
pervised dataset samples. As most of the data ele-
ments from the real-world scenario are non-defective
(inliers), the novelty detection technique learns the in-
lier’s sample pattern (Bergmann et al., 2019a). This
approach can also be used to detect defects in images.
In this case, the novelty techniques learn to produce
anomaly score maps using non-defective images. In
the inference phase, when the technique is presented
with defective images, the anomaly score maps pro-
duced should attribute high scores to the unknown
patterns, in other words, to the defective regions.
The novelty detection techniques have two main cat-
egories: Reconstruction-based and Embedding Sim-
ilarity based. Reconstruction-based techniques learn
to encode and reconstruct inlier samples and should
fail on outliers sample reconstruction. In this ap-
proach, architectures like Autoencoders (AE), Vari-
ational AE, and Generative Adversarial Networks can
be used to reconstruct the image samples. The recon-
struction methods can localize the anomalies using
pixel error or a structural similarity function. On other
hand, the Embedding Similarity-based techniques use
pre-trained DL networks to extract image features.
After that, the extracted features are combined to cre-
ate an anomaly score map. One advantage of the em-
bedding methods is the different layers of vector ex-
traction. In this way, if the output extracted is from the
first layers, the features obtained will represent small
defects. If the extracted output is from the last layers,
the obtained features will represent large defects.
3 EXPERIMENTS
In this research, to evaluate the novelty detection tech-
niques, there are proposed three distinct experiments
using the Novelty Detection techniques:
• Experiment 1 - Train and evaluate the tech-
niques with MVTEC dataset and with Neadvance
dataset;
• Experiment 2 - Train with MVTEC dataset and
evaluate with Neadvance dataset, and vice versa;
• Experiment 3 - Train the techniques with both
datasets and evaluate for MVTEC and Neadvance
datasets;
The first experiment is a baseline experiment to
evaluate the ability of the Novelty Detection tech-
niques detects defects with the same leather pattern
as used during the training. The second experiment
is performed to evaluate the generalization ability of
these techniques. Check if the techniques can detect
defects from samples with different patterns than the
used during the training. The third experiment was
performed to verify if a larger dataset, combining the
color patterns from both datasets can obtain better re-
sults than Experiment 1.
3.1 Datasets
In this research, two different datasets were used to
apply novelty detection techniques. One is made up
of the leather samples from MVTec AD dataset, while
the other is a dataset created using images captured
by Neadvance. MVTec AD is a dataset for anomaly
detection. It has been used as a benchmark image
dataset in the most current researches. It includes
leather samples and has 5000 images distributed over
fifteen different categories. There are 123 images for
testing and 235 images for training in the MVTec
leather dataset. There are 42 normal images in the test
dataset, 19 with color defects, 19 with cut defects, 17
with fold defects, 19 with glue defects, and 17 with
poke defects. There is a ground truth mask for each
test image. The test dataset of this dataset only con-
tains 2.7 percent anomalous pixels. There is an image
of each MVTEC defect type in Figure 1
Using the Neadvance defective images and the
corresponding annotations, the second dataset was
created. It has 211 defective images, 40 with cut
defects, 47 with hole defects, 52 with line defects,
and 82 with wrinkle defects. Non-defective samples
VISAPP 2023 - 18th International Conference on Computer Vision Theory and Applications
198

(a) Color (b) Cut (c) Fold
(d) Glue (e) Poke
Figure 1: MVTEC leather defect samples.
are not present in the initial dataset. In order to cre-
ate non-defective samples, the non-defective regions
from the defective samples were cropped. 42 and 260
non-defective areas, respectively, were cropped for
testing and training. The 211 defective samples and
42 non-defective regions compose the testing dataset.
The defects shown in this dataset are harder to find
than MVTEC. There is an illustration of each Nead-
vance defect type in the Figure 2.
(a) Cut (b) Line
(c) Hole (d) Wrinkle
Figure 2: Neadvance leather defect samples.
3.2 Metrics
In this study, selecting the appropriate evaluation met-
rics is critical for evaluating the presented approaches.
For this problem, it is important to evaluate two tasks,
defects localization (segmentation) and detection (bi-
nary classification). One of the metrics employed
for the localization task is Intersection Over Union
(IOU), a popular metric for segmentation problems.
Per-region Overlap (PRO) is also used, it is popu-
lar in others anomaly detection researches, such as
(Defard et al., 2021). PRO instead of treating ev-
ery pixel as independent, averages the performance
over each connected component of the ground truth
(Bergmann et al., 2021). IoU and PRO are threshold
dependent, in other words, require a threshold to bi-
narize the anomaly score maps to obtain the predicted
mask. To evaluate the techniques independently of
the estimated threshold, it is used the Area Under Re-
ceiver Operating Characteristic Curve (AUROC). Ad-
ditionally, the AUROC is utilized to evaluate the de-
fects detection task, comparing the maximum value
of the anomaly scores map with the ground truth la-
bel (defective or not). Furthermore, because the mea-
sure was threshold dependent, F1-Score was selected,
which considered as defective every predicted mask
with at least one defective pixel.
3.3 Thresholds
For these experiments, three distinct thresholds are
used. Using a small sample of training images, the
p-Quantile was used to estimate the first threshold
(T1). The p-Quantile chooses a threshold such that
a percentage p of the threshold distribution pixels are
classified as being free of anomalies (outlier). The p-
value for this method was set at 99, which is the state
of the art for outlier detection. The second and third
thresholds (T2 and T3) use the small set of the testing
dataset to estimate a threshold that optimizes the F1-
Score for localization and defects detection, respec-
tively. Using the source code from the Gudovskiy
repository
1
, T2 and T3 are estimated.
3.4 Training and Evaluation Setup
In this experiment, the techniques are trained using
70% of the training dataset. The techniques train uti-
lizing reshaped 256*256 pixel images over 300 itera-
tions at a learning rate of 0.01. The remaining 30%
of non-defective images are divided in half, and 15%
are used for model validation to save checkpoints and
verify early stopping. The remaining 15% is needed
to calculate T1. 15% of the testing dataset is used to
estimate T2 and T3. ResNet18 was selected to work
as a feature extractor because CFLOW, STFPM, and
RDOCE require for a pre-trained backbone. Each
of the methodologies presented has unique mem-
ory needs because each has a different architecture.
Consequently, each will have a unique batch size.
The hardware set up of the machine will be used
to perform this experiment is Intel(R) Xeon(R) CPU
E5-2680 V4@2.4GHZ and NVIDIA GeForce GTX
1080Ti 11 GB.
1
https://github.com/gudovskiy/cflow-ad
Automatic Defect Detection in Leather
199

4 RESULTS
In this section, the results of three experiments are
presented. Only for the Experiment 1 are presented
the quantitative, qualitative and complexity results.
For Experiment 2 and Experiment 3 the quantitative
results are presented.
4.1 Experiment 1 - Quantitative Results
The localization and detection results of all tech-
niques’ are compared in Table 2 using the MVTEC
dataset. CFLOW has the greatest AUROC of any
of the localization results, at 99.57%, followed by
RDOCE and STFPM, at 99.31% and 98.91%, respec-
tively. It is evident from the IoU results analysis that
segmentation T2’s optimized threshold yields supe-
rior outcomes to T1’s. Almost all techniques have
higher IoU using T2 than T1. T1 outperforms T2 in
PRO columns results, with the exception of DRAEM.
These results demonstrated how important the thresh-
old estimation process is. The DRAEM AUROC is
4% less than the CFLOW. However, DRAEM uses
T2 to show the best IoU result.
Looking for the MVTEC detection columns,
CFLOW outperforms all the other techniques with
100% AUROC and 95.36% F1-Score using T3. The
SSIM approach yields the lowest results, however the
MVTEC outcomes for both tasks appear to be similar.
It performs better in this experiment than the early
studies. SSIM AE had 94.18% AUROC in this ex-
periment, compared to 78% AUROC in the original
article. This happens because the used architecture
segment borders as defective. Therefore, a clean bor-
der method was used, which raised AUROC.
The quantitative results utilizing the Neadvance
dataset are shown in Table 3. It may be confirmed
that the AUROC results are inferior to the MVTEC
results by analyzing the segmentation metrics. With
72.52%, 71.40%, and 74.17% of AUROC, respec-
tively, CFLOW, STFPM, and Reverse continue to per-
form better than the other approaches, just as with
MVTEC. In contrast to MVTEC, DRAEM achieves
an extremely low AUROC of 46.77%. The IoU val-
ues are quite poor, which indicates that the expected
and ground truth masks are very unlike.
STFPM, RDOCE, and DRAEM perform better
than the other approaches in the Neadvance detection
results columns with 77.41%, 77.05%, and 77.74%
AUROC, respectively. On F1-Score, DRAEM does
not consistently achieve good results. DRAEM has
an F1-Score of 1.08% using T1 and 4.39% using T2.
F1-Score does not show any appreciable differences
between thresholds for detection.
4.2 Experiment 1 - Qualitative Results
Performance of the novelty detection techniques are
measured using evaluation metrics. Beyond that, it
is a good habit to use visual examples to confirm the
effectiveness of the strategies. Figure 3 and Figure
4 present one anomaly score map and mask (denoted
with a red line) by each technique using an MVTEC
and Neadvance sample. The predicted mask is ob-
tained using the segmentation optimized T2.
It may be confirmed through analysis of the
MVTEC sample results that all techniques detect and
locate the defective region. The best masks are pro-
duced by DRAEM because the anomaly scores map
clearly defines the defective boundaries. It assigns a
high score to the defective area and a low score to the
normal area. CFLOW anomaly map gives high scores
to non-anomalous regions. However, they are not
thresholded as anomalous. The Neadvance sample re-
sults only detect the defective region using SSIM AE,
STFPM, and RDOCE. DRAEM provides an excellent
anomaly scores map using the MVTEC sample. How-
ever, with the Neadvance sample, DRAEM attributes
high scores to every pixel, impeding the defect thresh-
old. The SSIM AE anomaly scores map shows other
locations with high scores, and it also classifies non-
defective regions as defective.
4.3 Experiment 1 - Complexity Results
In real-time solutions, the complexity of each tech-
nique is crucial. To work in real-time, the num-
ber of predicted frames per second (FPS) has to
be high as possible. It appears from an analysis
of the table 4 that MVTEC takes longer to make
inferences than the Neadvance dataset. This fact
is caused by the MVTEC batch loading time. As
the MVTEC images have 1024*1024 resolution and
the Neadvance images have 256*256 resolution, the
batch loading spends more time because it has to re-
size the MVTEC images to the 256*256 resolution.
The DRAEM approach was the fastest in this exper-
iment, achieving 56.10 FPS when using the Nead-
vance dataset and 34.69 FPS while using the MVTEC.
Because DRAEM does not extract features to cre-
ate the anomalous score map. And these opera-
tions increase the inference time, reducing the num-
ber of FPS. The smaller number of FPS from the
RDOCE technique, when compared with STFPM,
can be caused by the increased complexity of using
OCBE architecture.
VISAPP 2023 - 18th International Conference on Computer Vision Theory and Applications
200
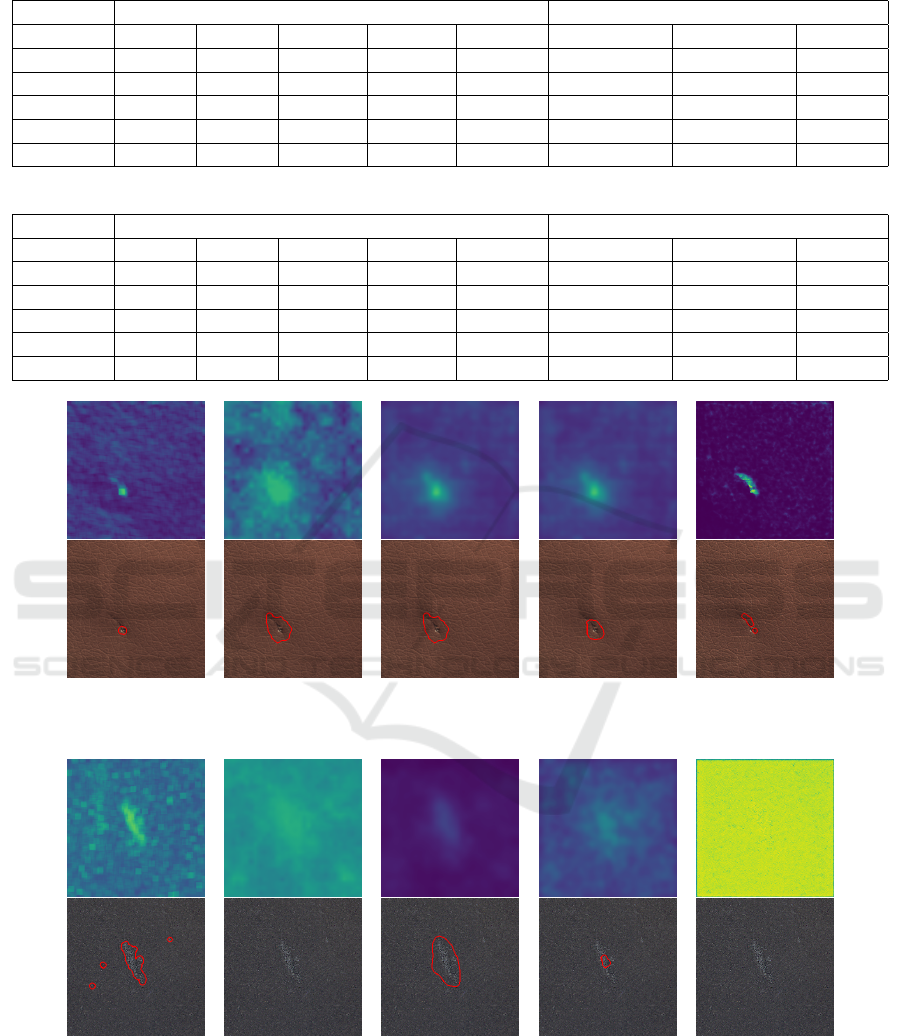
Table 2: MVTEC dataset results.
Localization Metrics (%) Detection Metrics (%)
Model IoU T1 IoU T2 PRO T1 PRO T2 AUROC F1-Score T1 F1-Score T3 AUROC
SSIM AE 31.33 29.41 47.24 42.01 94.18 92.13 90.57 91.38
CFLOW 7.28 22.54 99.98 95.65 99.57 82.02 95.36 100
STFPM 4.39 22.32 99.42 43.16 98.91 46.60 86.76 97.08
RDOCE 1.23 21.49 99.99 79.81 99.31 68.92 91.67 99.91
DRAEM 1.49 38.97 2.34 75.49 94.8 63.06 88.76 99.23
Table 3: Neadvance dataset results.
Localization Metrics (%) Detection Metrics (%)
Model IoU T1 IoU T2 PRO T1 PRO T2 AUROC F1-Score T1 F1-Score T3 AUROC
SSIM AE 6.24 0.65 12.04 32.63 68.07 53.13 55.51 62.95
CFLOW 1.92 0.01 14.27 17.11 72.52 70.51 70.53 70.79
STFPM 2.18 7.61 8.03 48.26 71.40 21.78 33.03 77.41
RDOCE 4.78 9.89 51.71 28.03 74.17 70.75 70.75 77.05
DRAEM 0.01 0.01 72.37 82.43 46.77 1.08 4.39 77.74
(a) SSIM AE (b) CFLOW (c) STFPM (d) RDOCE (e) DRAEM
Figure 3: MVTEC leather maps and masks.
(a) SSIM AE (b) CFLOW (c) STFPM (d) RDOCE (e) DRAEM
Figure 4: Neadvance leather maps and masks.
4.4 Experiment 2 - Quantitative Results
Table 5 shows the results of the MVTEC dataset us-
ing models trained on the Neadvance dataset. The
AUROC results for SSIM AE, CFLOW, STFPM, and
Reverse (95.06%, 97.89%, 91.93%, and 94.27%) ap-
pear to be good and are equivalent to those from table
2. DRAEM experienced the biggest drop in AUROC,
Automatic Defect Detection in Leather
201

Table 4: Complexity results (MVTEC/Neadvance).
Model Inference time FPS
SSIM AE 4.24 / 5.84 29.28 / 43.31
CFLOW 10.29 / 12.63 12.04 / 20.02
STFPM 5.63 / 6.17 21.99 / 40.96
RDOCE 10.62 / 16.9 11.66 / 14.89
DRAEM 3.57 / 4.50 34.69 / 56.10
from 94.80% to 38.79%. The inability of DRAEM to
learn the Neadvance features can be used to explain
this decline. For the majority of the techniques, the
outcomes are incredibly poor when compared to the
threshold-dependent metrics. According to the infor-
mation in this table, SSIM AE achieves 15.02% IoU
using T1, 33.27% IoU using T2, 19.45% PRO using
T1, and 46.02% using T2. Based on this table, certain
models can generalize if they only identify the best
thresholds for the testing dataset.
Table 5 shows the results for the defects detection
task on the MVTEC dataset using Neadvance as the
training dataset, which are now prepared for analy-
sis. Unexpectedly, with 95.82% AUROC, SSIM AE
beats all other techniques. DRAEM also claims at-
tenction because, it achieves the worst AUROC of all
techniques. With T3, the SSIM produces the best re-
sults for the F1-Score.
The Neadvance results using MVTEC as the train-
ing dataset are shown in table 6. The results shown in
this table for the localization metrics are poor, mir-
roring those from table 3. The AUROC results have
once more shown a slight decrease in the majority of
the models (from 68.07%, 72.52%, 71.40%, 74.17%,
and 46.77%).
Even though they weren’t trained on the Nead-
vance dataset, the detection metrics SSIM AE and
DRAEM in this table match to the AUROC results
of table 3. This table shows the respective AUROC
for SSIM AE and DRAEM at 62.14% and 77.74%. It
is crucial to call attention to the SSIM AE results for
F1-Score in this table, which are 51.16% for T1 and
62.28% for T3. The Neadvance dataset produced bet-
ter results than the table 3, with 53.13% for T1 and
55.51% for T3.
4.5 Experiment 3 - Quantitative Results
In order to analyze the MVTEC results utilizing mod-
els trained using MVTEC and Neadvance, let’s first
look at the results of table 7. The majority of the
techniques produce excellent AUROC values for lo-
calization metrics, following the AUROC results of
table 2. The DRAEM AUROC performance in this ta-
ble is unsatisfactory. DRAEM AUROC decreases by
about 40% when compared to table 2. The inability
of DRAEM to learn the Neadvance samples, as dis-
played in table 3, can be used to explain this decline.
The outcomes of the threshold-dependent metrics can
now be examined. With a 35.44% IoU, SSIM AE uses
T2 to produce the best result for the IoU metric. Ad-
ditionally, utilizing T2, SSIM AE was the method that
produced the best results for the PRO metric, with a
result of 57.13%.
The results of this table do not match the MVTEC
detection results from table 2 in terms of MVTEC de-
tection results. SSIM AE and CFLOW nonetheless
achieve good AUROC values of 92.30% and 99.73%,
respectively, despite the AUROC results not being
as high as previously. The F1-Score results utiliz-
ing T3 on the other hand, produce good results that
are comparable to those shown in table 2. The F1-
Score results utilizing T3 outperform the prior results
for SSIM AE and CFLOW, increasing the SSIM AE
F1-Score value from 90.57 to 93.59 and the F1-Score
from 95.36 to 95.95%.
The results of Neadvance localization utilizing
methods developed with MVTEC and Neadvance are
shown in table 8. This table appears to match the AU-
ROC results from table 3 in terms of localization met-
rics. For SSIM AE, the AUROC rises from 68.07%
to 71.26 %. Additionally, it rises from 72.52% to
74.35% in the case of CFLOW. The STFPM and Re-
verse AUROC values, however, decline. The STFPM
AUROC decreased from 71.40% to 66.69% then Re-
verse from 74.17% to 73.25%. It appears that using
this technique on both datasets did not enhance the
localization results. This can be explained by how
challenging it is to detect Neadvanced defects.
Relatively to the Neadvance detection using tech-
niques trained with MVTEC and Neadvance, it
presents satisfactory AUROC results, achieving the
maximum with DRAEM, 78.69%. These results out-
perform the AUROC results when compared to those
shown in table 3. T3 values from SSIM AE, CFLOW,
STFPM, and Reverse are superior to those from the
F1-Score. Additionally, the T1 now has SSIM AE,
STFPM, and DRAEM enhancements.
5 CONCLUSIONS
Relatively to the Experiment 1, the ideas that arise
from the previous analyzes are that SSIM AE presents
the worst quantitative results. Compared with the
other techniques, SSIM AE only has a good infer-
ence time. Even though, DRAEM outperforms SSIM
AE complexity results. As seen in the quantitative
and qualitative results, DRAEM performs very well
in the MVTEC dataset. However, it has a horrible
VISAPP 2023 - 18th International Conference on Computer Vision Theory and Applications
202

Table 5: MVTEC dataset results using models trained with Neadvance.
Localization Metrics (%) Detection Metrics (%)
Model IoU T1 IoU T2 PRO T1 PRO T2 AUROC F1-Score T1 F1-Score T3 AUROC
SSIM AE 15.02 33.27 19.45 46.09 95.06 71.33 83.02 95.82
CFLOW 0.01 1.73 0 0 97.89 0 0 89.37
STFPM 4.26 3.54 6.43 4.23 91.93 57.75 0 63.32
RDOCE 0.01 1.30 5.89 9.23 94.27 0 0 68.61
DRAEM 0.02 0.42 7.14 9.05 38.79 4.25 0 41.00
Table 6: Neadvance dataset results using models trained with MVTEC.
Localization Metrics (%) Detection Metrics (%)
Model IoU T1 IoU T2 PRO T1 PRO T2 AUROC F1-Score T1 F1-Score T3 AUROC
SSIM AE 1.07 3.68 9.80 7.19 61.07 51.16 62.28 62.14
CFLOW 0.07 0.02 0 0 50.77 0 0 46.66
STFPM 0.04 4.89 3.11 4.51 57.06 0 0 69.41
RDOCE 0.04 0.02 8.82 6.37 69.05 0 0 58.36
DRAEM 0.05 0.02 5.42 7.62 47.90 2.80 0 77.74
Table 7: MVTEC dataset results using models trained with MVTEC and Neadvance.
Localization Metrics (%) Detection Metrics (%)
Model IoU T1 IoU T2 PRO T1 PRO T2 AUROC F1-Score T1 F1-Score T3 AUROC
SSIM AE 23.14 35.44 31.74 57.13 91.02 77.78 93.59 92.30
CFLOW 1.34 23.08 0 9.62 99.52 77.78 93.59 92.30
STFPM 14.19 21.47 59.80 23.70 96.46 79.17 77.61 81.17
RDOCE 9.06 22.70 41.76 49.28 99.93 83.62 80.00 77.85
DRAEM 0.14 1.43 0.12 2.81 55.09 22.99 0 55.80
Table 8: Neadvance dataset results using models trained with MVTEC and Neadvance.
Localization Metrics (%) Detection Metrics (%)
Model IoU T1 IoU T2 PRO T1 PRO T2 AUROC F1-Score T1 F1-Score T3 AUROC
SSIM AE 5.57 6.77 26.9 14.83 71.26 66.90 60.15 68.65
CFLOW 0.01 3.03 0 32.87 74.35 0 80.69 73.30
STFPM 4.24 6.51 9.03 15.96 66.69 38.63 35.40 67.42
RDOCE 3.01 7.71 21.93 32.12 73.25 70.13 85.39 66.30
DRAEM 0.01 0.01 0.01 9.68 54.01 36.30 0 78.69
performance with the Neadvance dataset. The bad re-
sults could be justified by the inability of the DRAEM
to learn to segment the samples from distinct col-
ors. So, DRAEM should be an option when the real-
world scenario samples have only one color. The
three feature-extraction-based methodologies achieve
great results. The CFLOW is the technique in the
state-of-the-art with the highest segmentation AU-
ROC for the MVTEC dataset and this experiment
confirms that. In this experience, the CFLOW has
100% of detection AUROC with the MVTEC sam-
ples. However, CFLOW does not produce the best
anomaly score maps, difficulting the scores maps
threshold. The STFPM and RDOCE are two teacher-
student architectures. As RDOCE uses an OCBE,
the time complexity increases relatively to STFPM.
These two techniques have similar quantitative results
for both datasets. Analyzing the previous arguments,
the STFPM is the best option of these three tech-
niques. It has a higher number of predicted FPS and
achieves similar results, outperforming the previous
techniques as analyzed in the qualitative results. So,
in cases such as the Neadvance where DRAEM is not
an option, STFPM should be used.
Relatively to the Experiment 2, it seems that there
is generalization ability in the novelty detection tech-
niques. In this way it is possible to use a novelty tech-
nique to detect defects different from the used during
the training. However, the results are better when the
the techniques are trained with samples that follow
the real world scenario pattern.
Automatic Defect Detection in Leather
203

Relatively to the Experiment 3, the increasing of
training complexity caused by the increasing number
of training samples did improve the evaluation met-
rics results. So, it is recommended to train a novelty
detection technique for each real world scenario. In
this way, the technique can be optimized for samples
with the same features as the training samples.
The work presented in this paper solves the leather
detection problem. However, every day, new re-
searches present novelty detection methodologies that
overcome the previous state-of-the-art techniques.
So, for future work, the continuous upgrading of
leather detection solutions using recent novelty detec-
tion methodologies is mandatory. New ways to es-
timate the binary threshold, to convert the anomaly
score maps into a binary mask, should also be ex-
plored. Also, it is crucial to continue looking for solu-
tions with low computation requirements. Most of the
time, these solutions are applied in small computers
that do not have the required hardware to implement
the methodologies. On other hand, the presented so-
lutions can perform better if the training dataset was
bigger. In this way, it is necessary to invest in leather
image capture.
ACKNOWLEDGEMENT
This work is supported by: European Structural and
Investment Funds in the FEDER component, through
the Operational Competitiveness and International-
ization Programme (COMPETE 2020) [Project nº
42778; Funding Reference: POCI-01-0247-FEDER-
042778].
REFERENCES
ALLPI (2016). Africa leather and leather products institute
- hides and skins improvement handbook: Trainer’s
manual - hides and skins improvement handbook:
Trainer’s manual.
Aslam, M., Khan, T. M., Naqvi, S. S., Holmes, G., and
Naffa, R. (2020). Ensemble convolutional neural
networks with knowledge transfer for leather defect
classification in industrial settings. IEEE Access,
8:198600–198614.
Bergmann, P., Batzner, K., Fauser, M., Sattlegger, D., and
Steger, C. (2021). The mvtec anomaly detection
dataset: A comprehensive real-world dataset for un-
supervised anomaly detection. International Journal
of Computer Vision, 129:1038–1059.
Bergmann, P., Fauser, M., Sattlegger, D., and Steger,
C. (2019a). Mvtec ad-a comprehensive real-world
dataset for unsupervised anomaly detection. Pro-
ceedings of the IEEE Computer Society Conference
on Computer Vision and Pattern Recognition, 2019-
June:9584–9592.
Bergmann, P., L
¨
owe, S., Fauser, M., Sattlegger, D., and
Steger, C. (2019b). Improving unsupervised defect
segmentation by applying structural similarity to au-
toencoders. In Proceedings of the 14th Interna-
tional Joint Conference on Computer Vision, Imag-
ing and Computer Graphics Theory and Applications.
SCITEPRESS - Science and Technology Publications.
Bong, H. Q., Truong, Q. B., Nguyen, H. C., and Nguyen,
M. T. (2019). Vision-based inspection system for
leather surface defect detection and classification.
NICS 2018 - Proceedings of 2018 5th NAFOSTED
Conference on Information and Computer Science,
pages 300–304.
Defard, T., Setkov, A., Loesch, A., and Audigier, R. (2021).
Padim: a patch distribution modeling framework for
anomaly detection and localization. In International
Conference on Pattern Recognition, pages 475–489.
Springer.
Deng, H. and Li, X. (2022). Anomaly detection via reverse
distillation from one-class embedding. In Proceedings
of the IEEE/CVF Conference on Computer Vision and
Pattern Recognition, pages 9737–9746.
Gan, Y. S., Chee, S.-S., Huang, Y.-C., Liong, S.-T., and Yau,
W.-C. (2020). Automated leather defect inspection
using statistical approach on image intensity. Jour-
nal of Ambient Intelligence and Humanized Comput-
ing 2020 12:10, 12:9269–9285.
Georgieva, L., Krastev, K., and Angelov, N. (2003). Iden-
tification of surface leather defects. In CompSysTech,
volume 3, pages 303–307. Citeseer.
Gudovskiy, D., Ishizaka, S., and Kozuka, K. (2022). Cflow-
ad: Real-time unsupervised anomaly detection with
localization via conditional normalizing flows. In
2022 IEEE/CVF Winter Conference on Applications
of Computer Vision (WACV), pages 1819–1828.
Liong, S., Zheng, D., Huang, Y.-C., and Gan, Y. (2020).
Leather defect classification and segmentation using
deep learning architecture. International Journal of
Computer Integrated Manufacturing, 33:1–13.
Liong, S.-T., Gan, Y. S., Huang, Y.-C., Liu, K.-H., and Yau,
W.-C. (2019). Integrated neural network and machine
vision approach for leather defect classification. arXiv
preprint arXiv:1905.11731.
Wang, G., Han, S., Ding, E., and Huang, D. (2021).
Student-teacher feature pyramid matching for un-
supervised anomaly detection. arXiv preprint
arXiv:2103.04257.
Zavrtanik, V., Kristan, M., and Skocaj, D. (2021). Draem
- a discriminatively trained reconstruction embedding
for surface anomaly detection. In Proceedings of the
IEEE/CVF International Conference on Computer Vi-
sion (ICCV), pages 8330–8339.
VISAPP 2023 - 18th International Conference on Computer Vision Theory and Applications
204
