
Bagged Ensembles for Blood Glucose Prediction: A Comparative
Study
Mohamed Zaim Wadghiri
1
and Ali Idri
1,2
1
Software Project Management Research Team, ENSIAS, Mohammed V University in Rabat, Morocco
2
Mohammed VI Polytechnic University, Benguerir, Morocco
Keywords: Ensemble Learning, Machine Learning, Bagging, Blood Glucose, Prediction.
Abstract: Blood Glucose (BG) prediction is an essential process for diabetes self-management. Many papers
investigated the use of various machine learning techniques to design and implement BGL predictors.
However, due to the complexity of glucose dynamics, single techniques do not always capture inter- and intra-
patient changes. On the other hand, ensemble learning and bagging ensembles in particular have been
established to show better performance in many medical disciplines including diabetology. The aim of the
present paper is to build BG predictors based on bagging in order to compare their performance to the accuracy
of their underlying single techniques and to verify if a particular ensemble outperforms the others. An
approach has been proposed to build bagged predictors based on five techniques: LSTM, GRU, CNN, SVR
and DT. The models’ performance has been evaluated and compared at a prediction horizon of 30 minutes
according to RMSE and CEGA. The results show that the performance of the constructed bagging ensembles
is very comparable to their underlying single techniques except for regression trees. This can be attributed to
the good accuracy of deep learning models but also to the non-stationarity of BG time series that need to be
addressed before constructing the bootstrap samples.
1 INTRODUCTION
Diabetes Mellitus (DM) is a chronic disease caused
by a disorder in the glucose metabolism leading to
abnormal BG levels (World Health Organization,
2019) that can be higher (Hyperglycemia) or lower
(Hypoglycemia) than normal range: 70 mg/dl to 140
mg/dl (3.9 mmol/L to 7.8 mmol/L). DM can be
classified intro three main types: 1) Type 1 Diabetes
Mellitus (T1DM) where pancreas does not produce
enough insulin, 2) Type 2 Diabetes Mellitus (T2DM)
where glucose is not used effectively and not moved
out into cells and 3) Gestational Diabetes Mellitus
(GDM) that can occur during pregnancy when
placenta produces high levels of hormones impairing
the action of insulin (World Health Organization,
2019).
When BG is not properly monitored and not
maintained in the normal range, diabetic patients can
face higher risks of complications including damage
to blood vessels, cardiovascular diseases, blindness,
kidney damage, coma, or even death (World Health
Organization, 2019). Diabetic patients need to
measure their BG level regularly in order to keep its
values in normal ranges. This is performed either
manually by self-monitoring blood glucose using
sticks several times a day or automatically with
Continuous Glucose Monitoring (CGM) sensors
(Khadilkar et al., 2013).
Forecasting future BG values is a crucial clinical
task for diabetic patients to avoid hypo- and hyper-
glycemic episodes and to take appropriate actions in
advance of time (Abraham et al., 2019). Machine
learning techniques have been widely used in
literature to design robust BG predictors based on a
variety of techniques including Artificial Neural
Networks (ANN), Support Vector Regressions
(SVR), Decision Trees (DT) and Genetic
Programming (GP) (Woldaregay et al., 2019). Given
the complexity of the glucose dynamics, the adoption
of one single technique to predict BG is not always
able to capture inter- and intra-patients changes and
can quickly show accuracy drop in case of context
and environment changes (Wadghiri et al., 2022;
Woldaregay et al., 2019). Ensemble learning, on the
other hand, showed a promising improvement in BG
predictors’ performance (Wadghiri et al., 2022). They
are based on training multiple single techniques and
570
Wadghiri, M. and Idri, A.
Bagged Ensembles for Blood Glucose Prediction: A Comparative Study.
DOI: 10.5220/0011705400003393
In Proceedings of the 15th International Conference on Agents and Artificial Intelligence (ICAART 2023) - Volume 3, pages 570-577
ISBN: 978-989-758-623-1; ISSN: 2184-433X
Copyright
c
2023 by SCITEPRESS – Science and Technology Publications, Lda. Under CC license (CC BY-NC-ND 4.0)

fusing them using combination schemes like
averaging or applying specific meta-algorithms.
Ensemble models were used in several medical fields
like oncology (Hosni et al., 2019), endocrinology
(Hong et al., 2020) and cardiology (Cuocolo et al.,
2019) where the constructed ensembles outperform in
general the performance of the underlying single
techniques. Many papers in literature used ensembles
in diabetology especially for diabetes disease
detection (EL Idrissi et al., 2019), but few studies
considered the use of these techniques in BG
prediction.
The aim of the present paper is to investigate the
application of bagging, a specific type of ensemble
methods, in the prediction of BG in diabetic patients.
A comparative study has been conducted in order to
construct bagging-based ensembles using five
different base learners: Long Short-Term Memory
(LSTM), Gated Recurrent Unit (GRU),
Convolutional Neural Network (CNN), Support
Vector Regression (SVR) and Decision Trees (DT).
The performance of the bagged ensembles will be
evaluated and compared on 89 patients at a Prediction
Horizon (PH) of 30 minutes.
The rest of the paper is structured as follows:
Section 2 presents the state of the art on using
ensemble methods and bagging in BG prediction.
Section 3 introduces the core concepts of bagging-
based ensembles. The used material and methods are
presented in section 4. Section 5 relates and discusses
the main results. Conclusion and future work are
presented in section 6.
2 LITERATURE SURVEY
Many reviews have been published in the literature
where studies dealing with the use of ML techniques
in diabetes self-management and BG prediction in
particular have been analyzed. (Woldaregay et al.,
2019) conducted a literature review of BG prediction
using ML strategies in type 1 diabetes where 55
papers published between 2000 and February 2018
have been assessed and reviewed. They found out that
blood glucose complexity is considered as a main
challenge to achieve accurate BG predictors for every
context and scenario. (Oviedo et al., 2017) presented
a methodological review of models for predicting
blood glucose by analyzing 140 papers published
between 2010 and April 2016. A trend of model
individualization has been observed where the
reviewed models adopt an experimentation that
adapts to a particular physiology and lifestyle of the
patient.
On the other hand, (Wadghiri et al., 2022)
conducted a systematic literature review on the use of
ensemble techniques in the prediction of BG in
diabetic patients by assessing 32 papers published
between 2000 and December 2020. The main
findings were as following:
1. A growing interest is being devoted to the use
of ensemble learning in BG prediction, in particulate
since 2018 as 75% of the reviewed papers have been
published after this date.
2. Homogeneous ensembles were investigated
more than heterogeneous ensembles as they are easier
to understand and interpret and simpler to implement.
3. Many meta-algorithms have been used to
construct ensemble-based BG predictors. Bagging is
the most explored meta-algorithm mainly through
Random Forests (RF).
4. DT, ANNs, AR and SVR are the most
combined base learners to build the ensemble
regressors. Bagging was mainly used to combine DT-
based learners.
5. Several combination schemes were explored
but weighted and simple average were the most
investigated.
6. Statistical metrics were more used than
clinical indicators to assess the performance of
ensemble predictors. RMSE and CEGA were the
most used statistical and clinical metrics respectively.
7. No general conclusion on the best performing
ensemble can be established as the ensembles were
evaluated on different datasets and with distinctive
metrics.
3 BACKGROUND
3.1 Ensemble Learning
Ensemble learning is a machine learning approach
that combines multiple base learners into one
aggregated model using combination schemes. For
that end, multiple learners are trained on the same
problem and their results are combined to output a
final result. The main objective of ensemble methods
is to find a better variance/bias trade-off and improve
the prediction accuracy. For that end, the base models
should be accurate having a better estimation than
baseline method and diverse making different errors
in the same data point.
Ensemble methods have recently become a
popular machine learning approach since multiple
studies found out that ensembles, in general, have a
better performance accuracy than stand-alone trained
single learners. Hansen and Salamon published an
Bagged Ensembles for Blood Glucose Prediction: A Comparative Study
571
article in 1990 (Hansen & Salamon, 1990) where they
concluded that using an ANN-based classification
ensemble highly outperforms the training of a single
copy of the underlying ANN. More recently, models
based on ensemble methods showed encouraging
results in many international competitions and
challenges for automated detection of liver cancer in
whole-slide images - PAIP 2019 (Kim et al., 2021) -,
for automated detection and grading of diabetic
retinopathy - IDRiD (Porwal et al., 2020) - or for
Ebola epidemic forecasting - RAPIDD (Viboud et al.,
2018) -.
Ensemble methods can be classified into two
categories. Homogeneous ensembles where one
single learner is used either 1) with different
configurations or datasets 2) or with a meta-algorithm
combiner; and Heterogeneous ensembles where at
least two different techniques are fused to construct
the ensemble (Zhou, 2012).
According to how the base learners are trained,
two paradigms of ensemble methods can be
identified: parallel ensemble techniques where base
learners are computed in parallel. They are
completely independent and the results of each
learner is not influenced by the prediction of the rest
of base learners. On the other hand, sequential
ensemble techniques consist of base learners that are
sequentially generated. The result of each single
technique influences the computing of the next base
learner (Zhou, 2012).
3.2 Bagging Meta-Algorithm
Bagging (Breiman, 1996) (abbreviation of Bootstrap
Aggregating), is a parallel ensemble method that
consists of training the same base learner on multiple
bootstrap replicates of the training set. The outcomes
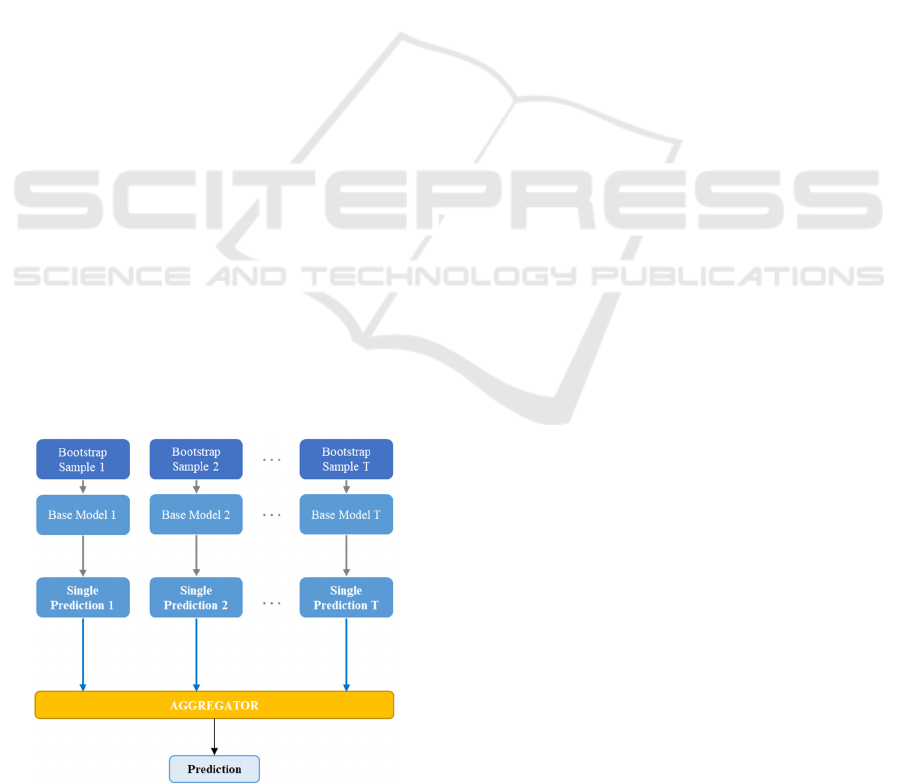
Figure 1: Bagging meta-algorithm steps.
of all the variations are then aggregated through
simple averaging for regression or using votes for
classification (Figure 1).
The bagging process can be divided into three
successive steps as follows:
Step 1 - Bootstrapping: The first step of bagging
consists of generating S samples of size B (called
bootstrap samples) from an initial dataset of size N by
random sampling with replacement B observations
for each sample. The generated bootstraps should be
representative (i.e., the full dataset should be large
enough to have representative samples) and
independent (i.e., N should be large enough compared
to B so that samples are not correlated).
Step 2 - Fitting case Learners on each Bootstrap
Sample: Bagging as a parallel ensemble method aims
to leverage the independence between the base
learners (Zhou, 2012). For that end, the base learner
is trained in parallel on each bootstrap sample
obtained in the first step and outputs its single
prediction value.
Step 3: Aggregating the Predictions of Fitted Models:
The final step is to aggregate the T predicted values
using an aggregator function. Multiple aggregators
can be used to obtain the final prediction value of the
ensemble model for both regression and classification
problems. Simple and weighted averaging can be
used for regression problems, whereas majority
voting (mode of the outputs) or soft voting (weighting
outputs probabilities) can be applied for
classification.
3.3 Application of Bagging to Time
Series Data
Although successfully used in many classification
and regression problems in the last years, only few
studies addressed the application of bagging in time
series forecasting (Petropoulos et al., 2018) before the
work of (Bergmeir et al., 2016) in 2016. The main
challenges encountered with bagging when applied to
time series such as BG data lies in the bootstrapping
process where autocorrelation need to be addressed in
order to produce bootstrap samples with the same
characteristics as the measured data. The sequence of
values is an important aspect of time series and by
sampling randomly without constraints, we destroy
the time-dependency structure. Hence, the traditional
bootstrapping method where independent and
identically distributed (IID) bootstraps are
constructed is not adapted for time series.
ICAART 2023 - 15th International Conference on Agents and Artificial Intelligence
572
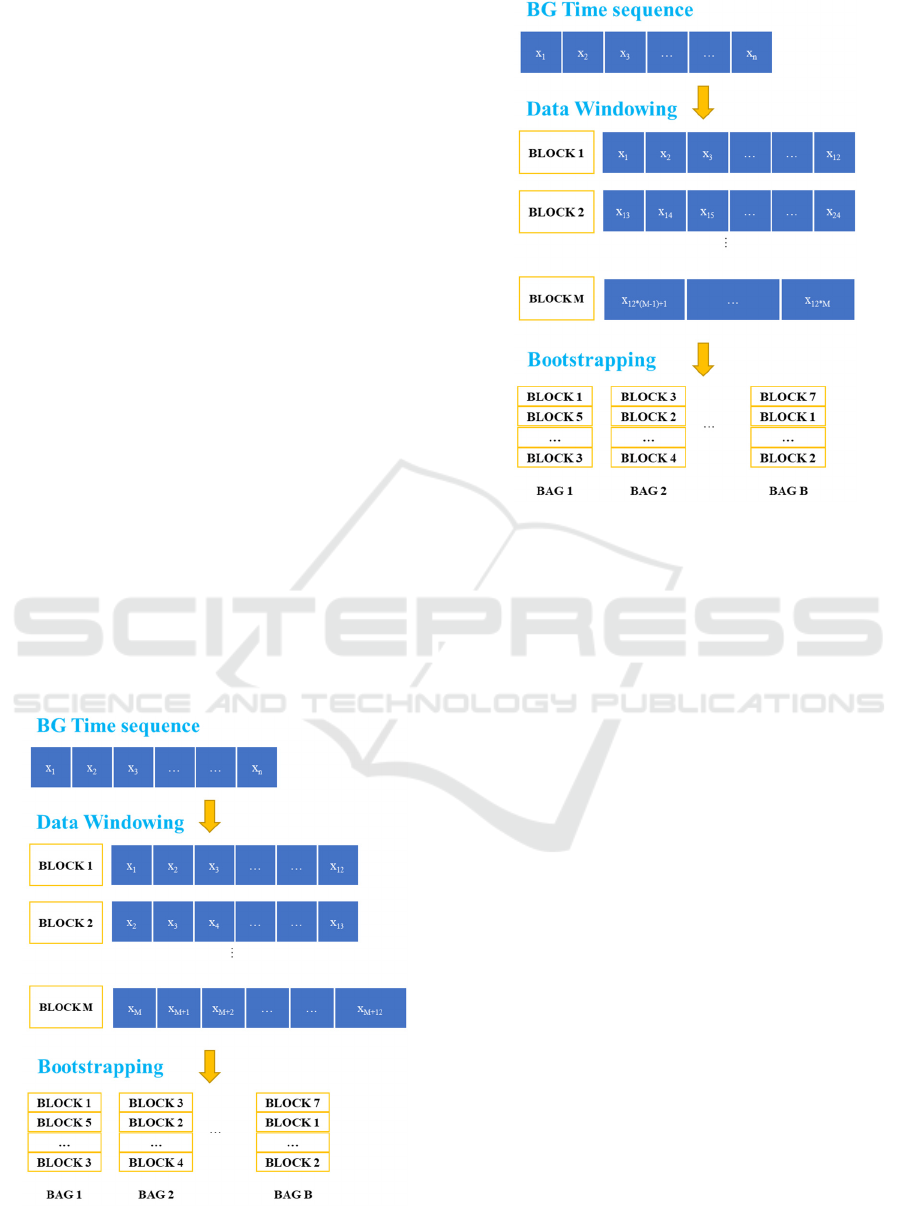
Many approaches have been published to
overcome this problem. In the present paper, we will
focus on Block Bootstrap algorithms (Kreiss &
Lahiri, 2012) in order to create bootstrap samples.
These techniques consist of resampling chunks of
continuous observations instead of single ones by
creating M blocks of length L. For a given number of
timesteps PH representing the prediction horizon and
a lookback of value LB representing the number of
previous timesteps used to make the future
predictions, a common value of the window length is
PH+LB.
Different block bootstrap implementations have
been proposed in the literature. Considering a finite
time series data sequence x
1
, x
2
, …, x
n
, we will only
focus on the two most popular techniques in this
comparative study:
1) Moving Block Bootstrap (MBB) and consists of
creating M blocks of size L using a sliding window.
The window moves one step at the time to create
successively each block as described in
Figure
2. Once
created, sampling with replacement is applied on the
blocks to create bootstrap samples of length B.
2) Non-overlapping Block Bootstrap (NBB) is similar
to MBB except that the sliding window moves by L
steps at the time to create each block. As illustrated in
Figure
3
, the idea is to produce non-overlapping
blocks where the timesteps of each block are
completely independent.
Figure 2: Moving Block Bootstrap (MBB) process
(PH=6 and LB=6).
Figure 3: Non-overlapping Block Bootstrap (NBB) process
(PH=6 and LB=6).
4 MATERIAL AND METHODS
4.1 Data
The dataset used in this comparative study provided
by the Diabetes Research in Children Network
(Diabetes Research in Children Network - Public
Site, n.d.). It consists of 113 subjects. After removing
all healthy subjects and patients who withdraw from
the study before inpatient stay or with a recording
span of less than 12 hours of sensor measurement, we
retained 89 patients with type 1 diabetes. Among
these selected patients, 45 are female and 44 are male
with an average age of 9.57 ± 4.06 years old. Each
patient wore a CGM sensor, the Medtronics Minimed,
between one and three days (i.e., zero, one, or two
optional days before a required one-day hospital
admission), where the BG concentration was
recorded every 5 minutes.
4.2 Evaluation Metrics
The designed bagging ensembles are evaluated as
personalized models where each ensemble is trained,
tested and evaluated on each patient of the dataset.
The overall performance for each evaluation metric is
calculated as the average of all the values obtained for
all the patients.
Bagged Ensembles for Blood Glucose Prediction: A Comparative Study
573
The prediction results were evaluated and
compared according to two performance criteria
consisting of one statistical metric and one clinical
criterion respectively:
1) Root Mean Squared Error (RMSE): Given
𝑦
as
the predicted value,
𝑦
the measured value and N the
size of samples, RMSE measures the error between
the predicted BG and the original BG measured by
the CGM sensor. It is calculated as:
𝑅𝑀𝑆𝐸
1
𝑁
𝑦
𝑦
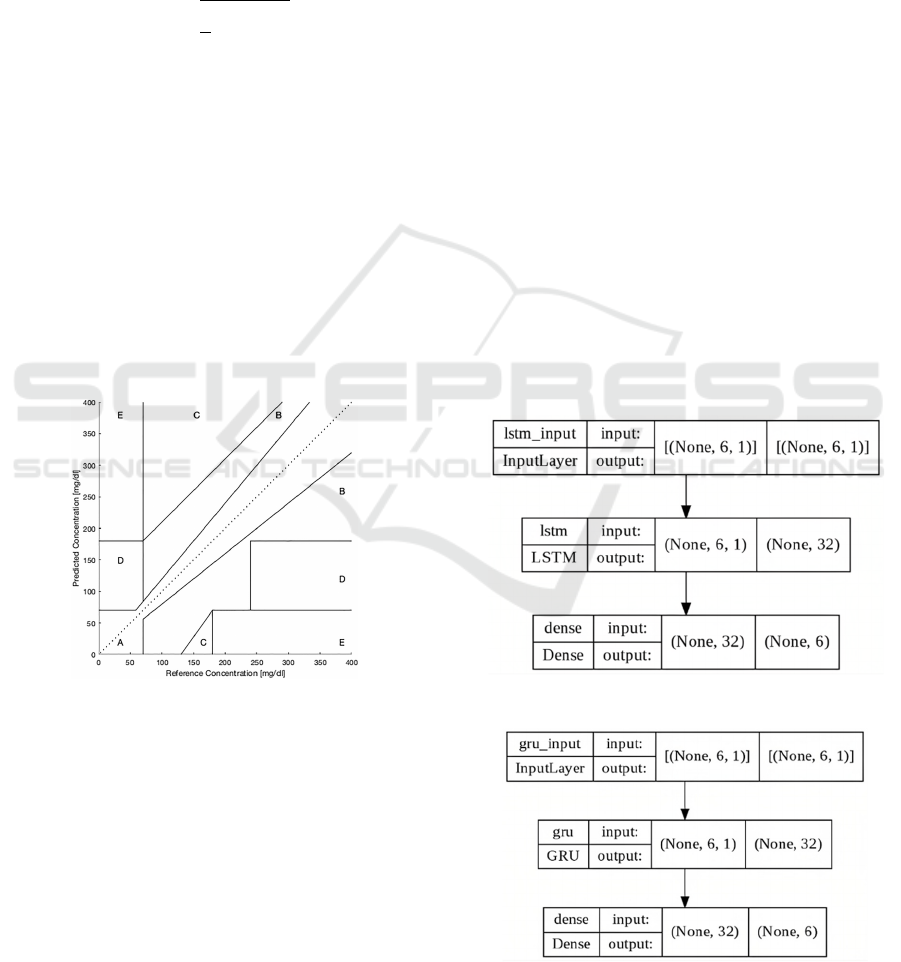
2) Clarke Error Grid Analysis (CEGA): A popular
clinical indicator in BG prediction that evaluates the
clinical acceptability of a predictor (Clarke et al.,
1987). It breaks down the measured and predicted
glucose values into a scatter chart divided into five
regions (A to E) as shown in
Figure
4. Regions A and
B are tolerable, Region C can lead to nonessential
treatment, and Regions D and E are dangerous and
can lead to wrong treatment. A clinically acceptable
model must have the majority of its points inside A
and B regions. The reported values in this study refer
to the sum of values in A+B zones which correspond
to the clinically acceptable predicted values.
Figure 4: Clarke Error Grid Analysis.
4.3 Methods
As highlighted in the previous sections, the objective
of this paper is to evaluate and compare the
performance of bagging-based ensembles to the
accuracy of their underlying base learners and to find
out if any specific bagged ensemble shows a better
performance than the rest of the models. As input, all
the models have been supplied a lookback of six
timesteps corresponding to 30 minutes of measured
BG history. Afterwards, they were evaluated at PH =
30 min which is equivalent to predicting the next six
timesteps in future.
4.3.1 Base Learners’ Design
The first step of the experimental process is to build
and train five BG predictors based on LSTM, GRU,
CNN, SVR and DT respectively. These models will
serve in further steps as base learners of the
constructed ensembles.
The LSTM model used in this paper is described
in Figure 5 and consists of one input layer of six
neurons representing the lookback’s timesteps, one
LSTM layer of 32 cells, and one dense output layer
with six neurons representing the six timesteps of the
30-minutes’ prediction horizon. The adopted GRU
model is very similar to the LSTM’s structure
described above. As shown in Figure 6, it consists of
one input layer of six neurons, one GRU layer of 32
cells and one dense output layer of six neurons.
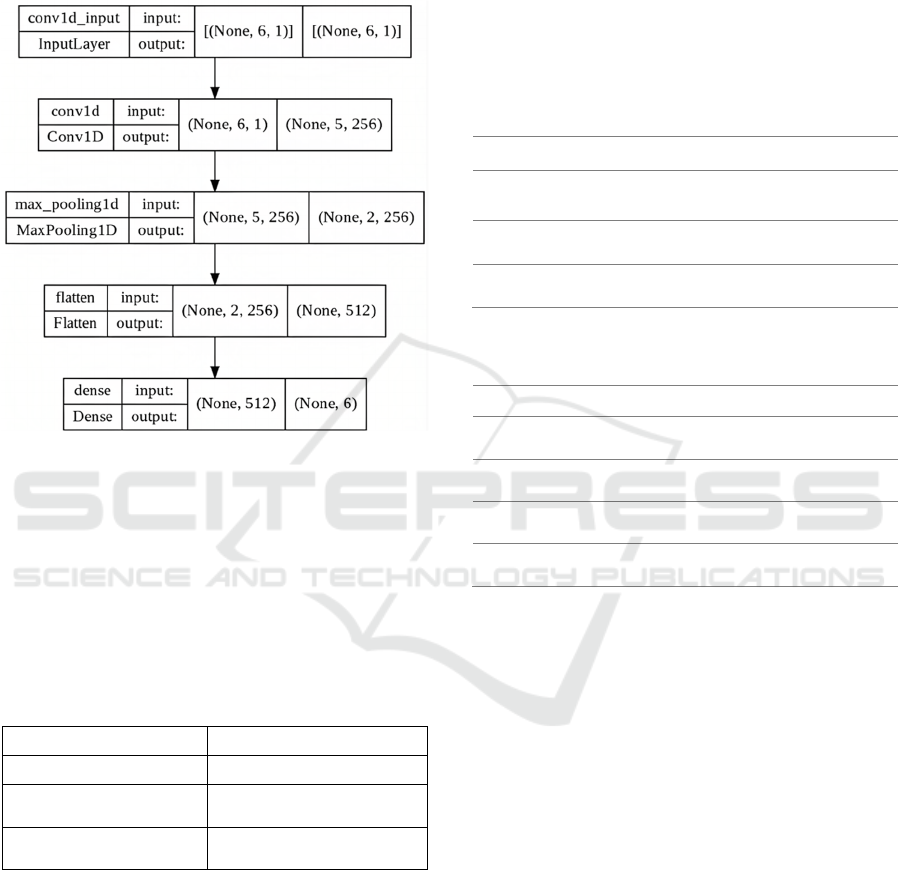
Moreover, as described in Figure 7, the CNN
model designed in this paper consists of one input
later of six neurons, two convolutional layers with
filters having dimension of 256 and a kernel size of
two as window length, one maximum pooling layer
of two pools, one flattening layer and finally one
dense output layer of six neurons representing the
prediction output.
Figure 5: LSTM model architecture.
Figure 6: GRU model architecture.
ICAART 2023 - 15th International Conference on Agents and Artificial Intelligence
574
Finally, the SVR and DT base models were
designed as simple multi-output regressors based on
SVR and regression tree respectively. Linear kernel
and C=1.0 were used as hyperparameters for the
SVR-based model.
Figure 7: CNN model architecture.
4.3.2 Bagged Ensembles’ Design
For each regressor described in the previous section,
the next step is to construct and train 24 bagging-
based ensembles by varying the hyper-parameters
presented in Table 1. The goal is to verify how the
structure and the hyper-parameters of bagged models
can impact the final performance results.
Table 1: Bagging ensembles hyper-parameters space.
Parameter Values space
Number of estimators [5, 25, 50, 100]
Block bootstrap
algorithm
[MBB, NBB]
Size of the bootstrap
samples
[33%, 66%, 100%] of the
input data
5 RESULTS AND DISCUSSION
The models have been evaluated at PH = 30 min using
RMSE and CEGA as performance metrics. For each
patient, 80% of the dataset was used for models’
training and the remaining 20% was used for testing.
The best performing models are summarized in Table
2 and Table 3 in terms of RMSE and CEGA
respectively.
For deep learning models, the best results are
always achieved by single models for both RMSE and
CEGA except for CNN where CEGA attained
97.55% of values in A+B zones for a bagged
ensemble of 5 learners, 100% of data as samples size
and NBB as block-bootstrap algorithm when
compared to the single learner that achieved a very
comparable result of 97.21%.
Table 2: Best configurations' performance in terms of
RMSE.
LSTM GRU CNN SVR DT
Single Learner 22.9 21.7 27.1 21.89 36.78
E25-MBB-66% 24.79 24.07 29.37 21.8 29.66
E100-MBB-
33%
25.23 24.72 29.68 21.84 28.70
Table 3: Best configurations' performance in terms of
CEGA.
LSTM
GRU CNN SVR DT
Single
learne
r
98.00
98.00 97.21 98.71 95.32
E5-NBB-
100%
96.27
96.87 97.6 98.63 94.41
E25-MBB-
33%
96.66
97.44 96.86 98.7 96.1
E25-NBB-
100%
95.62
97.24 96.47 98.8 94.57
For SVR-based models, a slight performance
improvement has been observed with bagging. The
best RMSE value of 21.835 mg/dl has been achieved
for a bagged ensemble of 25 learners with 66% of data
as samples size and MBB as block-bootstrap
algorithm compared to the single learner that
achieved an RMSE of 21.89 mg/dl. With regard to
CEGA, a bagged ensemble of 25 SVR-based learners,
100% as data size and NBB as block-bootstrap
algorithm achieved the best performance of 98.84%
of predicted points in A+B zones compared to the
single SVR learner that attained a value of 98.71%.
For DT-based bagging ensembles, a significant
improvement has been observed compared to the
single DT learner. With respect to RMSE, a value of
28.72 mg/dl has been achieved by an ensemble of 100
regression trees, 33% of data as samples size and
MBB as block-bootstrap algorithm compared to the
single learner that attained 36.78 mg/dl. Regarding
CEGA, an ensemble of 25 regression trees, 33% of
data as samples size and MBB as block-bootstrap
algorithm reached a value of 96.14% of predictions in
Bagged Ensembles for Blood Glucose Prediction: A Comparative Study
575

A+B zones compared to the single regression tree that
achieved 95.32%.
Considering the above results, deep learning
models as single techniques achieve better or similar
performance values when compared to their bagged
ensembles for both RMSE and CEGA metrics. A
similar conclusion can also be inferred for SVR-
bagged ensembles even if certain ensembles slightly
outperformed the single SVR technique for both
RMSE and CEGA criteria. The observed
performance improvement is not significant as the
best evaluated bagging-based ensembles only
improved the performance by 0.05 mg/dl and 0.13%
in average in terms of RMSE and CEGA respectively.
With regard to DT-based models, a more significant
improvement (21.91%) of RMSE has been observed.
In general, the results show that prediction
performance using bagging ensembles, regardless of
the hyper-parameters space, is very comparable to
single model predictors and no significant
improvement has been noticed except for DT. Many
reasons defend this statement. First, bootstrapping in
time series is very challenging as the non-stationarity
and the autocorrelation must be taken into
consideration when constructing the bootstraps. As
pointed out by Petropoulos et al. (Petropoulos et al.,
2018), autocorrelation is addressed using block
bootstrap algorithms such as MBB or NBB but non-
stationarity needs to be addressed as well before
feeding data to the bagged ensemble. This can be
achieved by applying a decomposition process to
separate the time series into trend, seasonal and
remainder components. Hence, the remainder can be
considered as a stationary signal that can be used to
construct the bootstrap samples instead of
bootstrapping the original data. Another important
aspect to consider with respect to deep learning
models, is their good generalization ability that comes
natively with neural networks and that makes them
benefit less from ensemble methods as highlighted by
Dietterich et al. (Arbib, 2002). Finally, the
performance improvement observed with DT can be
attributed to their low accuracy as single techniques
in general that tend to be unstable due to their high
variance.
6 CONCLUSION
Ensemble methods in general, and bagging in
particular, are considered as serious candidates to
build strong BG predictors since they tend to find a
better variance/bias trade-off and therefore, improve
the overall prediction performance. Through this
comparative study, we built 120 bagged models for
BG prediction based on five single models and by
varying the number of estimators, the block-bootstrap
algorithms and the size of bootstraps. The results
show that the construction design adopted in this
article tend to build bagged ensembles with a
prediction performance very comparable to the values
achieved by single models trained alone. Regarding
deep learning models, it is generally observed that a
less significant performance improvement is noticed
after bagging in virtue of the native generalization
ability of neural networks. However, the BG signal
non-stationarity may present a limitation in building
base learners with a good diversity. We intend in a
future work to consider the effect of applying
powerful transformations such as Box-Cox
transformation in order to bring the series to a
stationary state which can help in building more
robust bagging predictors with higher diversity. The
investigation of heterogeneous ensembles by
combining learners with different techniques should
also be considered as they benefit from built-in
diversity.
REFERENCES
Abraham, S. B., Arunachalam, S., Zhong, A., Agrawal, P.,
Cohen, O., & McMahon, C. M. (2019). Improved Real-
World Glycemic Control With Continuous Glucose
Monitoring System Predictive Alerts. Journal of
Diabetes Science and Technology, 1932296819859334.
https://doi.org/10.1177/1932296819859334
Arbib, M. A. (2002). The Handbook of Brain Theory and
Neural Networks (2nd ed.). MIT Press.
Bergmeir, C., Hyndman, R. J., & Benítez, J. M. (2016).
Bagging exponential smoothing methods using STL
decomposition and Box–Cox transformation.
International Journal of Forecasting, 32(2), 303–312.
https://doi.org/10.1016/j.ijforecast.2015.07.002
Breiman, L. (1996). Bagging Predictors. Machine
Learning, 24(2), 123–140. https://doi.org/10.1023/A:
1018054314350
Clarke, W. L., Cox, D., Gonder-Frederick, L. A., Carter,
W., & Pohl, S. L. (1987). Evaluating clinical accuracy
of systems for self-monitoring of blood glucose.
Diabetes Care. https://doi.org/10.2337/diacare.
10.5.622
Cuocolo, R., Perillo, T., De Rosa, E., Ugga, L., & Petretta,
M. (2019). Current applications of big data and machine
learning in cardiology. Journal of Geriatric
Cardiology : JGC, 16(8), 601–607.
https://doi.org/10.11909/j.issn.1671-5411.2019.08.002
Diabetes Research in Children Network—Public Site.
(n.d.). Retrieved June 27, 2022, from
https://public.jaeb.org/direcnet/stdy
ICAART 2023 - 15th International Conference on Agents and Artificial Intelligence
576

EL Idrissi, T., Idri, A., & Bakkoury, Z. (2019). Systematic
map and review of predictive techniques in diabetes
self-management. International Journal of Information
Management, 46, 263–277. https://doi.org/10.
1016/j.ijinfomgt.2018.09.011
Hansen, L. K., & Salamon, P. (1990). Neural network
ensembles. IEEE Transactions on Pattern Analysis and
Machine Intelligence, 12(10), 993–1001. https://
doi.org/10.1109/34.58871
Hong, N., Park, H., & Rhee, Y. (2020). Machine Learning
Applications in Endocrinology and Metabolism
Research: An Overview. Endocrinology and
Metabolism, 35(1), 71–84. https://doi.org/10.
3803/EnM.2020.35.1.71
Hosni, M., Carrillo-de-Gea, J. M., Idri, A., Fernández-
Alemán, J. L., & García-Berná, J. A. (2019). Using
ensemble classification methods in lung cancer
disease*. 2019 41st Annual International Conference of
the IEEE Engineering in Medicine and Biology Society
(EMBC), 1367–1370. https://doi.org/10.1109/EMBC.
2019.8857435
Khadilkar, K. S., Bandgar, T., Shivane, V., Lila, A., &
Shah, N. (2013). Current concepts in blood glucose
monitoring. Indian Journal of Endocrinology and
Metabolism, 17(9), 643. https://doi.org/10.4103/2230-
8210.123556
Kim, Y. J., Jang, H., Lee, K., Park, S., Min, S.-G., Hong,
C., Park, J. H., Lee, K., Kim, J., Hong, W., Jung, H.,
Liu, Y., Rajkumar, H., Khened, M., Krishnamurthi, G.,
Yang, S., Wang, X., Han, C. H., Kwak, J. T., … Choi,
J. (2021). PAIP 2019: Liver cancer segmentation
challenge. Medical Image Analysis, 67, 101854.
https://doi.org/10.1016/j.media.2020.101854
Kreiss, J.-P., & Lahiri, S. N. (2012). 1—Bootstrap Methods
for Time Series. In T. Subba Rao, S. Subba Rao, & C.
R. Rao (Eds.), Handbook of Statistics (Vol. 30, pp. 3–
26). Elsevier. https://doi.org/10.1016/B978-0-444-
53858-1.00001-6
Oviedo, S., Vehí, J., Calm, R., & Armengol, J. (2017). A
review of personalized blood glucose prediction
strategies for T1DM patients. International Journal for
Numerical Methods in Biomedical Engineering, 33(6),
e2833. https://doi.org/10.1002/cnm.2833
Petropoulos, F., Hyndman, R. J., & Bergmeir, C. (2018).
Exploring the sources of uncertainty: Why does
bagging for time series forecasting work? European
Journal of Operational Research, 268(2), 545–554.
https://doi.org/10.1016/j.ejor.2018.01.045
Porwal, P., Pachade, S., Kokare, M., Deshmukh, G., Son,
J., Bae, W., Liu, L., Wang, J., Liu, X., Gao, L., Wu, T.,
Xiao, J., Wang, F., Yin, B., Wang, Y., Danala, G., He,
L., Choi, Y. H., Lee, Y. C., … Mériaudeau, F. (2020).
IDRiD: Diabetic Retinopathy – Segmentation and
Grading Challenge. Medical Image Analysis, 59,
101561. https://doi.org/10.1016/j.media.2019.101561
Viboud, C., Sun, K., Gaffey, R., Ajelli, M., Fumanelli, L.,
Merler, S., Zhang, Q., Chowell, G., Simonsen, L., &
Vespignani, A. (2018). The RAPIDD ebola forecasting
challenge: Synthesis and lessons learnt. Epidemics, 22,
13–21. https://doi.org/10.1016/j.epidem.2017.08.002
Wadghiri, M. Z., Idri, A., El Idrissi, T., & Hakkoum, H.
(2022). Ensemble blood glucose prediction in diabetes
mellitus: A review. Computers in Biology and
Medicine, 147, 105674. https://doi.org/10.1016/j.
compbiomed.2022.105674
Woldaregay, A. Z., Årsand, E., Walderhaug, S., Albers, D.,
Mamykina, L., Botsis, T., & Hartvigsen, G. (2019).
Data-driven modeling and prediction of blood glucose
dynamics: Machine learning applications in type 1
diabetes. Artificial Intelligence in Medicine, 98, 109–
134. https://doi.org/10.1016/j.artmed.2019.07.007
World Health Organization. (2019). Classification of
diabetes mellitus. https://apps.who.int/iris/rest/
bitstreams/1233344/retrieve
Zhou, Z.-H. (2012). Ensemble Methods: Foundations and
Algorithms (1st Edition). Chapman and Hall/CRC.
https://doi.org/10.1201/b12207
Bagged Ensembles for Blood Glucose Prediction: A Comparative Study
577
