
The Effects of Character-Level Data Augmentation on Style-Based
Dating of Historical Manuscripts
Lisa Koopmans
a
, Maruf A. Dhali
b
and Lambert Schomaker
c
Department of Artificial Intelligence, University of Groningen, The Netherlands
Keywords:
Data Augmentation, Document Analysis, Historical Manuscript Dating, Self-Organizing Maps, Neural
Networks, Support Vector Machines.
Abstract:
Identifying the production dates of historical manuscripts is one of the main goals for paleographers when
studying ancient documents. Automatized methods can provide paleographers with objective tools to estimate
dates more accurately. Previously, statistical features have been used to date digitized historical manuscripts
based on the hypothesis that handwriting styles change over periods. However, the sparse availability of
such documents poses a challenge in obtaining robust systems. Hence, the research of this article explores
the influence of data augmentation on the dating of historical manuscripts. Linear Support Vector Machines
were trained with k-fold cross-validation on textural and grapheme-based features extracted from historical
manuscripts of different collections, including the Medieval Paleographical Scale, early Aramaic manuscripts,
and the Dead Sea Scrolls. Results show that training models with augmented data improve the performance of
historical manuscripts dating by 1% - 3% in cumulative scores. Additionally, this indicates further enhance-
ment possibilities by considering models specific to the features and the documents’ scripts.
1 INTRODUCTION
Handwritten accounts, letters, and similar documents
provide essential information about history. To un-
derstand such historical manuscripts’ social and cul-
tural contexts, paleographers seek to identify their
script(s), author(s), location, and production date.
Traditionally, paleographers study manuscripts by
their writing materials, content, and handwriting
styles. However, these methods require specific do-
main knowledge, are timely processes, and lead to
subjective estimations. Additionally, repetitive phys-
ical handling leads to further degradation of valuable
documents.
The digitization of historical manuscripts has con-
tributed to their preservation and allowed for the de-
velopment of automatized methods through machine
learning. These tools are more objective than tradi-
tional methods and can aid paleographers in assess-
ing their hypotheses. Historical manuscript dating, in
particular, can benefit from this, as it can be required
to resort to physical methods, which have limited re-
liability and can be destructive.
a
https://orcid.org/0000-0001-6556-2600
b
https://orcid.org/0000-0002-7548-3858
c
https://orcid.org/0000-0003-2351-930X
Dates of digitized historical manuscripts have
been commonly predicted based on the hypothesis
that handwriting styles change over a period (He
et al., 2014). Thus, manuscripts could be dated
by identifying common characteristics in handwriting
specific to periods.
Due to the limited availability of historical
manuscripts, research has mainly focused on statis-
tical feature-extraction techniques. These statistical
methods extract the handwriting style by capturing
attributes such as curvature or slant or representing
the general character shapes in the documents (Bulacu
and Schomaker, 2007). However, for reliable results,
manuscripts need a sufficient amount of handwriting
to extract the handwriting styles.
Both traditional and automatized methods must
deal with data sparsity and the degradation of ancient
materials; new data can only be obtained by digitizing
or discovering more manuscripts. A possible solution
to this issue is data augmentation. Data augmenta-
tion is commonly used in machine learning to gen-
erate additional realistic training data from existing
data to obtain more robust models. However, infor-
mation on the handwriting styles is lost using stan-
dard techniques, such as rotating or mirroring the im-
ages. Character-level data augmentation could gener-
ate realistic samples simulating an author’s variability
124
Koopmans, L., Dhali, M. and Schomaker, L.
The Effects of Character-Level Data Augmentation on Style-Based Dating of Historical Manuscripts.
DOI: 10.5220/0011699500003411
In Proceedings of the 12th International Conference on Pattern Recognition Applications and Methods (ICPRAM 2023), pages 124-135
ISBN: 978-989-758-626-2; ISSN: 2184-4313
Copyright
c
2023 by SCITEPRESS – Science and Technology Publications, Lda. Under CC license (CC BY-NC-ND 4.0)

Figure 1: A document image from the Medieval Paleo-
graphical Scale (MPS) collection.
in handwriting.
Research on the style-based dating of digitized
historical manuscripts using data augmentation tech-
niques still needs to be done. Hence, the current
research will explore the effects of character-level
data augmentation on the style-based dating of dig-
itized historical manuscripts. Manuscript images
taken from the Medieval Paleographical Scale (MPS)
collections, the Bodleian Libraries of the University
of Oxford, the Khalili collections, and the Dead Sea
Scrolls were augmented with an elastic rubber-sheet
algorithm (Bulacu et al., 2009a). The first collection,
MPS, has medieval charters produced between 1300
and 1550 CE in four cities: Arnhem, Leiden, Leu-
ven, and Groningen. A number of early Aramaic,
Aramaic, and Hebrew manuscripts were taken from
the last three collections. Several statistical feature-
extraction methods on the textural and character level
were used to train linear Support Vector Machines
(SVM) with only non-augmented images and with
both non-augmented and augmented images.
2 RELATED WORKS
The main challenge in style-based dating is the se-
lection of feature-extraction techniques. Each script
has its own characteristics, which may not be rep-
resented well by every feature. Collections of his-
torical manuscripts written in various languages and
scripts have been digitized. For example, the Me-
dieval Paleographical Scale (He et al., 2016d) and the
Svenskt Diplomatariums huvudkartotek (SDHK) data
sets
1
are written in Roman script, consisting of me-
dieval Dutch and Swedish manuscripts respectively.
Moreover, the early Aramaic and Dead Sea Scrolls
collections (Shor et al., 2014) contain ancient texts in
Hebrew, Aramaic, Greek, and Arabic, dating from the
fifth century BCE (Before the Common Era) until the
Crusader Period (12th–13th centuries CE).
Statistical feature-extraction methods are com-
monly divided into textural-based features that cap-
1
https://sok.riksarkivet.se/SDHK
Figure 2: An Early Aramaic (EA) manuscript from the
Bodleian Libraries, University of Oxford (Pell. Aram. I).
ture textural information of the handwriting across
an entire image and grapheme-based features that
capture character-shape information. Graphemes ex-
tracted from a set of documents are used to train a
clustering method. The cluster representations form
a codebook, from which a probability distribution of
grapheme usage is computed for each document to
represent the handwriting styles.
A widely used textural feature is the ’Hinge’ fea-
ture, which captures a handwriting sample’s slant
and curvature information. The features are exten-
sions of the Hinge feature, which describes the joint
probability distribution of two hinged edge fragments
(Bulacu and Schomaker, 2007). In addition, Hinge
is extended to i.a., co-occurrence features Quad-
Hinge and CoHinge, which emphasize curvature and
shape information respectively (He and Schomaker,
2017b). Other features, such as curvature-free and
chain code features, have also been proposed (He and
Schomaker, 2017c), (Siddiqi and Vincent, 2010).
Connected Component Contours (CO3)
(Schomaker and Bulacu, 2004) is a grapheme-
based feature that describes the shape of a fully
connected contour fragment. As cursive handwriting
has large connected contour fragments, the feature
was extended to Fraglets (Bulacu and Schomaker,
2007), which parts the connected contours based
on minima in the fragments. Moreover, k contour
fragments (kCF) and k stroke fragments (kSF) fea-
tures were proposed that partition CO3 in k contour
and stroke fragments respectively (He et al., 2016b).
Finally, Junclets (He et al., 2015) represents junctions
in characters, which are constructed differently in
varying writing styles.
Much research on historical manuscript dating has
been done on the MPS data set, specifically by He et
al. In (He et al., 2014), they predicted dates with a
technique combining local and global Support Vec-
tor Regression, using Fraglets and Hinge features.
They later extended this work, proposing new fea-
tures such as kCF, kSF, and Junclets. In addition, they
The Effects of Character-Level Data Augmentation on Style-Based Dating of Historical Manuscripts
125

Figure 3: The binarized version of the image from Figure 1
with Otsu thresholding.
proposed the temporal pattern codebook (He et al.,
2016a), which maintains temporal information lost
in the commonly used Self-Organizing Map (SOM)
(Kohonen, 1990) to train codebooks. Finally, vari-
ous statistical feature-extraction methods were com-
pared for historical manuscript dating in (He and
Schomaker, 2017a).
While the MPS data set is relatively clean, it is not
representative of many other historical manuscripts.
In early works (Dhali et al., 2020), an initial frame-
work was proposed for the style-based dating of the
Dead Sea Scrolls. Unfortunately, the manuscripts
from this collection are heavily degraded; many
scrolls are fragmented, and ink traces have eroded
due to aging. Additionally, the number of labeled
manuscripts is small. Therefore, this collection
poses a challenge for automatized dating of historical
manuscripts.
Deep learning approaches have applied transfer
learning, meaning pre-trained neural networks were
fine-tuned using new data on a different task than ini-
tially trained for. This approach requires less data
than standard deep learning methods, enabling its
use for historical manuscript dating. For example,
(Wahlberg et al., 2016) used the Google ImageNet-
network and fine-tuned it using 11000 images from
the SDHK collection. However, this is large for a data
set of historical manuscripts. In (Hamid et al., 2019),
a group of pre-trained neural networks was fine-tuned
on the 3267 images from the MPS data set. The best-
performing model was shown to outperform statistical
methods.
While deep learning approaches show promising
results, it is still relevant to consider statistical meth-
ods. To train a neural network, the manuscripts’
images need to be partitioned into patches, possibly
leading to loss of information. To solve this prob-
lem, (Hamid et al., 2019) ensured that each patch
contained “3 to 4 lines of text with 1.5 to 2 words
per line” to extract the handwriting style. While this
was a solution for the MPS data set, it may not be for
smaller and more degraded collections, such as the
Dead Sea Scrolls. In contrast, statistical feature ex-
Figure 4: The binarized version of the image from Figure 2
using BiNet (Dhali et al., 2019).
traction does not require image resizing and considers
the handwriting style over the entire image.
3 METHODS
This section will present the dating model along with
data description, image processing, and feature ex-
traction techniques.
3.1 Data
3.1.1 MPS
The current research uses the MPS data set (He et al.,
2014),(He et al., 2016c), (He et al., 2016b), (He et al.,
2016d). Non-text content, such as seals, supporting
backgrounds, color calibrators, etc., have been re-
moved. Consequently, this data set provides relatively
clean images. However, some images have been de-
graded or still contain a small part of a seal or ribbon.
The data set is publicly available via Zenodo
2
.
The MPS data set contains 3267 images of char-
ters collected from four cities signifying four cor-
ners of the medieval Dutch language area. Figure 1
shows an example image. Charters were commonly
used to document legal or financial transactions or ac-
tions. Additionally, their production dates have been
recorded. For these charters, usually parchment and
sometimes paper was used.
The charters date from 1300 CE to 1550 CE. Due
to the evolution of handwriting being slow and grad-
ual, documents from 11 quarter century key years
with a margin of ± five years were included in the
data set. Hence, the data set consists of images of
charters from the medieval Dutch language area in the
periods 1300 ± 5, 1325 ± 5, 1350 ± 5, up to 1550 ±
5. Table 1 contains the number of charters in each key
year.
2
https://zenodo.org/record/1194357#.YrLU-OxBy3I
ICPRAM 2023 - 12th International Conference on Pattern Recognition Applications and Methods
126

Table 1: The number of samples over the key years of the MPS data set.
key year 1300 1325 1350 1375 1400 1425 1450 1475 1500 1525 1550
number of charters 106 164 199 386 311 323 501 423 372 241 241
3.1.2 Early Aramaic and Additional (EAA)
Manuscripts
In addition to the MPS data set, 30 images from the
early Aramaic, Aramaic, and Hebrew manuscripts
were used. For ease of refereeing to this second
dataset, EAA is used in the rest of the article, even
though EAA contains Aramaic and Hebrew in addi-
tion to early Aramaic scripts. A list of the EAA im-
ages used in this study can be found in the appendix
(see Table 5).For these selected manuscripts from the
EAA dataset, the dates were directly inferred from
dates or events recorded in the manuscripts (i.e., inter-
nally dated), and they are publicly available through
the Bodleian Libraries, University of Oxford
3
, the
Khalili collections
4
, and the Leon Levy Digital Li-
brary
5
. Their dates span from 456 BCE to 133 CE. An
example image is shown in Figure 2. In addition, the
data set contains several degraded manuscripts with
missing ink traces or only two or three lines of text.
3.2 Preprocessing
3.2.1 Label Refinement
The set of images from the EAA collections did not
contain sufficient samples for each year. Therefore,
the samples were manually classified based on histori-
cal periods identified by historians
6
. The time periods
and the corresponding number of samples are shown
in Table 2.
The Persian Period contained two groups of sam-
ples spread apart for more than 30 years. Under
the speculation that handwriting styles changed dur-
ing this time, these samples were split into two pe-
riods: the Early and Late Persian Periods. These
were not based on defined historical periods but on
the samples’ production years. Images from the up-
per bound of the year range in Table 2 were included
in the classes. The manuscripts from the Roman Pe-
riod were excluded as there were insufficient samples.
The images were relabeled according to the median of
their corresponding year ranges.
3
https://digital.bodleian.ox.ac.uk/
4
https://www.khalilicollections.org/all-
collections/aramaic-documents/
5
https://www.deadseascrolls.org.il/
6
https://www.deadseascrolls.org.il/learn-about-the-
scrolls/
3.2.2 Data Augmentation
To augment the data such that new samples simu-
late a realistic variability of an author’s handwrit-
ing, the Imagemorph program (Bulacu et al., 2009b)
was used. The program applies random elastic
rubber-sheet transforms to the data through local non-
uniform distortions, meaning that transformations oc-
cur on the components of characters. Consequently,
the Imagemorph algorithm can generate a large num-
ber of unique samples. For the augmented data to be
realistic, a smoothing radius of 8 and a displacement
factor of 1 were used, measured in units of pixels. As
images of the MPS data set required high memory,
three augmented images were generated per image.
Since the EAA data sets were small, 15 images were
generated per image.
3.2.3 Binarization
To extract only the handwriting, the ink traces in the
images were extracted through binarization. This re-
sulted in images with a white background represent-
ing the writing surface, and a black foreground rep-
resenting the ink of the handwriting. Otsu threshold-
ing (Otsu, 1979) was used for binarizing the MPS im-
ages, as the MPS data set is relatively clean, and it has
been successfully used in previous research with the
data set (He et al., 2014), (He and Schomaker, 2017a),
(He et al., 2016b). Otsu thresholding is an intensity-
based thresholding technique where the separability
between the resulting gray values (black and white) is
maximized. Figure 3 shows Figure 1 after binariza-
tion.
The EAA images were more difficult to bina-
rize using threshold-based techniques. So, for the
EAA images, we used BiNet: a deep learning-based
method designed specifically to binarize historical
manuscripts (Dhali et al., 2019). Figure 4 shows Fig-
ure 2 after binarization.
3.3 Feature Extraction
The handwriting styles of manuscripts were described
by five textural features and one grapheme-based fea-
ture. Since the MPS and the EAA data sets are written
in different scripts, features were chosen that perform
well across different scripts.
The Effects of Character-Level Data Augmentation on Style-Based Dating of Historical Manuscripts
127

Table 2: Division of EAA manuscripts across historical time periods. Note that these dates may not exactly be the same as
defined by historians.
Time period Year range Median year Number of samples
Early Persian Period 540 BCE - 400 BCE 470 BCE 12
Late Persian Period 400 BCE - 330 BCE 365 BCE 11
Hellenistic Period 330 BCE - 65 BCE 198 BCE 5
Roman Period 65 BCE - 325 CE 195 CE 2
3.3.1 Textural Features
Textural-based feature-extraction methods contain
statistical information on handwriting in a binarized
image by considering its texture. Textural-based fea-
tures capture handwriting attributes like slant, curva-
ture, and the author’s pen grip, represented in a prob-
ability distribution.
He et al. proposed the joint feature distribution
(JFD) principle, describing how new, more robust
features can be created (He and Schomaker, 2017a).
They identified two groups of such features: the spa-
tial joint feature distribution (JFD-S) and the attribute
joint feature distribution (JFD-A). The JFD-S princi-
ple derives new features by combining the same fea-
ture at adjacent locations, describing a larger area.
The JFD-A principle derives new features from dif-
ferent features at the same location and consequently
captures various properties.
Hinge (Bulacu and Schomaker, 2007): is obtained by
taking orientations α and β with α < β of two contour
fragments attached at one pixel and computing their
joint probability distribution. The Hinge feature cap-
tures the curvature and orientation in the handwriting.
23 angle bins were used for α and β.
CoHinge (He and Schomaker, 2017b): follows the
JFD-S principle, combining two Hinge kernels at two
different points x
i
, x
j
with a Manhattan distance l, and
is described by:
CoHinge(x
i
, x
j
) = [α
x
i
, β
x
i
, α
x
j
, β
x
j
] (1)
This shows that the CoHinge kernel over contour frag-
ments can be quantized into a 4D histogram. The
number of bins for each orientation α and β was set
to 10.
QuadHinge (He and Schomaker, 2017b): follows the
JDF-A principle, combining the Hinge kernel with
the fragment curvature measurement C( f
c
). Although
Hinge also captures curvature information, it focuses
on the orientation due to the small lengths of the con-
tour fragments or lengths of the hinge edges. The
fragment curvature measurement is defined as:
C(F
c
) =
p
(x
1
− x
2
)
2
+ (y
1
− y
2
)
2
s
. (2)
F
c
is a contour fragment with length s on an ink
trace with endpoints (x
1
, y
1
), (x
2
, y
2
). In addition, the
QuadHinge feature is scale-invariant due to agglomer-
ating the kernel with multiple scales. The QuadHinge
kernel can then be described through the Hinge kernel
and the fragment curvature measurement on contour
fragments F
1
, F
2
:
H(x
i
, s) = [α
x
i
, β
x
i
,C(F
1
),C(F
2
)] (3)
The number of bins of the orientations was set to 12,
and that for the curvature to 6, resulting in a dimen-
sionality of 5184.
DeltaHinge (He and Schomaker, 2014): is a rotation-
invariant feature generalizing the Hinge feature by
computing the first derivative of the Hinge kernel over
a sequence of pixels along a contour. Consequently, it
captures the curvature information of the handwriting
contours. The Delta-n-Hinge kernel is defined as:
(
∆
n
α(x
i
) =
∆
n−1
α(x
i
)−∆
n−1
α(x
i
+δl)
δl
∆
n
β(x
i
) =
∆
n−1
β(x
i
)−∆
n−1
β(x
i
+δl)
δl
(4)
Where n is the nth derivative of the Hinge kernel.
When used for writer identification, performance de-
creased for n > 1, implying that the feature’s ability
to capture writing styles decreased. Hence, the cur-
rent research used n = 1.
Triple Chain Code (TCC) (Siddiqi and Vincent,
2010): captures the curvature and orientation of the
handwriting by combining chain codes at three dif-
ferent locations along a contour fragment. The chain
code represents the direction of the next pixel, indi-
cated by a number between 1 to 8. TCC is defined
as:
TCC(x
i
, x
i+l
, x
i+2l
) = [CC(x
i
),CC(x
i+l
),CC(x
i+2l
)]
(5)
Where CC(x
i
) is the chain code at location x
i
, and
Manhattan distance l = 7.
3.3.2 Grapheme-Based Features
Grapheme-based features are allograph-level features
that partially or fully overlap with allographs in hand-
writing, described by a statistical distribution. The
handwriting style is then represented by the probabil-
ity distribution of the grapheme usage over a docu-
ment, computed with a common codebook.
Junclets (He et al., 2015): represents the crossing
points, i.e., junctions, in handwriting. Junctions are
ICPRAM 2023 - 12th International Conference on Pattern Recognition Applications and Methods
128

categorized into ‘L‘, ‘T‘, and ‘X‘ junctions with 2,
3, and 4 branches, respectively. In different time pe-
riods, the angles between the branches, the number
of branches, and the lengths of the branches can dif-
fer, making the feature appropriate for dating. Com-
pared to other grapheme-based features, this feature
does not need segmentation or line detection methods.
A junction is represented as the normalized stroke-
length distribution of a reference point in the ink over
a set of N = 120 directions. The stroke lengths are
computed with the Euclidean distance from a refer-
ence point in a direction until the edge of the ink. The
feature is scale-invariant and captures the ink-width
and stroke length.
3.3.3 Codebook
Previous research commonly used the Self-
Organizing Map (SOM) (Kohonen, 1990) unsu-
pervised clustering method to train the codebook (He
and Schomaker, 2017a). By using this, however,
temporal information in the input patterns is lost.
The partially supervised Self-Organizing Time Map
(SOTM) (Sarlin, 2013) maintains this information.
In (He et al., 2016a), SOTM showed an improved
performance for a grapheme-based feature compared
to SOM. Hence, the codebook was trained with
SOTM.
SOTM trains sub-codebooks D
t
for each time
period using the standard SOM (Kohonen, 1990),
with handwriting patterns Ω(t) from key year
y(t). The key years for the MPS (in CE)
and the EAA (in BCE) data sets were defined
as y(t) = {1300, 1325, 1350, ..., 1550}, and y(t) =
{470, 365, 198} respectively. The final codebook
D, is composed of the sub-codebooks D
t
: D =
{D
1
, D
2
, ..., D
n
}, with n key years. To maintain the
temporal information, the sub-codebooks are trained
in ascending order. The initial sub-codebook D
1
is
randomly initialized as no prior information exists
in the data set. The succeeding sub-codebooks are
initialized with D
t−1
and then trained. Algorithm
1 shows the pseudo-code obtained from (He et al.,
2016a).
To train the sub-codebooks, the Euclidean dis-
tance measure was used as it significantly decreased
training times. Each sub-codebook was trained for
500 epochs to ensure sufficient training took place.
The learning rate α
∗
decayed from α = 0.99 following
(6). The sub-codebooks were trained on a computer
cluster
7
.
α
∗
= α ·
1 −
current epoch
max epoch
(6)
7
https://wiki.hpc.rug.nl/peregrine/start
Algorithm 1: SOTM (He et al., 2016a).
t ⇐ 1
Randomly initialize D
t
Train D
t
using Ω(t) by the standard SOM
while t ≤ n do
t ⇐ t +1
Initialise D
t
using D
t−1
Train D
t
using Ω(t) by the standard SOM
end while
Output D = {D
1
, D
2
, ..., D
t
, ..., D
n
}
A historical manuscript’s feature vector was ob-
tained by mapping its extracted graphemes to their
most similar elements in the trained codebook, com-
puted via the Euclidean distance, and forming a his-
togram. Finally, the normalized histogram formed the
feature vector.
3.4 Post-Processing
The feature vectors of all features were small decimal
numbers, varying between 10
−2
and 10
−6
. To em-
phasize the differences between the feature vectors of
a type of feature, the feature vectors were normalized
between 0 and 1 based on the range of a feature’s fea-
ture vectors. A feature vector f is scaled according to
the following equations:
f
std
=
f − min( f )
max( f ) − min( f )
(7)
f
scaled
= f
std
· (max − min) + min (8)
Here, max and min are the maximum and mini-
mum values over the whole set of feature vectors of
a certain feature, while max( f ) and min( f ) are the
maximum and minimum values of the feature vector
f (Pedregosa et al., 2011).
3.5 Dating
3.5.1 Model
Historical manuscript dating can be regarded as a
classification or a regression problem. As the MPS
data set was divided into 11 classes (or key years)
with clear borders, and the EAA data set was parti-
tioned into classes, it was regarded as a classification
problem. Following previous research on the MPS
data set (He and Schomaker, 2017a), linear Support
Vector Machines (SVM) were used for date predic-
tion with a one-versus-all strategy.
3.5.2 Measures
The Mean Absolute Error (MAE) and the Cumulative
Score (CS) are two commonly used metrics to evalu-
The Effects of Character-Level Data Augmentation on Style-Based Dating of Historical Manuscripts
129
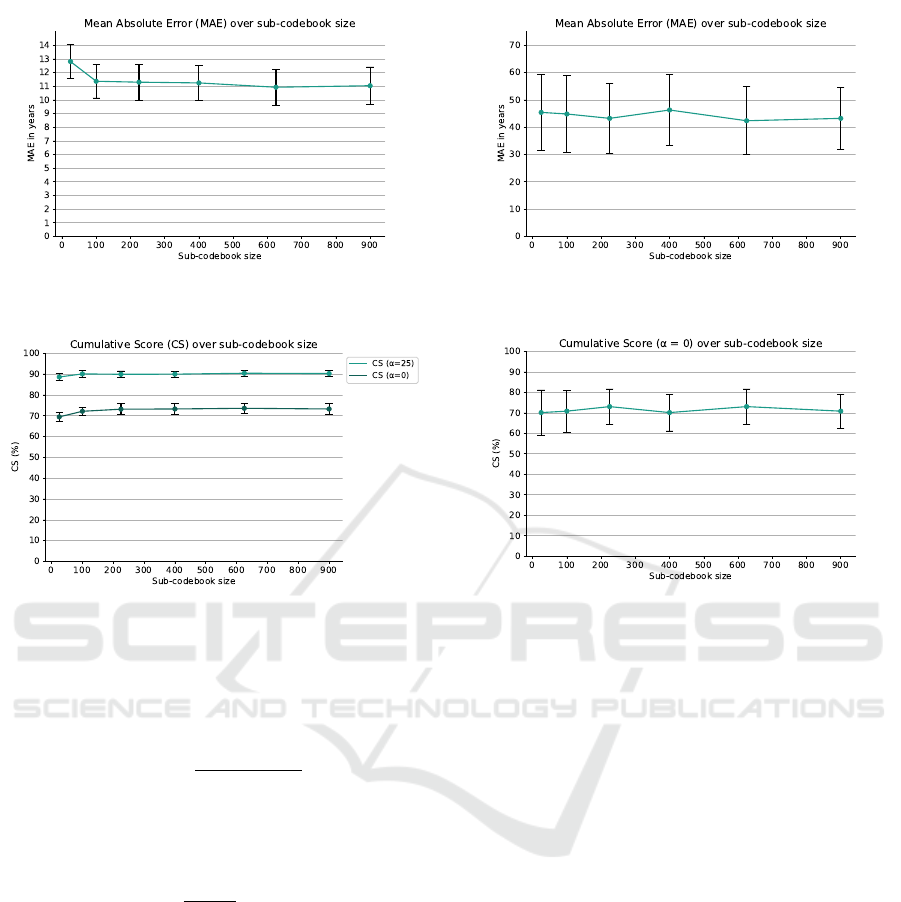
Figure 5: MAE over sub-codebook size on non-augmented
MPS data from 10-fold cross-validation.
Figure 6: CS with α = 25 and α = 0 years over sub-
codebook size on non-augmented MPS data from 10-fold
cross-validation.
ate model performance for historical manuscript dat-
ing. The MAE is defined as follows:
MAE =
∑
N−1
i=0
|y
i
− ¯y
i
|
N
(9)
Here, y
i
is a query document’s ground truth, and ¯y
i
is
its estimated year. N is the number of test documents.
The CS is defined in (Geng et al., 2007) as
CS =
N
e<=α
N
· 100% (10)
The CS describes the percentage of test images that
are predicted with an absolute error e no higher than
a number of years α. At α = 0 years, the CS is equal
to the accuracy.
For both the MPS and the EAA data sets, CS with
α = 0 years was used. Since paleographers generally
consider an absolute error of 25 years acceptable, and
the MPS set has key years spread apart by 25 years,
CS with α = 25 years was also used for this data set.
3.5.3 Experiments
The MPS images were randomly split into a test and
training set, containing 10% and 90% of the data, re-
spectively. The EAA images were split into a test set
Figure 7: MAE over sub-codebook size on non-augmented
EAA data from 4-fold cross-validation.
Figure 8: CS with α = 0 years over sub-codebook size on
non-augmented EAA data from 4-fold cross-validation.
of 5 images and a training set of 23 images. 2 samples
were included from classes 470 and 365 BCE each.
As the class 198 BCE contained only five images, one
image from this class was considered in the test set.
The images were sorted based on their labels, and the
first images of each class were selected for testing.
The models were tuned with stratified k-fold
cross-validation for both data sets, as they were im-
balanced. For the MPS data set, k = 10. Since
the training set of the EAA data set contained only
four images from 198 BCE, k = 4 for this set. To
prevent a randomized split in each iteration of the
k-fold cross-validation from affecting the selection
of hyper-parameters, hyper-parameters were selected
using the mean results of stratified k-fold cross-
validation across six random seeds, ranging from 0 to
250 with steps of 50. The set of values considered for
the hyper-parameters were 2
n
, n = −7, −6, −5, ..., 10.
During the process, the augmented images of those
in the validation and test sets were excluded from the
training sets.
Models were trained in two conditions. In the
non-augmented condition only non-augmented im-
ages were used, and in the augmented condition both
augmented and non-augmented images were used for
training.
ICPRAM 2023 - 12th International Conference on Pattern Recognition Applications and Methods
130
Codebook. Different sub-codebook sizes can result
in different model performances. Hence, various sub-
codebook sizes were tested to obtain the size for the
Junclets feature. A codebook’s size is its total num-
ber of nodes, i.e., n
columns
· n
rows
. The full codebook
D is the concatenation of the sub-codebooks D
t
, and
thus its size will be size
D
t
· n
classes
. The set of sub-
codebook sizes s = {25, 100, 225, 400, 625, 900} with
n
columns
= n
rows
were considered. These conditions
were the same for the MPS and the EAA images.
Since different codebook sizes result in different fea-
tures, the sub-codebook sizes were determined based
on the validation results of models trained on only
non-augmented images.
The code used for the experiments and the SOTM
is publicly available
8
.
4 RESULTS
To explore the effects of data augmentation on the
style-based dating of historical manuscripts, five tex-
tural features and one grapheme-based feature were
used. Linear SVMs were trained using only non-
augmented data in the ’non-augmented’ condition,
and using both augmented and non-augmented data
in the ’augmented’ condition. The models were tuned
with stratified 10-fold (MPS) and 4-fold (EA) cross-
validation and tested on a hold-out set containing only
non-augmented data. The test set of the MPS data
set contained 10% of the data, and that of the EAA
dataset contained 17.8% (5 images) of the data.
The models were evaluated with the MAE and CS
with α = 0 years (i.e. accuracy). In addition, the MPS
data set was also evaluated with CS with α = 25 years.
4.1 Sub-codebook Size
To investigate Junclets, first, an optimal sub-
codebook size needed to be selected. Results of k-fold
cross-validation for sub-codebook sizes 25, 100, 225,
400, 625, and 900 were evaluated on non-augmented
data.
Figures 5 and 6 show the MAE and CS for the
MPS data set over sub-codebook size, respectively.
The MAE shows a minimum at the sub-codebook
size of 625. Moreover, CS with α = 25 and α = 0
years show a maximum at sub-codebook size 625.
Therefore, Junclets features were obtained with sub-
codebooks of size 625 on the MPS data.
Figure 7 displays the MAE over the sub-codebook
size on validation results for the EAA data. The MAE
8
https://github.com/Lisa-dk/Bachelor-s-thesis.git
decreases until the sub-codebook size is 225, after
which it fluctuates. This is reflected in the CS with
α = 0 years (Figure 8), which displays an increase
until size 225, after which it fluctuates. In addition,
the standard deviations for the MAE and CS (α = 0)
appear the smallest here. Hence, a sub-codebook size
of 225 was chosen for the EAA data.
Figure 9: MAE on MPS (unseen) test data across non-
augmented and augmented conditions.
Figure 10: CS with α = 25 years on MPS (unseen) test data
across non-augmented and augmented conditions.
Figure 11: CS with α = 0 years on MPS (unseen) test data
across non-augmented and augmented conditions.
The Effects of Character-Level Data Augmentation on Style-Based Dating of Historical Manuscripts
131
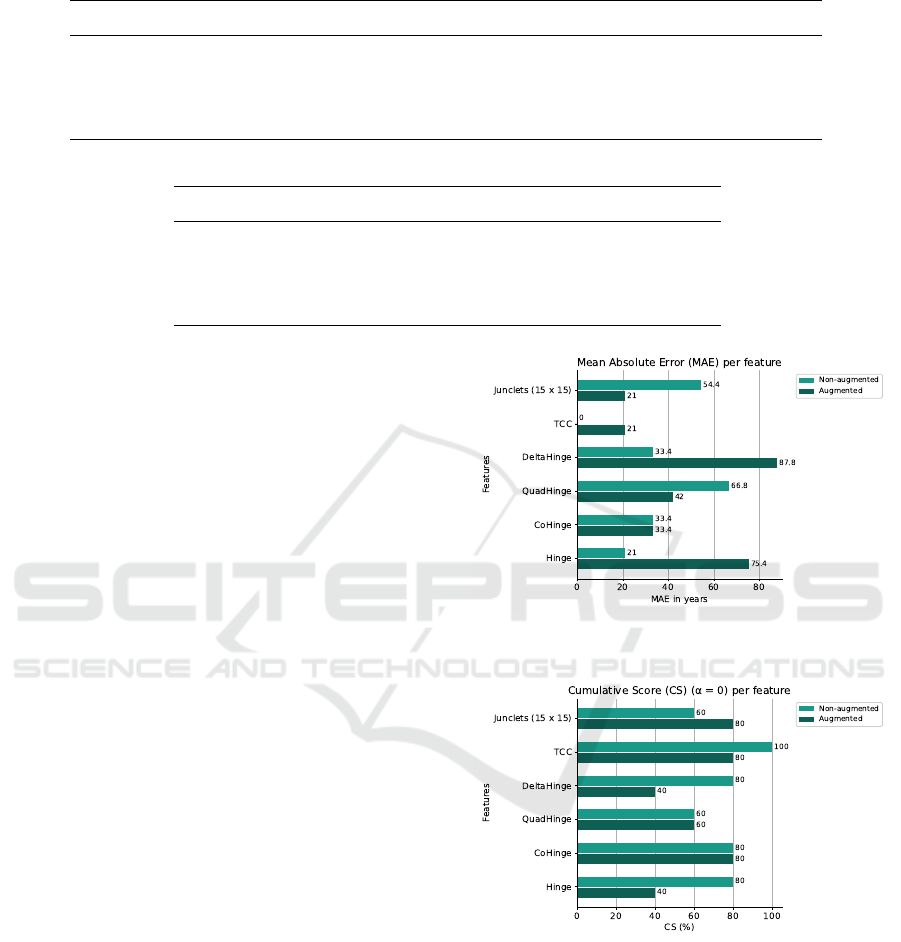
Table 3: k-Fold cross-validation results on the MPS data set.
Non-augmented Augmented Non-augmented Augmented Non-augmented Augmented
Feature MAE MAE CS (α=25) CS (α=25) CS (α=0) CS (α=0)
Junclets 10.93 ± 1.31 9.15 ± 1.29 90.35 ± 1.49 92.39 ± 1.51 73.53 ± 2.45 77.56 ± 2.31
TCC 9.47 ± 1.08 8.95 ± 1.17 91.37 ± 1.39 92.16 ± 1.47 77.00 ± 1.85 77.98 ± 2.10
DeltaHinge 20.08 ± 1.88 18.35 ± 1.55 81.59 ± 1.96 83.00 ± 1.78 61.60 ± 2.25 63.91 ± 2.10
QuadHinge 5.76 ± 0.97 5.74 ± 0.97 95.38 ± 1.16 95.44 ± 1.17 84.65 ± 1.89 84.53 ± 1.94
CoHinge 6.81 ± 0.96 6.48 ± 0.88 94.32 ± 1.23 94.59 ± 1.17 82.13 ± 1.93 82.64 ± 1.95
Hinge 11.55 ± 1.44 11.28 ± 1.38 89.42 ± 1.74 89.36 ± 1.76 73.60 ± 2.55 73.76 ± 2.52
Table 4: k-Fold cross-validation results on the EAA data set.
Non-augmented Augmented Non-augmented Augmented
Feature MAE MAE CS (α=0) CS (α=0)
Junclets 43.22 ± 12.80 40.40 ± 20.78 73.05 ± 8.66 70.28 ± 13.68
TCC 47.26 ± 12.52 57.92 ± 18.77 71.94 ± 10.59 65.42 ± 12.53
DeltaHinge 46.72 ± 9.13 45.54 ± 22.79 65.83 ± 8.20 75.55 ± 12.80
QuadHinge 38.97 ± 13.53 29.92 ± 15.72 76.67 ± 8.10 82.08 ± 9.41
CoHinge 48.18 ± 8.74 38.95 ± 20.93 64.44 ± 7.97 75.28 ± 12.69
Hinge 33.84 ± 13.43 26.17 ± 20.63 79.86 ± 7.07 84.44 ± 11.28
4.2 Augmentation
4.2.1 MPS
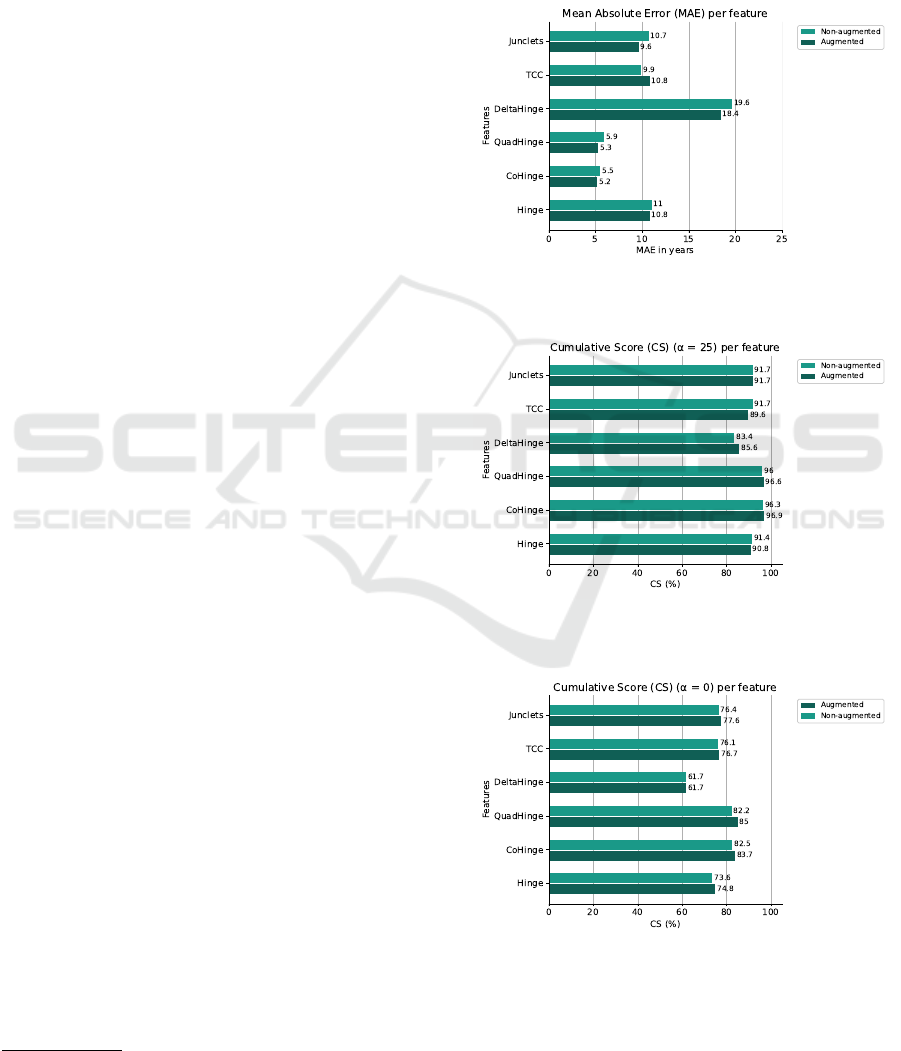
Figure 9 shows the MAE for each feature across the
augmented and non-augmented conditions. The MAE
for TCC increased in the augmented condition com-
pared to the non-augmented condition. All other fea-
tures displayed a decrease in the augmented condi-
tion.
Figure 10 shows the CS with α = 25 years for
both non-augmented and augmented conditions. An
increase occurred in the augmented condition com-
pared to the non-augmented condition for all features,
except for TCC and Hinge, which display a decrease.
Additionally, Junclets did not change in performance
across conditions.
As displayed in Figure 11, all features showed an
increase in CS with α = 0 years in the augmented con-
dition compared to the non-augmented condition with
the exception of DeltaHinge. This feature showed no
change in performance on test data.
These results denote an overall increase in perfor-
mance for all features, with the exception of TCC.
However, the changes in performances are small,
which is reflected in the validation results displayed in
Table 3, where changes between the non-augmented
and augmented conditions are insignificant. This is
indicated by means of the measures in augmented
conditions falling within the ranges denoted by the
standard deviations of the non-augmented conditions.
4.2.2 EAA Collections
Figures 12 and 13 show the MAE and CS with α = 0
years across all features for the EAA data set. Perfor-
mance increased for Junclets in the augmented con-
dition compared to the non-augmented condition, in-
Figure 12: MAE on EAA (unseen) test data across non-
augmented and augmented conditions.
Figure 13: CS with α = 0 years on EAA (unseen) test data
across non-augmented and augmented conditions.
dicated by the decrease in MAE and increase in ac-
curacy. QuadHinge also showed an increase in per-
formance as the MAE decreased in the augmented
condition. A decrease in performance for TCC,
DeltaHinge, and Hinge features is denoted by an in-
crease in MAE and a reduction in accuracy. CoHinge
displayed no change across conditions.
These results are not reflected in the validation re-
sults (Table 4), where Junclets and TCC displayed
ICPRAM 2023 - 12th International Conference on Pattern Recognition Applications and Methods
132

a decrease in performance with a reduction in mean
MAE and an increase in mean accuracy in the aug-
mented condition compared to the non-augmented
condition. DeltaHinge, QuadHinge, CoHinge, and
Hinge, however, displayed the opposite. Addition-
ally, standard deviations increased significantly in the
augmented condition compared to the non-augmented
condition.
4.2.3 Significance
A statistical test (ANOVA, (Cuevas et al., 2004)) was
performed to see if the results showed significant
improvement. For the MPS data, the results from
Junclets feature were statistically significant for both
MAE and CS, with p-values much smaller than 0.005.
However, for the EAA data, it did not show any sig-
nificance for any of the feature extraction techniques.
5 DISCUSSION
The current study explores the effects of character-
level data augmentation on the style-based dating of
historical manuscripts using images from the MPS
and EAA collections. Images were augmented with
the Imagemorph program (Bulacu et al., 2009b) and
then binarized. Linear SVMs were trained on five
textural features and one grapheme-based feature.
The grapheme-based feature Junclets was obtained
by mapping extracted junction representations to a
codebook trained with SOTM (Sarlin, 2013). Experi-
ments were conducted to determine the sub-codebook
sizes. SVMs were trained in ‘non-augmented’ and
‘augmented’ conditions where only non-augmented
images and both non-augmented and augmented im-
ages were used, respectively. Models were evaluated
through the MAE and CS with α-values of 0 and 25
years.
5.1 Key Findings
5.1.1 MPS
Test results showed that linear SVMs trained on
MPS data in the augmented condition displayed an
overall increased performance compared to the non-
augmented condition for all features except TCC.
TCC showed a decrease in performance. How-
ever, these increases and decreases were small, and
changes in validation results were insignificant, with
the ranges of the standard deviations and means over-
lapping across conditions.
The MPS images require much computer mem-
ory and, consequently, long running times to acquire
the features and models. Specifically, obtaining the
Junclets features required several days. Hence, only
three augmented images per MPS image were gen-
erated. Were more images generated, results might
have shown a clearer picture of the influence of data
augmentation on historical manuscript dating.
Another possible explanation for the small
changes in performance shown by the MPS data set
results is that MPS images were augmented before bi-
narization. The Imagemorph program applies a Gaus-
sian filter over local transformations. Consequently,
if it is applied before binarization, the background’s
influence leads to less severe distortions than if it is
applied after binarization. Although the distortions
were noticeable, they might have been too light to
produce samples with natural within-writer variabil-
ity. Whether this significantly affected the results is
uncertain and should be considered in the future.
5.1.2 EAA Collections
Models trained on the EAA data set showed increased
performance in the augmented condition compared to
the non-augmented condition for Junclets and Quad-
Hinge on test data. On the other hand, models for
TCC, DeltaHinge, and Hinge showed a decreased per-
formance in the augmented condition, and CoHinge
showed no change in performance on test data. How-
ever, this is not reflected in the validation results (Ta-
ble 4). Instead, validation results show a decrease in
performance in the augmented condition for Junclets
and TCC compared to the non-augmented condition,
and an increase in performance for the remaining fea-
tures.
The results of the EAA data could be explained
by the increase in standard deviations across all fea-
tures for models trained on both augmented and non-
augmented data compared to models trained on only
non-augmented data. This increase indicates that
models were less robust to new data in the augmented
condition, which may have led to diverging test re-
sults. Additionally, the differences between test re-
sults and validation results within the conditions, e.g.,
QuadHinge, indicate overfitting. This likely follows
from the small size of the data set.
A possible reason why models trained with the
EAA data set were less robust in the augmented con-
dition is that linear SVMs were inappropriate for the
data. While they previously worked well for the Ro-
man script on the MPS data set, temporal information
in the features extracted from EAA may follow non-
linear patterns. Data augmentation could have empha-
sized these non-linear patterns, making linear models
too rigid.
The Effects of Character-Level Data Augmentation on Style-Based Dating of Historical Manuscripts
133

5.2 Future Research
Scripts have different characteristics, possibly re-
sulting in differing distributions of extracted fea-
tures. Likewise, individual features capture varying
attributes of handwriting. Therefore, temporal infor-
mation on handwriting styles might follow different
trends across various features. While linear SVMs
performed well on the MPS data set for the features
used in the current research, these potential differ-
ences in distributions were not considered. This could
lead to a decrease in performance for models trained
on augmented data. Hence, other kernels should be
studied to obtain optimal models for individual fea-
tures and scripts.
One of the risks with historical manuscript dating
is that the majority of the samples from a period, or a
year, originate from one writer. Rather than learning
to distinguish between characteristics in handwriting
styles specific to a particular period or year, models
would learn traits specific to writers for these years.
Data augmented to simulate variability between writ-
ers within time periods might lead to more robust
models than when data is augmented to simulate a re-
alistic within-writer variability.
As mentioned in Section 2, deep learning ap-
proaches outperformed statistical approaches on the
MPS data set. Considering this, it would be in-
teresting to investigate whether data augmentation
might positively affect historical manuscript dating
on smaller and heavier degraded manuscripts, such as
the EAA collections. Moreover, using the shape evo-
lution of individual characters with grapheme-based
statistical features might bypass the issue of limited
data and loss of information due to the resizing of im-
ages.
ACKNOWLEDGEMENT
The study for this article collaborated with several re-
search outcomes from the European Research Coun-
cil (EU Horizon 2020) project: The Hands that Wrote
the Bible: Digital Palaeography and Scribal Culture
of the Dead Sea Scrolls (HandsandBible 640497),
principal investigator: Mladen Popovi
´
c. Furthermore,
for the high-resolution, multi-spectral images of the
Dead Sea Scrolls, we are grateful to the Israel An-
tiquities Authority (IAA), courtesy of the Leon Levy
Dead Sea Scrolls Digital Library; photographer: Shai
Halevi. Additionally, we express our gratitude to the
Bodleian Libraries, University of Oxford, the Khalili
collections, and the Staatliche Museen zu Berlin (pho-
tographer: Sandra Steib) for the early Aramaic im-
ages. We also thank Petros Samara for collecting the
Medieval Paleographical Scale (MPS) dataset for the
Dutch NWO project. Finally, we thank the Center for
Information Technology of the University of Gronin-
gen for their support and for providing access to the
Peregrine high-performance computing cluster.
REFERENCES
Bulacu, M., Brink, A., Van Der Zant, T., and Schomaker, L.
(2009a). Recognition of handwritten numerical fields
in a large single-writer historical collection. In 2009
10th international conference on document analysis
and recognition, pages 808–812. IEEE.
Bulacu, M., Brink, A., Zant, T., and Schomaker, L. (2009b).
Recognition of handwritten numerical fields in a large
single-writer historical collection. pages 808–812.
Note: this is a peer-reviewed conference paper on
an important international conference series, ICDAR;
2009 10th International Conference on Document
Analysis and Recognition ; Conference date: 26-07-
2009 Through 29-07-2009.
Bulacu, M. and Schomaker, L. (2007). Text-independent
writer identification and verification using textural and
allographic features. IEEE Transactions on Pattern
Analysis and Machine Intelligence, 29(4):701–717.
Cuevas, A., Febrero, M., and Fraiman, R. (2004). An anova
test for functional data. Computational statistics &
data analysis, 47(1):111–122.
Dhali, M., Wit, J., and Schomaker, L. (2019). Binet:
Degraded-manuscript binarization in diverse docu-
ment textures and layouts using deep encoder-decoder
networks. ArXiv. 26 pages, 15 figures, 11 tables.
Dhali, M. A., Jansen, C. N., de Wit, J. W., and Schomaker,
L. (2020). Feature-extraction methods for histori-
cal manuscript dating based on writing style develop-
ment. Pattern Recognition Letters, 131:413–420.
Geng, X., Zhou, Z.-H., and Smith-Miles, K. (2007). Au-
tomatic age estimation based on facial aging patterns.
IEEE Transactions on Pattern Analysis and Machine
Intelligence, 29(12):2234–2240.
Hamid, A., Bibi, M., Moetesum, M., and Siddiqi, I.
(2019). Deep learning based approach for histori-
cal manuscript dating. In 2019 International Con-
ference on Document Analysis and Recognition (IC-
DAR), pages 967–972.
He, S., Samara, P., Burgers, J., and Schomaker, L. (2014).
Towards style-based dating of historical documents.
In 14th International Conference on Frontiers in
Handwritten Recognition. IEEE. 14th International
Conference on Frontiers in Handwriting Recognition
; Conference date: 01-09-2014 Through 04-09-2014.
He, S., Samara, P., Burgers, J., and Schomaker, L. (2016a).
Historical manuscript dating based on temporal pat-
tern codebook. Computer Vision and Image Under-
standing, 152:167–175.
He, S., Samara, P., Burgers, J., and Schomaker, L. (2016b).
Image-based historical manuscript dating using con-
ICPRAM 2023 - 12th International Conference on Pattern Recognition Applications and Methods
134

tour and stroke fragments. Pattern Recognition,
58:159–171.
He, S., Samara, P., Burgers, J., and Schomaker, L. (2016c).
A multiple-label guided clustering algorithm for his-
torical document dating and localization. IEEE Trans-
actions on Image Processing, 25(11):5252–5265.
He, S. and Schomaker, L. (2014). Delta-n hinge:
Rotation-invariant features for writer identification. In
22th International Conference on Pattern Recogni-
tion (ICPR), pages 2023–2028. IEEE (The Institute
of Electrical and Electronics Engineers). 22nd Inter-
national Conference on Pattern Recognition (ICPR)
2014 ; Conference date: 24-08-2014 Through 28-08-
2014.
He, S. and Schomaker, L. (2017a). Beyond OCR: Multi-
faceted understanding of handwritten document char-
acteristics. Pattern Recognition, 63:321–333.
He, S. and Schomaker, L. (2017b). Co-occurrence fea-
tures for writer identification. In Proceedings of In-
ternational Conference on Frontiers in Handwriting
Recognition, ICFHR, pages 78–83. Institute of Elec-
trical and Electronics Engineers Inc.
He, S. and Schomaker, L. (2017c). Writer identification
using curvature-free features. Pattern Recognition,
63:451–464.
He, S., Schomaker, L., Samara, P., and Burgers, J. (2016d).
MPS Data set with images of medieval charters for
handwriting-style based dating of manuscripts.
He, S., Wiering, M., and Schomaker, L. (2015). Junc-
tion detection in handwritten documents and its ap-
plication to writer identification. Pattern Recognition,
48(12):4036–4048.
Kohonen, T. (1990). The self-organizing map. Proceedings
of the IEEE, 78(9):1464–1480.
Otsu, N. (1979). A threshold selection method from gray-
level histograms. IEEE Transactions on Systems,
Man, and Cybernetics, 9(1):62–66.
Pedregosa, F., Varoquaux, G., Gramfort, A., Michel, V.,
Thirion, B., Grisel, O., Blondel, M., Prettenhofer,
P., Weiss, R., Dubourg, V., Vanderplas, J., Passos,
A., Cournapeau, D., Brucher, M., Perrot, M., and
Duchesnay, E. (2011). Scikit-learn: Machine learning
in Python. Journal of Machine Learning Research,
12:2825–2830.
Sarlin, P. (2013). Self-organizing time map: An abstraction
of temporal multivariate patterns. Neurocomputing,
99:496–508.
Schomaker, L. and Bulacu, M. (2004). Automatic writer
identification using connected-component contours
and edge-based features of uppercase western script.
IEEE Transactions on Pattern Analysis and Machine
Intelligence, 26(6):787–798.
Shor, P., Manfredi, M., Bearman, G. H., Marengo, E.,
Boydston, K., and Christens-Barry, W. A. (2014). The
leon levy dead sea scrolls digital library: The digitiza-
tion project of the dead sea scrolls. Journal of East-
ern Mediterranean Archaeology and Heritage Studies,
2(2):71–89.
Siddiqi, I. and Vincent, N. (2010). Text independent
writer recognition using redundant writing patterns
with contour-based orientation and curvature features.
Pattern Recognition, 43(11):3853–3865.
Wahlberg, F., Wilkinson, T., and Brun, A. (2016). Histori-
cal manuscript production date estimation using deep
convolutional neural networks. In 2016 15th Interna-
tional Conference on Frontiers in Handwriting Recog-
nition (ICFHR), pages 205–210.
APPENDIX
Table 5: The list of EAA images used in this research.
A6 11R A6 8 NS A1r
A6 12R B3 1 NS A2r
A6 13R IA01 NS A4r
A6 14 IA03 NS A5r
A6 15 IA04 NS A6r
A6 16 IA06 NS C1r
A6 3 IA17 NS C4r
A6 4 IA21 WDSP1 1
A6 5 Mur24 1 WDSP2
A6 7 Mur24 2
Maresha
Ostracon
The Effects of Character-Level Data Augmentation on Style-Based Dating of Historical Manuscripts
135
