
Physiological Data Recording in VR Simulator for Sleepiness Detection
During Driving
Chevallier Baptiste
1,2 a
, Istrate Dan
1 b
, Zalc Vincent
1 c
, Vera Nicolas
2
and Labrousse Christophe
2,3
1
Biomechanics and Bioengineering, UMR CNRS 7338, Universit
´
e de Technologie de Compi
`
egne, Compi
`
egne, France
2
CoreForTech, FIPSICO, Lille, France
3
PredexIA, Toulouse, France
Keywords:
Augmented Reality, Heart Rate Variability, PPG, EEG, Signal Preprocessing.
Abstract:
Drowsy driving is a major issue in road safety. In this paper, we propose a description of an experimental
data collection to develop a drowsiness detection model. The objective of this data collection was mainly to
gather physiological data of individuals in simulated driving situations. We designed a realistically annoying
scenario to induce fatigue while staying close to real driving conditions. The experiment was run on an
augmented reality platform called CAVE. The need for contextualization came early in the design of the
experiment. Therefore, in addition to physiological data, we added much more data sources, from driving
habits to driving behaviour in addition to self-assessment of fatigue levels and the gold standard (EEG). As a
result, this experience helped us create a data set of physiological data completed by elements of context and
driving behaviour. Thus allowing us to perform a very rich analysis of these physiological data.
1 INTRODUCTION
Drowsy driving is one of the deadliest causes of acci-
dents (Board, 1999). Yet it is really difficult to esti-
mate the part of drowsiness among other causes of ac-
cidents because fatigue isn’t easy to measure after an
accident. While drug use can be measured in blood,
speeding can be evaluated from structure deformation
but the equivalent analysis is impossible with drowsi-
ness.
Therefore, industrial (Friedrichs and Yang, 2010)
and political (EuropeanCommission, 2021) actors are
actively trying to find solutions to detect drowsiness
and alert drivers while he is still awake. From a
broader perspective, monitoring driver attention on
the driving task will be a major challenge for future
vehicles. Autonomous driving cars is a very popular
topic and major car companies are trying to make this
a reality. For the next generation of vehicles to come,
the autonomous level will be at 3, which means the
driver isn’t required to keep his hand on the wheel but
should be able to take back control at any time. There-
fore drowsiness and attention monitoring will be key,
a
https://orcid.org/0000-0003-3331-3786
b
https://orcid.org/0000-0001-5906-4947
c
https://orcid.org/0000-0001-5325-6649
as the car should ensure the driver will be able to take
that control back.
Our vehicles are becoming more of computers on
wheels. They are full of sensors gathering data on the
road, on the driver, or on the weather. Our approach
is to replicate the type of information available in a
modern car and use the combination of this data to de-
tect drowsiness. In this study, we tried to gather data
used in a multitude of systems. We record driving
behaviour-related data, video of the face, and physio-
logical signals, thus covering the three main solutions
developed to detect drowsy driving.
Doing that we set two important constraints for
our experiment. First, it should be immersive for the
subject. Being able to offer a driving environment
closer to reality will help to record more relevant data
as the subject will have close-to-reality reactions. The
second, constraint is to limit the invasiveness of sen-
sors. We thought that sensors used in the experiment
should be able to be used in real driving situations
by everyone. This is why we chose small Bluetooth
sensors which didn’t interfere with the subject driving
actions.
In this paper, we will describe the used hardware
and explain how we set up the experimental scenario.
We will then go through all the collected data and how
we processed them in order to create a clean and rich
408
Chevallier, B., Istrate, D., Zalc, V., Vera, N. and Labrousse, C.
Physiological Data Recording in VR Simulator for Sleepiness Detection During Driving.
DOI: 10.5220/0011698100003414
In Proceedings of the 16th International Joint Conference on Biomedical Engineering Systems and Technologies (BIOSTEC 2023) - Volume 5: HEALTHINF, pages 408-415
ISBN: 978-989-758-631-6; ISSN: 2184-4305
Copyright
c
2023 by SCITEPRESS – Science and Technology Publications, Lda. Under CC license (CC BY-NC-ND 4.0)

database. We will also give the results of our first
analysis.
The experiment took place in France, in order to
record data from subjects we have obtained an agree-
ment with the ethical research committee of Sorbonne
University (CER-SU) on protocol n°CER-2021-018.
2 RELATED WORK
Many studies have been conducted to develop drowsi-
ness detection systems (Sahayadhas et al., 2012). We
can divide them into three major categories.
The first category is the analysis of driving be-
haviour using vehicle information like steering wheel
angle or lane departure detection. Datasets have been
recorded by car manufacturers in real driving condi-
tions (Friedrichs and Yang, 2010) but most commonly
in simulated conditions like (Chai et al., 2019). Using
the first approach you aim to develop a system that
can easily be embedded in a vehicle. The latest ap-
proach aims to gather the maximum data possible to
find out which are the most important signals. Mod-
els have been developed to anticipate behaviour that
might be dangerous on the road such as (Kim et al.,
2017) work. Other models use this information to
provide personalised help to the driver (Hori et al.,
2016).
The second category uses cameras to analyse
driver faces, especially eye closure or blinking like
in (McKinley et al., 2011) and (Abe et al., 2011).
The latest approaches in this domain use deep learn-
ing methods to process images and show good results
in both detection and anticipation of drowsy events
(de Naurois et al., 2019)
The third approach is based on physiological sig-
nal analysis. It may be based on Electroencephalo-
gram (EEG) and Electrooculogram (EOG) but these
approaches are tough to use on real driving condi-
tions due to vehicle vibration, static electricity and
limited embeddability of devices. Cardiac signals like
Electrocardiogram (ECG) and Photoplethysmoraphy
(PPG) also seem to carry enough information and are
easier to implement in real cars with more consumer-
friendly sensors. Additionally, PPG provide an easy
set-up and a non-intrusive driving experience com-
pared with EEG and EOG.
Paper Contribution: In this paper, we present a
multi-source dataset for drowsiness detection. Our
approach aims to bring simulated driving experiments
to a new level, not by using cutting-edge technologies
but through sensors and signals that can realistically
be measured in real driving conditions for direct use
in ecological conditions.
3 DATA COLLECTION PROCESS
3.1 Inclusion Phase
According to ethical criteria and constraints related to
the study, subjects were exclusively recruited within
Universit
´
e de Technologie de Compi
`
egne (UTC).
They were either students, professors, researchers or
members of the administration that were contacted
thanks to internal weekly communication. Subjects
were invited to read the description of the experiment
and answer a few questions about themselves. This
questionnaire helps us to filter subjects on driving ex-
perience, gender and age in order to ensure diversity
within our database. We also make sure no subjects
were taking any medication or drug which could pos-
sibly modify heart rate or heart rate variability.
Lastly, since the experimentation would take place
in front of a screen we also asked them about their
tendency to feel motion sickness. If selected, subjects
were then contacted to schedule an experiment time.
3.2 Participants
97 participants volunteered to participate in our study.
4 were rejected due to inclusion criteria. 33 were se-
lected from the remaining, the other were put on a
waiting list.
3.3 Simulation Platform
The experiment took place in a Cave Automatic Vir-
tual Environement (CAVE). CAVEs are augmented
reality platforms where a subject is surrounded by
glass panels (Cruz-Neira et al., 1993). The virtual en-
vironment is projected through these panels thanks to
projectors placed outside the cube. Subjects can move
freely within the cube while being surrounded by the
virtually created environment. In this specific experi-
ment, we placed a seat with a wheel and pedals, thus
reproducing the usual driving commands. The pro-
jected environment reproduced the point of view from
the driver’s seat of a car, showing the car structure,
infotainment system and the road through the wind-
screen.
3.4 Sensors
For data collection, we used sensors available on the
shelf. Three devices were selected to study their
Physiological Data Recording in VR Simulator for Sleepiness Detection During Driving
409
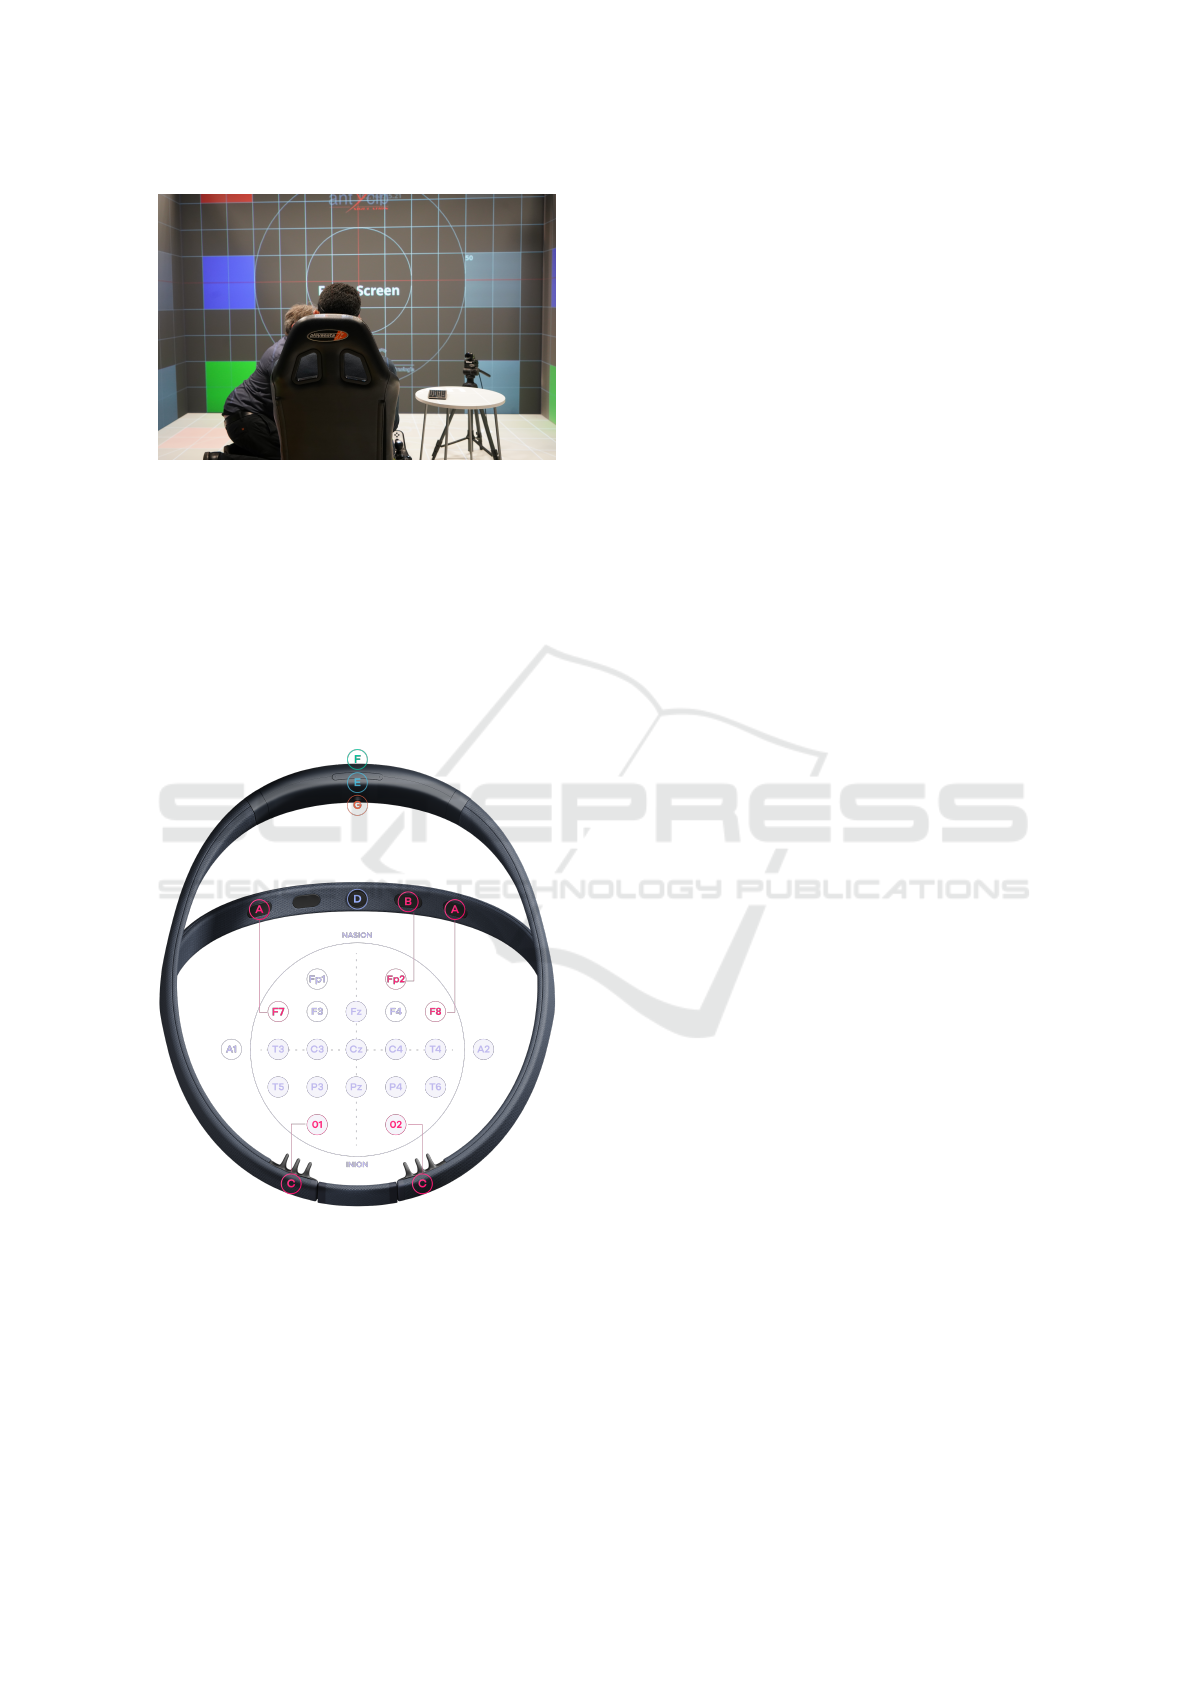
Figure 1: Subject being installed in the CAVE.
ability to provide a good signal in driving situations.
These devices measured three signals: Heart Rate
Variability (HRV) with ECG, HRV with PPG and
EEG.
EEG is recorded using Dreem headband (Arnal
et al., 2019). This headband was developed to analyse
sleep quality for daily usage. It is, therefore, a very
light and easy-to-wear sensor. It records a 6 channel
EEG at 250Hz. The device shape and electrode place-
ment are described in figure 2.
Figure 2: Electrode placement for Dreem EEG sensor.
We used two different techniques to measure
HRV. The first sensor is an elastic band with elec-
trodes attached to it with the ability to communicate
via Bluetooth. The interval identification technique
is based on ECG and consists of the identification of
the R peak in QRS complexes, to then measure the
time between two peaks. The identification is per-
formed directly on the device. We used Cardiosport
TP5 Heart Rate Monitor (Cardiosport, 2022) to per-
form that measure. This device has an integrated
Bluetooth processor that can send data in live con-
ditions. The second technique uses PPG to measure
the time between two blood waves by analysing the
opacity of the veins (Allen, 2007). We used Garmin
Venu SQ (Garmin, 2022) which is a smartwatch made
to be used all day long with light and comfortable ma-
terials. This device connects to a mobile application
to send live HRV data.
3.5 Simulation Scenario
The simulation scenario proposed to all subjects was
identical. It consists of a fifty kilometres left-hand
loop starting in an urban zone, then going through a
forest with varying tree density. Along the road, var-
ious left and right turns were created to reduce the
feeling of going in circles. Subjects were alone on
their side of the road to avoid unwanted collisions
with other cars that may force the simulation to stop
too early. On the other side of the road, groups of
cars were placed to improve the immersion and re-
duce the emptiness of the environment. Subjects were
asked to drive when possible with cruise control acti-
vated and set at 100km/h. They had a button on the
steering wheel specifically dedicated to that function.
Two events were added to the scenario to measure the
subject’s reaction in drowsy conditions. A previous
study proved this approach to be efficient to induce
and measure stress (Zontone et al., 2020). The first
event was placed after fifteen minutes of driving. We
choose this moment as we observed in precedent mea-
sures that drivers tend to have their first drowsy event
after 15 min on task. The event is composed of a set
of trucks and lights, simulating road work on the right
side, forcing the driver to change lanes to avoid the
collision. The second event is an animal crossing the
road. With no lights and no previous indications, this
object is harder to anticipate and requires much more
attention. It’s placed after 45 minutes of experience
in the middle of a straight line, which is the most an-
noying section of the circuit.
For the simulated environment, we choose to sim-
ulate clear weather at night just before dusk so that
rain doesn’t impact the experiment.
3.6 Experimental Protocol
Here is how a standard measure goes:
1. Welcome the subject on the platform.
2. Ask the subject to fill in a questionnaire on his
sleeping habits.
HEALTHINF 2023 - 16th International Conference on Health Informatics
410

3. Start and install physiological sensors on the sub-
ject.
4. Install the subject in the CAVE.
5. Start a training loop until the subject feels at ease
with the commands.
6. Last briefing on what is expected from the subject
during the experiment.
7. Auto-evaluation formation, explain what is ex-
pected from them in order to record KSS.
8. Synchronisation of all signals.
9. Driving can start.
10. After completing the two loops, the driving stops.
11. Subject is invited to leave the CAVE
12. Subject is asked to fill in the last questionnaire on
his feeling during the experiment.
13. Sensors are removed.
14. End of the measure.
A simplified and schematic version of the protocol
is represented in Figure 3.
For the synchronisation part, we asked subjects to
hold their hand in front of the camera, blocking the
view, while turning the steering wheel on the right.
Meanwhile, the operator was on the computer doing
a countdown from 3 to 0. At 0, the subject releases
the steering wheel and unblocks the camera view,
and the operator presses the starting key at the same
time. Software developed for the experiment record
the timestamp of the key press.
In order to ensure synchronisation between sys-
tems that could have a small variation in clock we
used UNIX timestamps from a remote server on ev-
ery device.
As a result, we have a hand movement on the cam-
era, a common timestamp between the computer and
smartphone combined with a peak in simulator signal
due to steering at the same time. This is our synchro-
nisation point.
3.7 Personal Context
During the inclusion process and before the experi-
ment, subjects were asked to answer a few questions
about themselves. There were two main subjects cov-
ered by these questions, the first one being drivings
habits and the second one being sleep health.
We selected only people that obtained their driv-
ing license at least one year ago and who are driv-
ing frequently since. We asked subjects more precise
questions about their driving habits regarding long
and night trips when drowsiness is more likely to ap-
pear. Regarding the sleep health topic, we asked sub-
jects to describe their sleep quality, and how many
hours of sleep they had the days before.
These data will help to detect trends amongst the
measured population. The first analysis shows that
experienced drivers, which often drive for a long time
are less affected by the simulation. It’s also really use-
ful to analyse the correlation between the sleepiness
of a subject and the length of his previous nights.
3.8 Physiological Data
Physiological sensor record two different types of in-
formation. Firstly we have EEG signals measured on
eight channels with a sample rate of 250Hz. EEG is
the gold standard signal in sleep scoring. This signal
will be used for data annotation and analysis.
Secondly, we have two sensors gathering heart-
related data. More specifically, these sensors measure
beat-to-beat intervals.
The frequency of these data is variable as both
these sensors send new data every time they detect
a new beat. This data will later be used to develop a
classification model.
3.9 Driving Behaviour
The simulation software is able to record many sig-
nals while the simulation progresses. We choose to
filter signals that were relevant to our simulation sce-
nario, as well as signals that proved their importance
in the literature.
The set of signals is composed of:
• Position of the Centre Of Gravity (COG) of the
vehicle on the map.
• Speed of the COG of the vehicle.
• Acceleration of the COG of the vehicle.
• Wheel angle and rotation speed.
• Pressure on the brake and acceleration pedals.
• Activation state of cruise control.
• Distance between COG centre of the nearest lane.
These signals were recorded with a sampling fre-
quency of 100 Hz.
3.10 Auto-Evaluation
Fatigue is a continuous state which isn’t perceived the
same by everyone. It is a physiological reality but
also a personal feeling. Depending on whether we
feel physical fatigue or psychological fatigue, our per-
ception of our fatigue level is quite different and can
Physiological Data Recording in VR Simulator for Sleepiness Detection During Driving
411

Figure 3: Schematic experimental protocol.
greatly vary. To normalise the definition of drowsi-
ness levels, a scale going from 1 (Very Alert) to 9
(Very sleepy) has been determined and is used in a
vast majority of studies (Kaida et al., 2006) and is also
the reference scale for European Union (EU).
Therefore we implemented the assessment of this
scale in the experiment. As for the technical solutions
we chose to ask the participants to press a numeri-
cal key on a Numpad every five minutes. This gap
was selected according to EU technical requirements
on Karolinska Sleepiness Scale (KSS) rating protocol
(EuropeanCommission, 2021).
However, note that measuring drowsiness with
this scale has many flaws. First of all, it requires the
subject to make a cognitive effort in order to answer
the question. While the scale is not overly complex it
still requires some time to adapt and understand how
to correctly rate ourselves. That is why a great part of
the briefing is focused on explaining KSS. Secondly,
this auto-evaluation is, in essence, subjective. People
tend to over and/or under-estimate their drowsiness
level all the time. Therefore auto-evaluation has a bad
impact on the experiment and we have to take the re-
sult with care, taking into account potential bias.
3.11 Labelling Data
Labelling our dataset is a key part of our study since
we aim to use it for supervised machine-learning ap-
plications. The objective is to develop a system which
is able to detect drowsiness states in opposition to
awake states. It is a binary classification problem.
We can use three different pieces of information
to label data:
1. EEG:
EEG is a gold standard signal used, in combina-
tion with EOG and ECG, for sleep scoring method
by sleep specialists. This method consists on the
analysis of 30 seconds segments of signal and the
association of a tag : sleep or no-sleep. This
tagging method requires a qualified set of profes-
sional reviewers.
While being the most precise on sleep detec-
tion, this method isn’t as efficient to detect
rapid drowsy event. That is a major issue, be-
cause while driving subject won’t fall completely
asleep. Their drowsy events will more likely
be short moments of absence which aren’t easily
recognisable on polysomnographic records.
2. KSS:
KSS gives a subjective assessment of a fatigue
level. While this scale has 9 levels we can divide
them in two categories: 1 to 7 for awake and 7
to 9 for drowsy. However using this information
directly as a training target can have many flaws.
As it is a subjective information we can’t be sure
if the level associated with the situation really cor-
responds to the true definition of the level. Also,
we can’t normalise levels among participants as
an eight for someone can mean a six for another.
3. Video:
Lastly, we can use the video of the face and the
point of view of the driver to identify drowsy be-
haviour and driving mistakes caused by drowsi-
ness. The method first consists of the definition
and the selection of a list of observable events
that may be interesting to annotate. The list has
been defined by studying literature and observing
subjects in driving simulators. The result is a list
of seven events which are: Yawning, Change of
position, Long blink, Face/Neck scratch, Loss of
Control, Accident and Sleep. The next step is re-
viewing conjointly both of the videos and select-
ing tags as they occur during the measure.
The reviewing process is done by two different
people. Then a third one validates every event.
This process ensures no events can be missed and
no event can be falsely tagged.
3.12 Dataset
The final dataset content is summarised in table 1. It is
composed of three synchronised physiological signals
as well as nineteen behaviour-related signals, an auto-
assessment drowsy scale based on KSS, a video feed
HEALTHINF 2023 - 16th International Conference on Health Informatics
412
of the face of the driver and a video feed of the point
of view of the driver, lastly it is composed of personal
and driving habits data on the subject.
Each signal can be used for direct interpretation,
annotation or classification purposes. Some examples
are presented in this table but the possible applications
are not limited to this.
4 PRELIMINARY ANALYSIS
In this section, we will perform a preliminary analysis
of our data. As our objective was to record drowsi-
ness we should ensure that we have sufficient drowsy
drivers and drowsy events. Since we determined dif-
ferent methods of annotation the proportion of drowsy
drivers may slightly vary from one to another. The
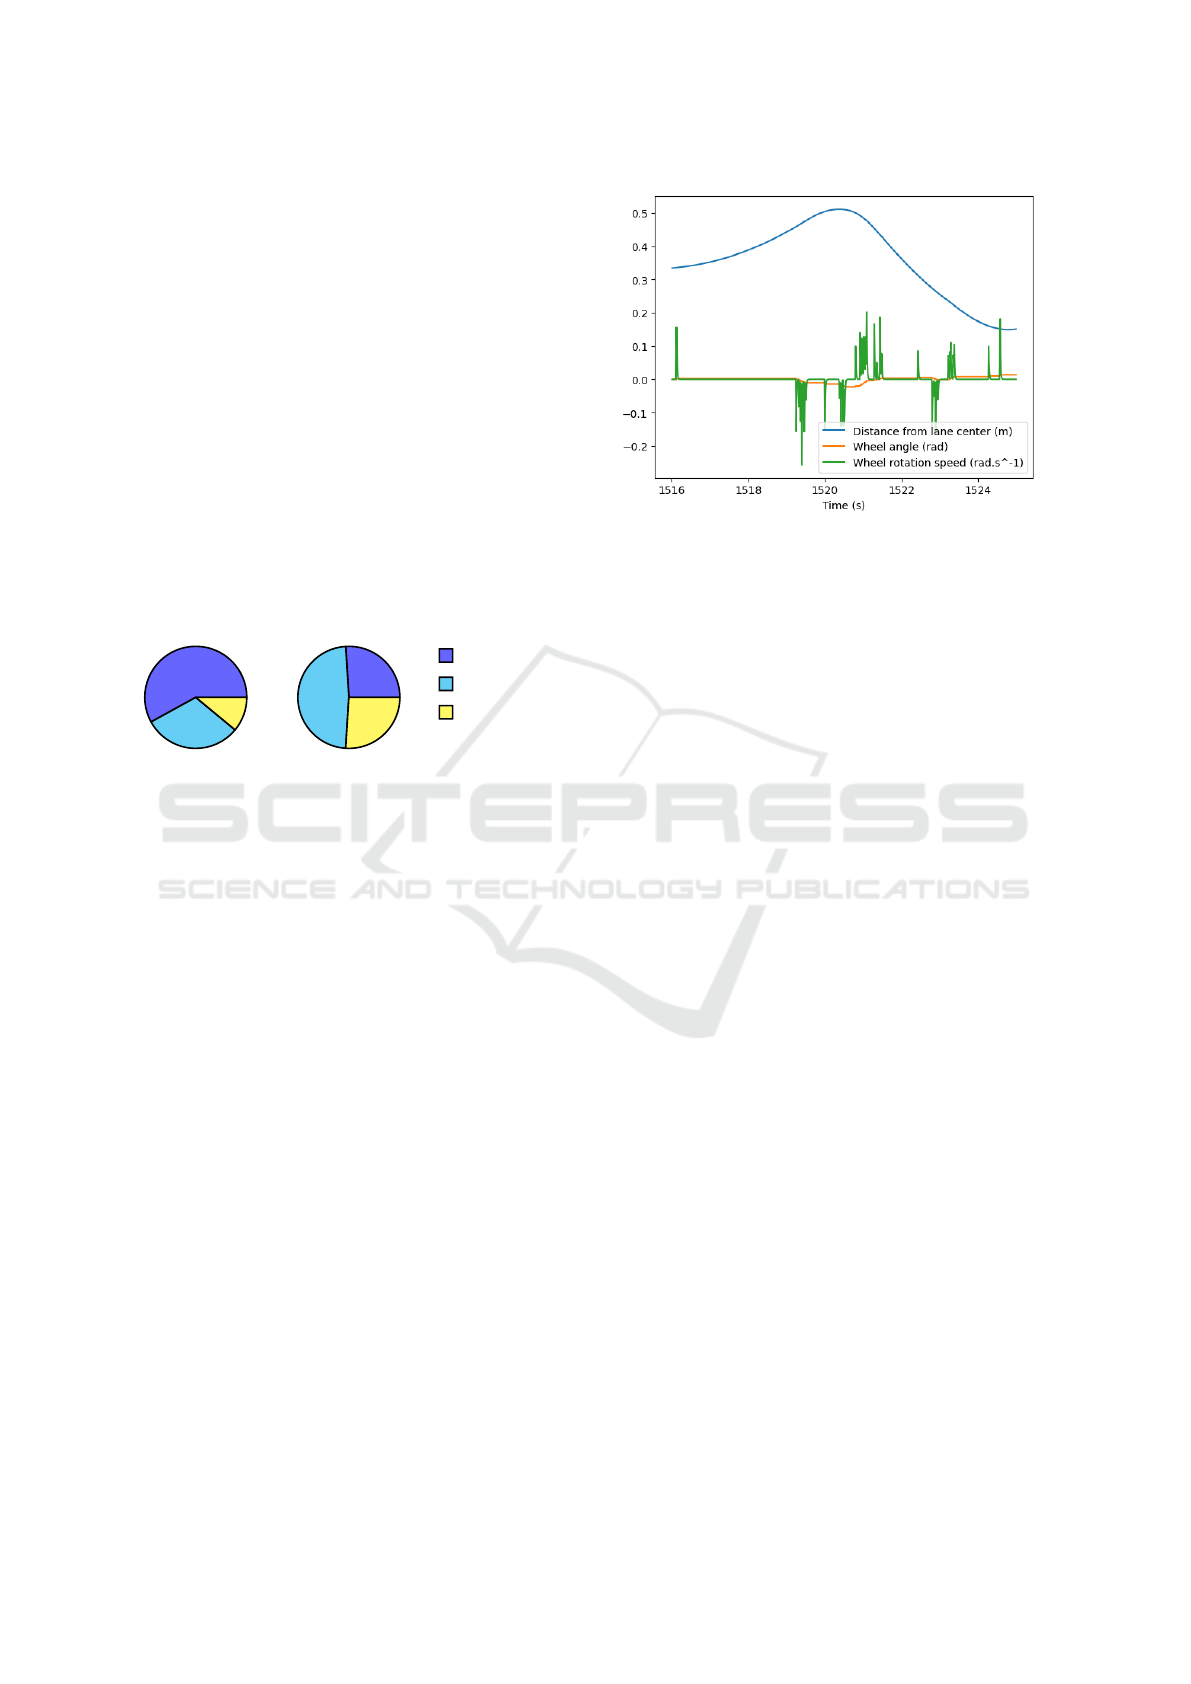
proportions are pictured in figure 4.
58%
31%
11%
26%
48%
26%
Heavy fatigue
Light fatigue
No fatigue
Figure 4: Proportion of trips with drowsy drivers according
to KSS (left) and video (right).
In these graphics, Heavy fatigue corresponds to ei-
ther KSS > 6 or a video tag of clear loss of control.
Light fatigue is for 7 > KSS > 4 or a video tag of
early external signs of fatigue. No fatigue is for 5 >
KSS and no video tags. From this figure, we can con-
clude that these methods give significantly different
results. Subjects tended to overestimate their fatigue
level and were globally able to drive even though
they graded their drowsy state as > 6. We can also
conclude we have been able to record a significant
amount of fatigue events considering subjects were
not sleep deprived.
4.1 Driving behaviour
Early analysis of behaviour signals extracted from the
simulator show which one will be the most important.
We observed three principal features that were par-
ticularly affected during drowsy events, namely: Dis-
tance to the middle of the road, angle of the wheel,
and rotation speed of the wheel. Figure 5 shows an
example of these signals.
In this graphic, we can see three seconds where
there was no wheel activity while the car was going
away from the centre of the lane. Then the driver
starts a trajectory correction to replace the vehicle
closer to the centre.
Figure 5: Behaviour signals during drowsy events.
If we look at the maximum values reached during
drowsy and standard measures, we can see a drowsy
driver going far away from the centre line and having
spike activation of the wheel more critical than the
average driver (Table 2).
With these features from behavioural signals, we
can characterise the difference in behaviour between
two populations. The subsequent development would
improve these parameters and test their relevance in a
machine-learning model.
4.2 Physiological Signal Processing
The first physiological data processing shows a great
quality difference between our sensors. For example,
with the PPG watch, we have an average recording
time of 3646 seconds (standard deviation of 100 s),
while the ECG belt has 2927 seconds average with a
standard deviation of 1396 s.
We discovered the Bluetooth connection between
the belt and the computer failed many times, thus cre-
ating very short records for some subjects. Thankfully
this behaviour only impacted six people.
5 POTENTIAL LIMITATIONS
During this experiment and while we performed our
first analysis, we noted some limitations of our work
that should be disclaimed. However, the limitations
aren’t limited to the ones listed after that.
Even if finding differentiating characteristics to
identify events is essential for the analysis, we can’t
be sure these characteristics can be generalised. Our
model should apply to many people and shouldn’t be
helpful only for one type of driver.
Also, it is difficult to evaluate how different the
subject’s physiological state would be in actual driv-
Physiological Data Recording in VR Simulator for Sleepiness Detection During Driving
413
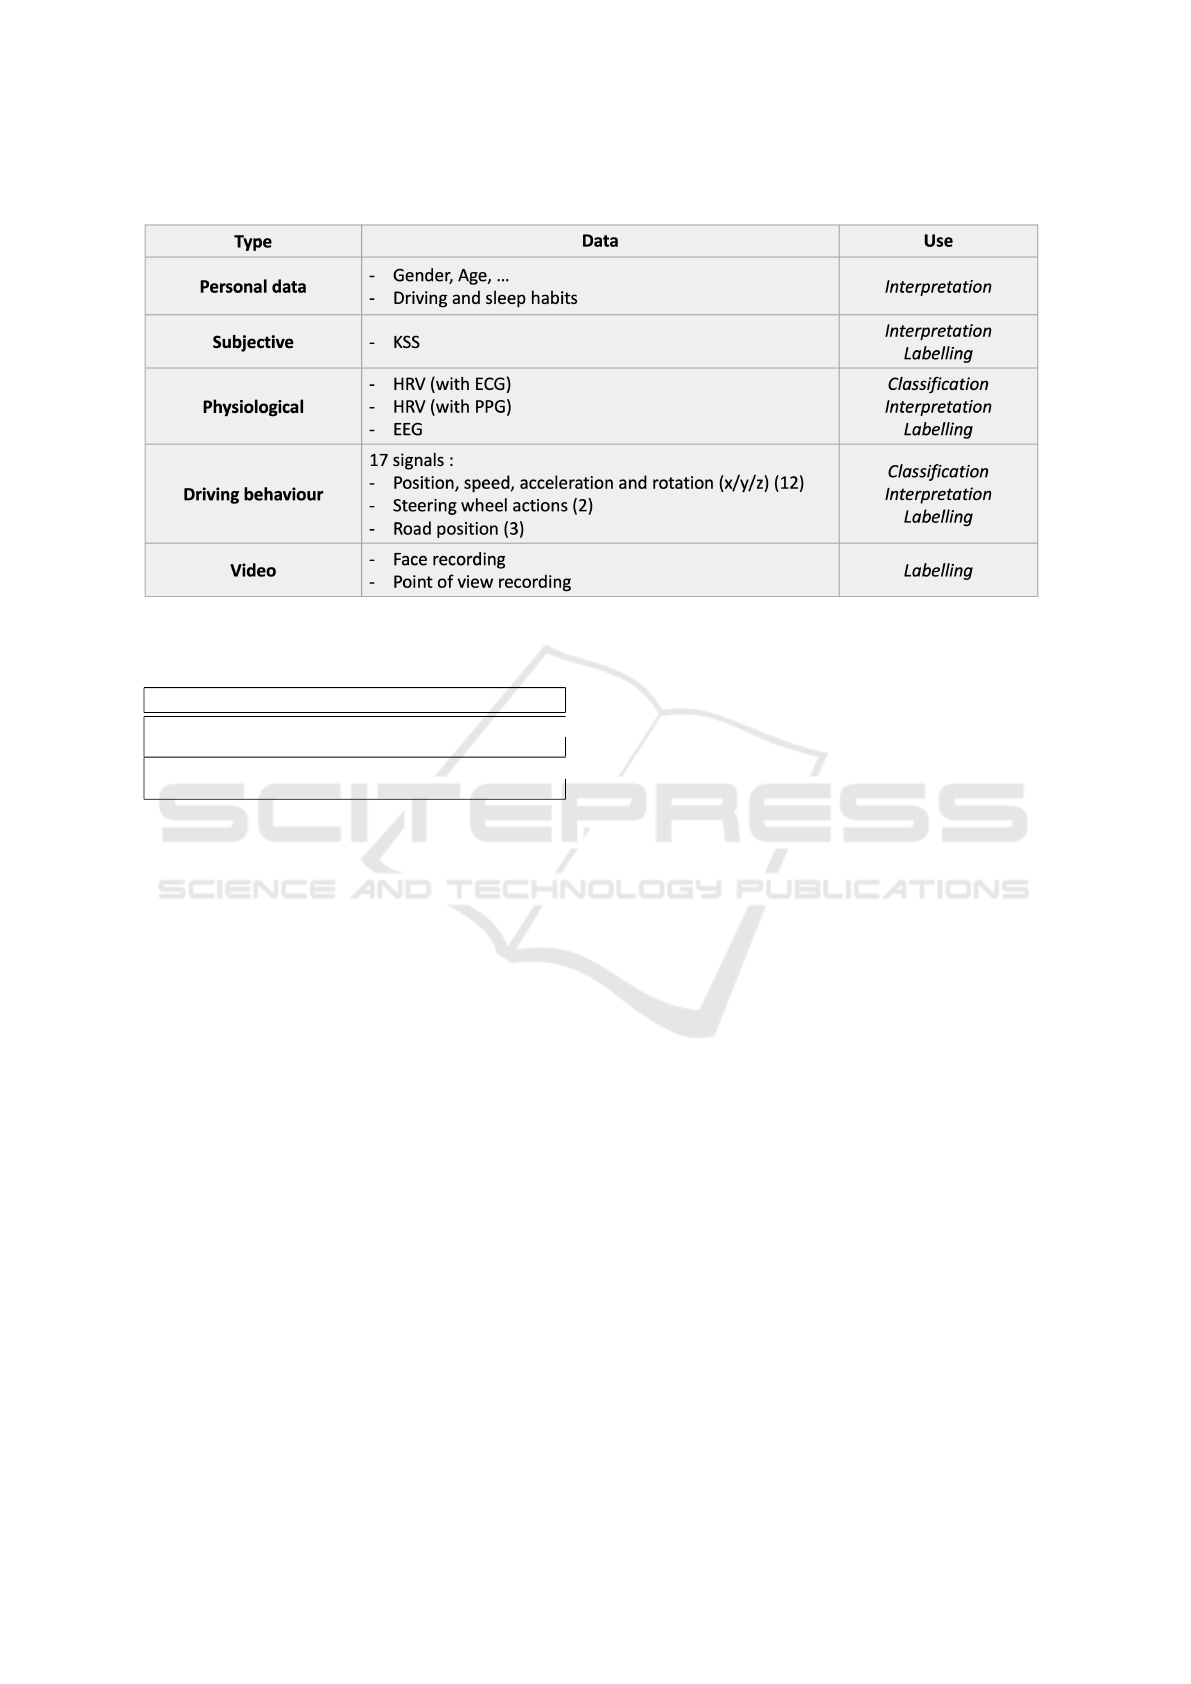
Table 1: Dataset content summary.
Table 2: Difference between a drowsy and awake driver on
some signals.
Signal Drowsy Awake
Distance from lane centre (m)
(MAX then AVG on population) 6.2 2.5
Wheel rotation speed (rad.s
−1
)
(MAX then AVG on population) 8.8 6.7
ing conditions. Therefore, the principal solution
would be to record even more subjects to get the
most heterogeneous data set possible, thus covering
the most physiological responses imaginable.
Finally, the quantity of data is critical when devel-
oping a machine-learning algorithm. While having a
lot of drowsy events, this data set remains quite un-
balanced between awake and fatigued states. Differ-
ent techniques can be used to answer that issue, like
data augmentation.
6 CONCLUSIONS
In this research, we developed an experimental proto-
col to record the data from subjects in simulated driv-
ing conditions. Considering many previous studies,
we added a large variety of sources. The objective
was to induce fatigue by gathering the subject’s states
when they were about to fall asleep.
The experimental protocol has been validated with
self-assessment and video annotation, which makes
it reliable for machine learning developments. With
one-third of people having at least one tired event dur-
ing their measure, this data set presents enough pos-
itive events to be detected. In addition, the popula-
tion measured is quite diverse in terms of age, gender,
driving and sleep habits, making our data set a pow-
erful resource for developing a model.
The data set could be used differently to study the
correlation between physiological signals and drowsi-
ness in a mono-modal or multi-modal approach. It
could also be used to compare data sources between
them, for example, comparing the signal from ECG
band and Garmin smartwatch.
From the early analysis, we can find differentiat-
ing characteristics for some drowsy events. The fol-
lowing work will determine if a predictive drowsiness
model can be developed on this database. This will be
possible by finding ways to generalise the character-
istics of our population. Developing features and im-
plementing some based on the literature is also an ex-
tensively considered approach. Another perspective
would be to use this protocol, which has proven to be
efficient, on longer measures to gather more drowsy
events.
ACKNOWLEDGEMENTS
The authors would like to thank all the subjects for
their patience and time. Also, thanks to Heudyasic
laboratory, which gave us the opportunity to use their
platform and to develop the scenario as we wanted.
More specifically authors would like to personally
thank Mr Bouvet Yohan for his crucial help and com-
mitment to the realisation of the study.
HEALTHINF 2023 - 16th International Conference on Health Informatics
414

ETHICS DECLARATIONS
All volunteers gave their informed written consent
following approval and in accordance with the CER-
SU Review Board.
REFERENCES
Abe, T., Nonomura, T., Komada, Y., Asaoka, S., Sasai, T.,
Ueno, A., and Inoue, Y. (2011). Detecting deteriorated
vigilance using percentage of eyelid closure time dur-
ing behavioral maintenance of wakefulness tests. In-
ternational Journal of Psychophysiology, 82(3):269–
274.
Allen, J. (2007). Photoplethysmography and its application
in clinical physiological measurement. Physiological
measurement, 28(3):R1.
Arnal, P. J., Thorey, V., Ballard, M. E., Hernandez, A. B.,
Guillot, A., Jourde, H., Harris, M., Guillard, M.,
Van Beers, P., Chennaoui, M., et al. (2019). The
dreem headband as an alternative to polysomnography
for eeg signal acquisition and sleep staging. BioRxiv,
page 662734.
Board, S. (1999). Evaluation of us department of transporta-
tion efforts in the 1990s to address operator fatigue.
Safety Report NTSB/SR-99/01, Washington, DC.
Cardiosport (2022). Cardiosport TP5 device descrip-
tion. https://www.cardiosport.com/cardiosport-heart-
rate-monitors. Accessed: 2022-09-23.
Chai, M. et al. (2019). Drowsiness monitoring based on
steering wheel status. Transportation research part
D: transport and environment, 66:95–103.
Cruz-Neira, C., Sandin, D. J., and DeFanti, T. A. (1993).
Surround-screen projection-based virtual reality: the
design and implementation of the cave. In Pro-
ceedings of the 20th annual conference on Computer
graphics and interactive techniques, pages 135–142.
de Naurois, C. J., Bourdin, C., Stratulat, A., Diaz, E., and
Vercher, J.-L. (2019). Detection and prediction of
driver drowsiness using artificial neural network mod-
els. Accident Analysis & Prevention, 126:95–104.
EuropeanCommission (2021). European Com-
mission driver drowsiness and attention
warning. https://eur-lex.europa.eu/legal-
content/EN/ALL/?uri=CELEX:32021R1341. Ac-
cessed: 2022-09-23.
Friedrichs, F. and Yang, B. (2010). Drowsiness monitor-
ing by steering and lane data based features under
real driving conditions. In 2010 18th European Sig-
nal Processing Conference, pages 209–213. IEEE.
Garmin (2022). Garmin Venu SQ device description.
https://www.garmin.com/en-US/p/707174. Accessed:
2022-09-23.
Hori, C., Watanabe, S., Hori, T., Harsham, B. A., Hershey,
J., Koji, Y., Fujii, Y., and Furumoto, Y. (2016). Driver
confusion status detection using recurrent neural net-
works. In 2016 IEEE International Conference on
Multimedia and Expo (ICME), pages 1–6. IEEE.
Kaida, K., Takahashi, M.,
˚
Akerstedt, T., Nakata, A., Otsuka,
Y., Haratani, T., and Fukasawa, K. (2006). Valida-
tion of the karolinska sleepiness scale against perfor-
mance and eeg variables. Clinical neurophysiology,
117(7):1574–1581.
Kim, I.-H., Bong, J.-H., Park, J., and Park, S. (2017). Pre-
diction of driver’s intention of lane change by aug-
menting sensor information using machine learning
techniques. Sensors, 17(6):1350.
McKinley, R. A., McIntire, L. K., Schmidt, R., Repperger,
D. W., and Caldwell, J. A. (2011). Evaluation of
eye metrics as a detector of fatigue. Human factors,
53(4):403–414.
Sahayadhas, A., Sundaraj, K., and Murugappan, M. (2012).
Detecting driver drowsiness based on sensors: a re-
view. Sensors, 12(12):16937–16953.
Zontone, P., Antonio, A., Bernardini, R., Linz, L. D., Pi-
ras, A., and Rinaldo, R. (2020). Supervised Learning
Techniques for Stress Detection in Car Drivers. Ad-
vances in Science, Technology and Engineering Sys-
tems Journal, 5(6):22–29.
Physiological Data Recording in VR Simulator for Sleepiness Detection During Driving
415
