
PUMP: An Underspecification Analysis Tool
Jonathan Tang
1 a
, McClain Kressman
2 b
, Harsha Lakshmankumar
2 c
, Belle Aduaka
2 d
,
Ava Jakusovszky
1 e
, Paul Anderson
1 f
and Jean Davidson
2 g
1
Department of Computer Science, California Polytechnic University, San Luis Obispo, California, U.S.A.
2
Department of Biological Sciences, California Polytechnic University, San Luis Obispo, California, U.S.A.
Keywords:
Underspecification, Deep Learning, Neural Network, Breast Cancer, Subtype Classification.
Abstract:
In fields such as biomedicine, neural networks may encounter a problem known as underspecification, in which
models learn a solution that performs poorly and inconsistently when deployed in more generalized real-world
scenarios. A current barrier to studying this problem in biomedical research is a lack of tools engineered to
uncover and measure the degree of underspecification. For this reason, we have developed Predicting Under-
specification Monitoring Pipeline or PUMP. We demonstrate the utility of PUMP in predictive modeling of
breast cancer subtypes. In addition to providing methods to measure, monitor, and predict underspecification,
we explore methods to minimize the production of underspecified models by incorporating biological insight
that aims to rank potential models.
1 INTRODUCTION
Computational power coupled with biomedical in-
sight has resulted in a dynamic and robust new ap-
proach to the medical field. Deep learning networks
in particular have bolstered various fields, includ-
ing cancer subtype classification (Cascianelli et al.,
2020), drug effects on biological pathways (Gupta
et al., 2021), and protein analysis (Shi et al., 2019).
Though the implementation of such networks have
been successful, they are still liable to an issue known
as underspecification, where a trained model fails to
maintain expected accuracy on new datasets. This is
especially a problem in biomedicine, where datasets
frequently have more input features than data sam-
ples.
In the context of our work, we developed a tool
named PUMP (Predicting Underspecification Moni-
toring Pipeline), an open-source Python package that
aims to measure, monitor, predict, and visualize un-
derspecification. Specifically for the use-case spec-
a
https://orcid.org/0000-0002-2459-7281
b
https://orcid.org/0000-0002-1679-8606
c
https://orcid.org/0000-0002-2479-2546
d
https://orcid.org/0000-0003-1574-1648
e
https://orcid.org/0000-0001-8888-7504
f
https://orcid.org/0000-0002-8408-3944
g
https://orcid.org/0000-0001-5951-5955
ified in this paper, PUMP will analyze the relation-
ship between breast cancer subtyping and underspec-
ification. To perform this task, we utilize a transcrip-
tomic METABRIC dataset with 19,084 gene expres-
sions and 2,133 patient samples, which is a perfect
embodiment of the type of dataset that is prone to un-
derspecification: having far more features than sam-
ples.
2 BACKGROUND
Underspecification is well-documented in the ma-
chine learning literature. However, the difference be-
tween predictors optimized for independent and iden-
tically distributed data (iid) and application-specific
generalization is neglected (D’Amour et al., 2020).
As a result, reducing the number of possible predic-
tors and ensuring that these predictors can generalize
due to data-set shifts is critical. Due to the high-stakes
predictions involved in biomedical applications, it is
important that algorithms and models produce consis-
tent interpretations and behave in the “real world” as
they do on test sets during development.
Underspecification is problematic with regard to
machine learning models due to the complex nature of
identifying when it is occurring. A model can be un-
derspecified, yet still appear to be well-trained, result-
ing in the inability to transfer its knowledge to differ-
Tang, J., Kressman, M., Lakshmankumar, H., Aduaka, B., Jakusovszky, A., Anderson, P. and Davidson, J.
PUMP: An Underspecification Analysis Tool.
DOI: 10.5220/0011697600003414
In Proceedings of the 16th International Joint Conference on Biomedical Engineering Systems and Technologies (BIOSTEC 2023) - Volume 3: BIOINFORMATICS, pages 101-108
ISBN: 978-989-758-631-6; ISSN: 2184-4305
Copyright
c
2023 by SCITEPRESS – Science and Technology Publications, Lda. Under CC license (CC BY-NC-ND 4.0)
101
ent datasets. As such, identifying underspecification
early in development can help researchers diagnose
issues with their machine learning model and avoid
making any false conclusions in a medical setting.
Machine learning classifiers have become increas-
ingly more involved in the medical diagnostic pro-
cess. However, the issue of underspecification has
been an ongoing struggle for bioinformaticians. In
2013, Fakoor et al. wrote about classifiers that could
not be applied to new datasets because of performance
concerns which limits these tools’ utility (Fakoor
et al., 2013). Producing inconsistent results from
dataset to dataset is not practical for real-world use
in settings like hospitals. In this paper, we will give a
system overview, offer data analysis and discuss fur-
ther how we minimize the issue of underspecification
using our tool.
In our previous work, in which the three-gene
model for breast cancer (Haibe-Kains et al., 2012)
was incorporated into our models, we procured results
with reduced underspecification (Anderson et al.,
2021). The experiments conducted suggest that inte-
grating biological knowledge can result in better spec-
ified models. As such, we hope to further reduce un-
derspecification by exploring additional biological in-
sights that can be used to train the models. It quickly
became apparent that our ability to do so was being
limited by a lack of easy to use tools.
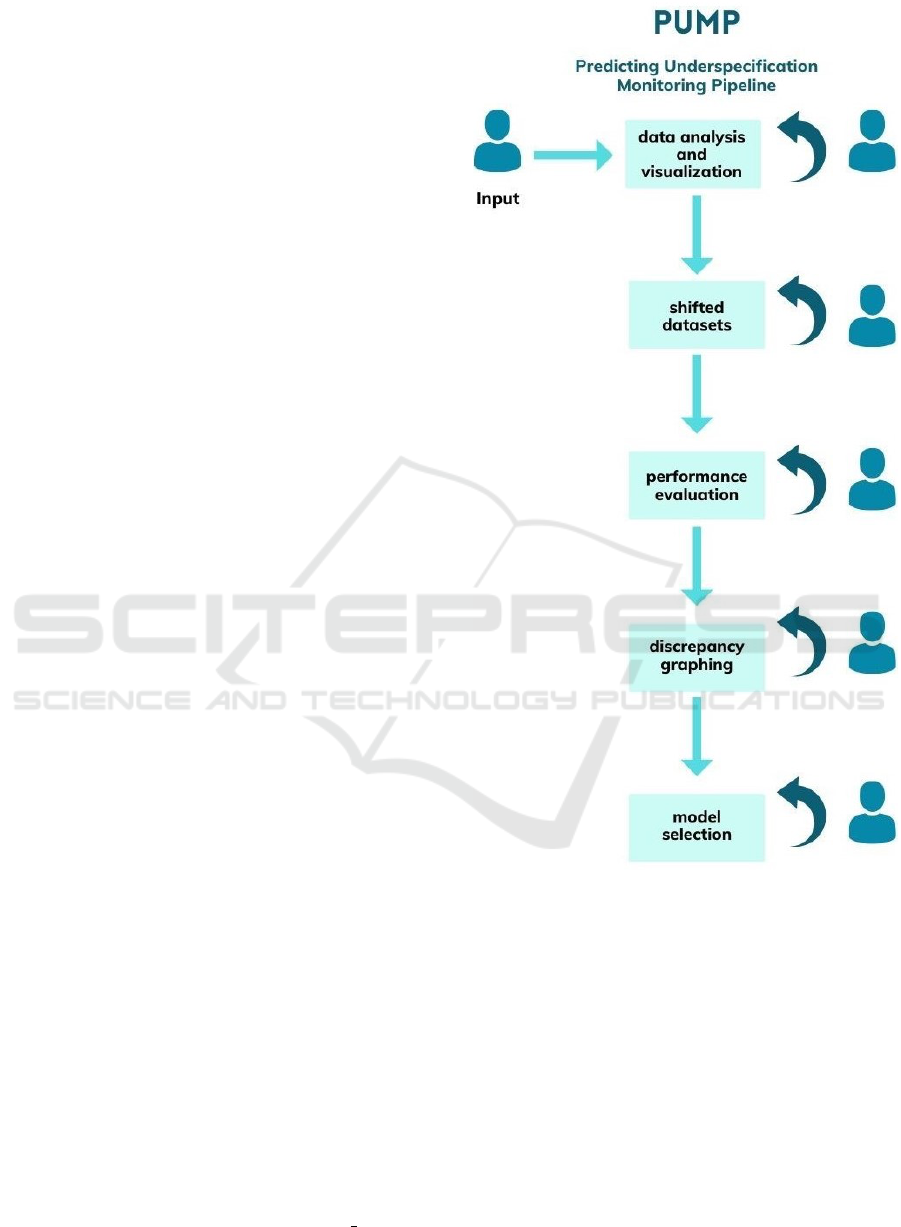
3 SYSTEM OVERVIEW
Since underspecification is not as well-known and
well-defined as other common machine learning con-
cepts, especially in biomedicine, our work aims to
provide an easy way to analyze datasets for under-
specification. To achieve this, we created PUMP
(Predicting Underspecification Monitoring Pipeline)
which functions as a generalized, reproducible, and
user-friendly package for identifying underspecifica-
tion. The structure of the package can be divided into
five sections: data analysis, shifting datasets, evalu-
ating model performances, viewing performance dis-
crepancies, and generalized model selection (as seen
in Figure 1). The tool is built iteratively with user
interaction in mind, so a user is able to interact with
results at each step and edit inputs to meet individual
needs.
3.1 Data Analysis
To highlight significant features and significant data
clusters, PUMP provides a method analyze dataset()
to visualize the data with PCA and clustering (e.g.,
Figure 1: PUMP High-Level Design.
k-means). Because PUMP divides the samples into
clusters to focus in on areas most affected by under-
specification, having a method to easily get feedback
regarding features and potential clusters can lead to
more valuable performance analysis later on.
Since this method is meant to be exploratory, the
user is allowed to modify number of clusters and per-
form cluster analysis on a filtered outcome class. Af-
ter the method’s execution, the user can evaluate the
data through a PCA variance plot, a PCA scatter plot,
a k-means inertia plot, a k-means cluster histogram,
and a color-coded cluster scatter plot. These visuals
can be found as PNGs and HTMLs in a user-specified
directory.
BIOINFORMATICS 2023 - 14th International Conference on Bioinformatics Models, Methods and Algorithms
102

3.2 Shifted Stress Testing
Similar to the methodology described by (D’Amour
et al., 2020), PUMP aims to address underspecifica-
tion by using shifted datasets as a stress test. To per-
form this stress test, the original dataset is repeatedly
divided into three sets: training, unshifted test, and
shifted test.
To perform the described dataset shift based
on data clusters, PUMP offers a method cre-
ated clustering shifted datasets() that creates those
datasets with clustering as an optional method.
Since the current functionality of the data analy-
sis is built on data clustering, clustering is also
reflected in the shifted dataset generation (cluster-
ing is not the only avenue for creating shifted
datasets). Due to the nature of the method, cre-
ated clustering shifted datasets() offers the user a va-
riety of parameters to tune: number of clusters, train-
validation-test ratio, outcome class filter, and number
of shifted datasets.
In practice, shifted datasets are not known prior to
analysis; therefore, when selecting a machine learn-
ing model to utilize, the model that is best perform-
ing across multiple runs and with multiple seeds is
often preferred and selected. The shifted datasets uti-
lized for this analysis were created systematically to
aid comparative analysis. This dataset creation sys-
tem permitted us to rank the models based on the per-
formance of unshifted and the shifted test sets.
Preliminary repetition model performance on un-
shifted datasets shows many repetition instances per-
forming at an equal level, if not better, than top ranked
models. This attests that test-set performance alone
is not sufficient to determine the best model if un-
derspecification is suspected. These datasets can be
found separated by clusters in a user-specified direc-
tory.
3.3 Performance Evaluation
Following the creation of shifted datasets, PUMP
allows for performance evaluation on said shifted
datasets. The method evaluate shifted sets() trains
three types of models for performance evaluation:
Support Vector Machines (SVMs), Random Forest
Classifiers, and Neural Networks (standard Multi-
Layer Perceptron). Each model is trained on every
configuration of the shifted dataset and its F1-score,
recall, and precision are noted for each evaluation.
Due to the nature of the models, the Random
Forest Classifiers and Neural Networks have a user-
defined number of different trials on all of the shifted
sets because randomness can be induced and con-
trolled through a random seed. On the other hand,
SVMs do not include the functionality nor the need
for a random seed, so SVMs only have one trial for
the entire shifted set.
Typically, deep learning networks are applied in
the biomedical setting, but since they also tend to
take the longest to train, training a significantly large
of networks through PUMP would be both inefficient
and time-consuming. With the addition of SVMs and
Random Forests as possible models to train, under-
specification can be analyzed in faster models before
trying out controlled random seeds on deep learning
networks. These results can be found as CSVs in a
user-specified directory.
3.4 Discrepancy Graphing
Using the metrics obtained from the model per-
formance evaluation, F1-score results are graphed
based on shifted results vs unshifted results with
plot shifted results(). By doing so, underspecification
can be identified based on significant performance
discrepancies between shifted and unshifted perfor-
mance results.
Each seed (shifted set) is plotted on the same
graph with performances from the same cluster and
repetition (model random state). From there, a partic-
ular model’s performances can be visually evaluated
across all shifted datasets, displaying which shifted
stress tests may potential induce underspecification.
Moreover, in each graph the top n models (according
to PUMP) are provided such that users can identify
particular data and model configurations that are less
likely to cause underspecification. These visuals can
be found as HTMLs in a user-specified directory.
3.5 Generalized Model Selection
Though the analysis and diagrams thus far help
the user in understanding underspecification in their
dataset, it would benefit them more to be able to
know which data configurations produced the most
generalized models. To address this, the method se-
lect
top models() allows the user to determine the top
n models in their data configurations.
S
knowledge
= F
1,unshi f ted
−
F
1,unshi f ted
+ F
1,shi f ted
2
(1)
To select the top n models, PUMP calculates
model rankings with Equation 1, where model rank
is based on the difference between the unshifted F1-
score and the average score between shifted and un-
shifted F1-scores. Finally, PUMP returns the data file
PUMP: An Underspecification Analysis Tool
103
information for the top n models so the user can find
all the desired metadata with the correct keys. These
models will be returned directly to the user as a data
frame containing necessary data configuration infor-
mation and scores.
4 SYSTEM APPLICATION
For the findings presented in this paper, our works
contain studies on a dataset from METABRIC. This
dataset consists of 19,084 gene expression values
from a set of 2,133 participants of the METABRIC
group. Furthermore, this dataset includes additional
clinical data for each patient, which is where patients
are given subtype classifications including: basal-
like, r-enriched, luminal A, and luminal B, normal,
and claudin-low. For a more in-depth understand-
ing of our work, please visit our Github repository at
calpoly-bioinf/pump
4.1 Analyzing HER2 Patient Clusters
To begin data analysis on the breast cancer dataset,
HER2 positive patients were isolated not only for a
better understanding of underspecification, but also
the HER2-enriched subtype has the highest level
of variance present within this dataset according to
(Haibe-Kains et al., 2012). This high level of variance
has clinical significance as well, because variance in
the HER2/EGFR protein complex and variance in the
receptor for these proteins affect the efficacy of drug
treatments.
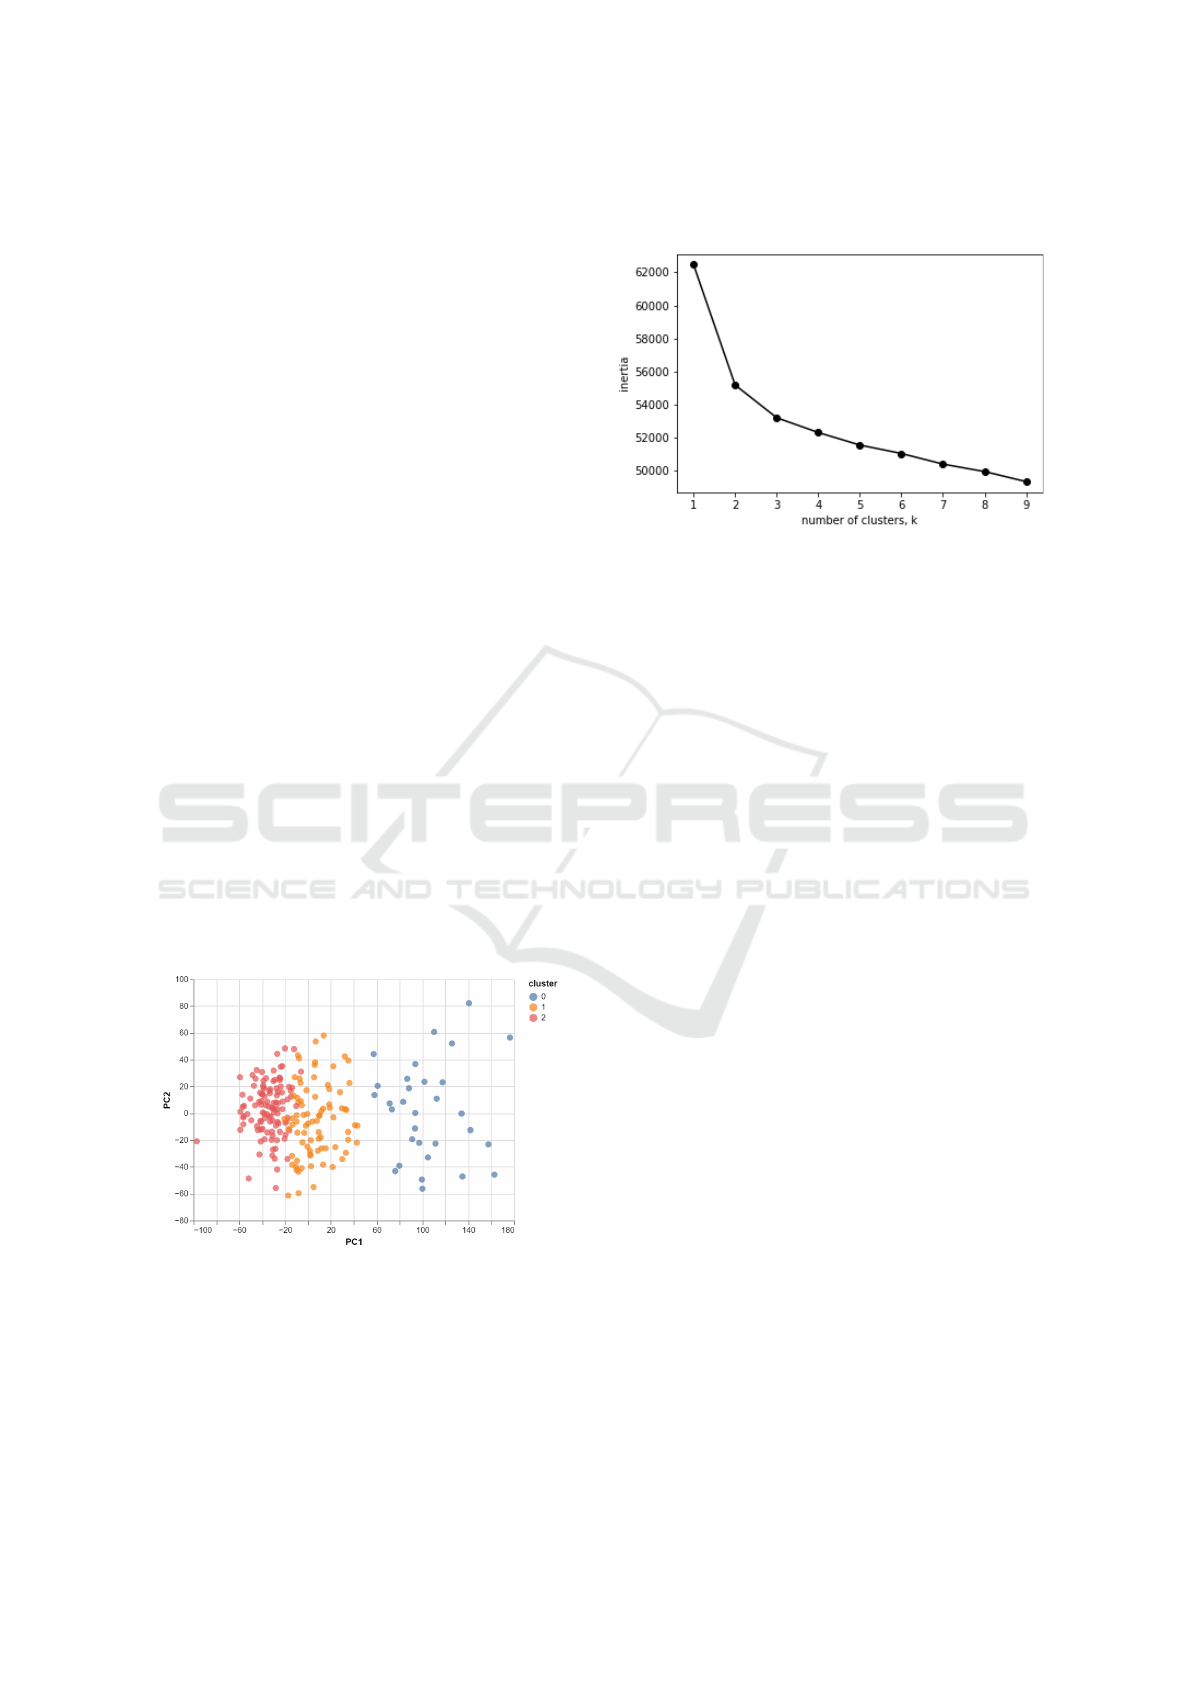
Figure 2: Three Clusters in PC1 vs PC2 Dimensions.
According to the data analysis done by PUMP,
seen in Figure 2, having three clusters in the dimen-
sions of PC1 and PC2 separated the data points quite
well.
To further support these parameters, the generated
k-means inertia graph as illustrated in Figure 3 indi-
cate that it is after three clusters that the value of iner-
tia does not have significant change.
Figure 3: Cluster Inertia Graph.
4.2 Shifting Datasets on HER2
As a result, the aforementioned parameters were spec-
ified in the creation of the shifted datasets along with
an 80-20 train-test split. Because not all models
would face underspecification, the introduction of a
degree of randomness was implemented to be able to
identify models that were underspecified. 50 varia-
tions in seeds (50 shifted datasets) were set for each
data set, to be able to compare the performance of
each seed to one another. Further randomization of
each data set was done by setting five repetitions of
model random states from which to sample.
Moreover, due to the clinical significant and high
variance of the HER2 subtype class, PUMP was given
HER2 as a parameter. By doing so, PUMP would
ensure that though random, the shifted datasets would
factor in an imbalance with HER2 positive patients.
4.3 Performance Metrics
Firstly, SVMs were run on each of the generated
shifted datasets. For these runs, SVMs were given the
following parameters: linear kernel, one-vs-one deci-
sion function, and 0.001 regularization. As seen in
Figure 5, there were interesting differences in results
between each clusters. Generally, cluster 0 was able
to produce relatively good and consistent SVM mod-
els, whereas cluster 2 had a large amount of models
have consistently bad performance. However, most
interesting is cluster 1, where there is a significantly
large amount of models having decent unshifted F1-
scores but having poor shifted F1-scores.
To get a better feel for the differences between the
random states, Random Forests were run on each of
the shifted datasets with random states from 0-5. Ad-
ditionally, the classifier was given a maximum depth
BIOINFORMATICS 2023 - 14th International Conference on Bioinformatics Models, Methods and Algorithms
104
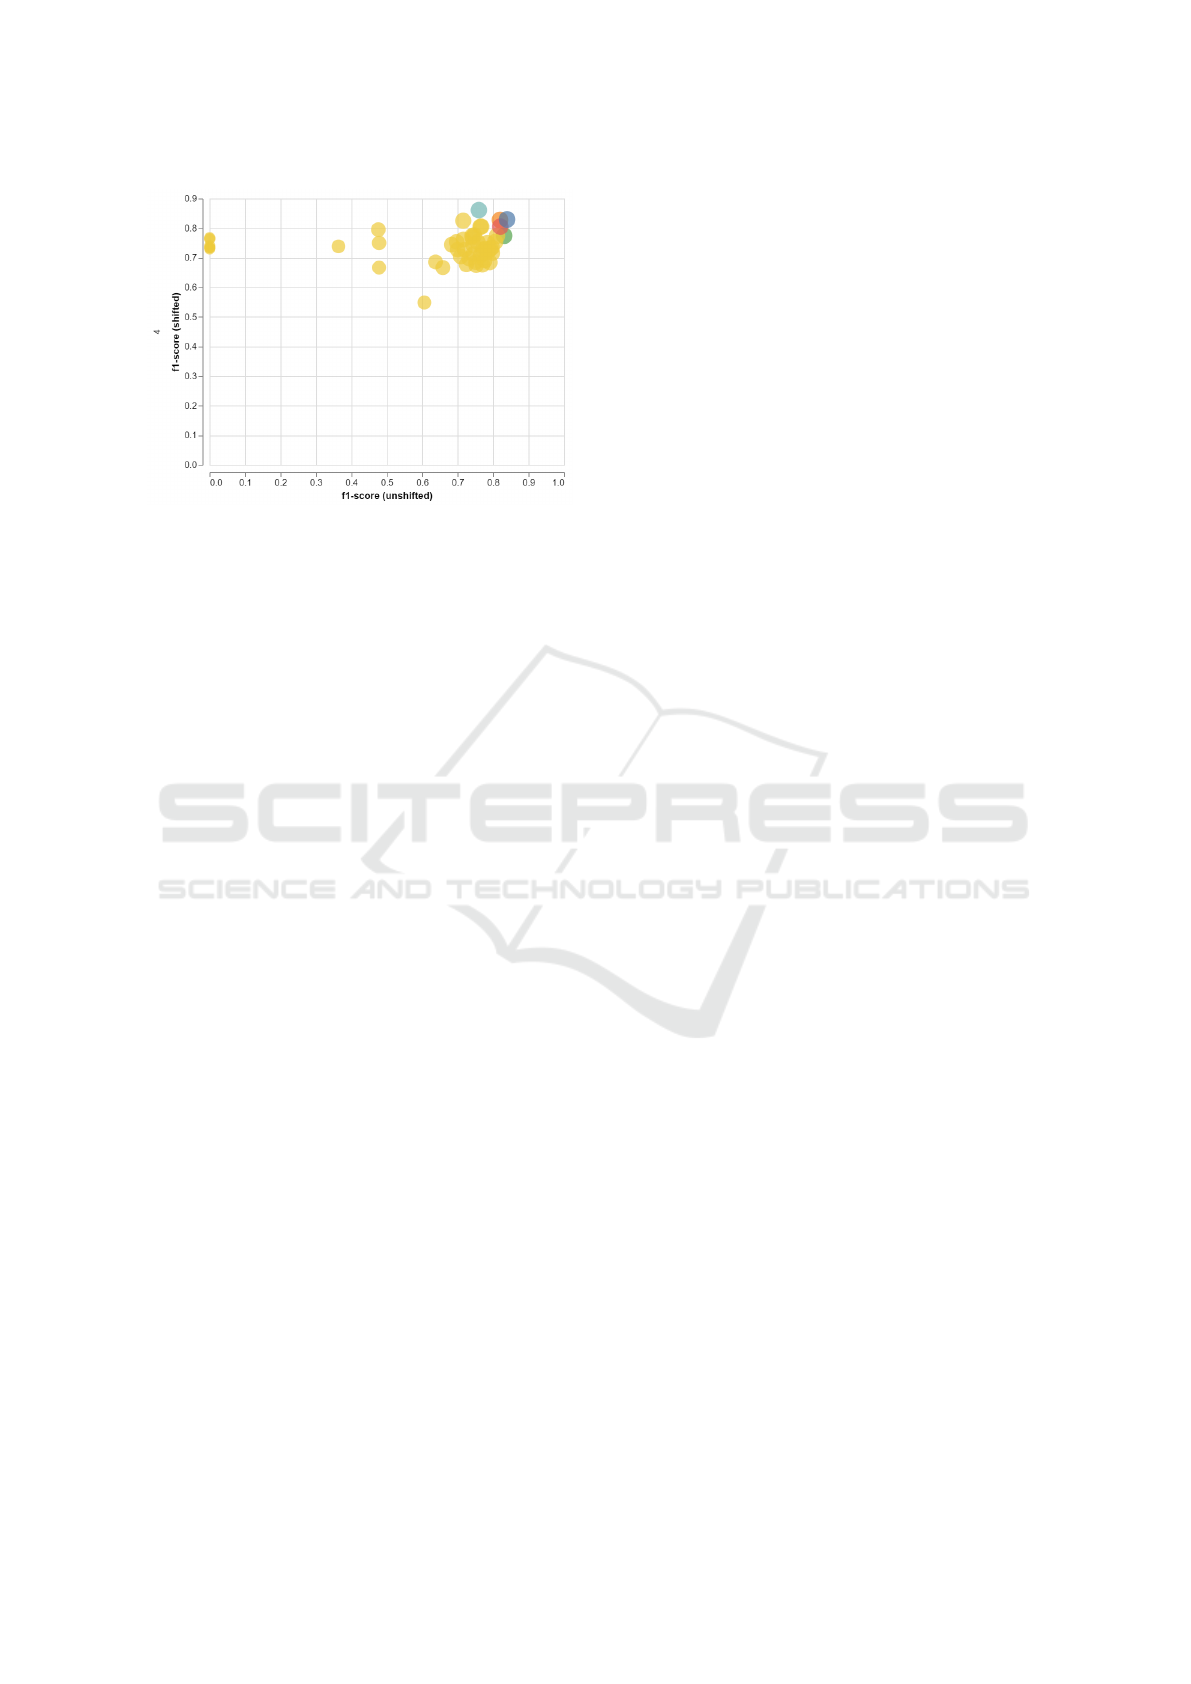
Figure 4: Subtyping Random Forest Performance (Exam-
ple).
of 3. Surprisingly, results from the Random Forest
were not affected much by underspecification; in fact,
all performances across different clusters and random
states were relatively consistent. An example perfor-
mance cluster 0 and random state 4 is shown in Figure
4.
Because there were no significant differences be-
tween each random state, random state 0 was chosen
when evaluating the neural networks. Due to the na-
ture of neural networks being time and resource in-
tensive, the neural networks were given a maximum
of 200 iterations to train on the data. Though the neu-
ral networks ended up exhibiting the same patterns as
the SVMs, the networks also ended up generally hav-
ing higher F1-scores, as seen in Figure 6.
Performance varied between the shifted and un-
shifted datasets across three repeated experiments.
The discoveries from the three models seem to indi-
cate a couple of ideas.
Firstly, Random Forests generally did not seem af-
fected by underspecification, at least with this dataset.
Perhaps the way that the bagging method is de-
signed helps with minimizing underspecification by
randomly splitting up the data into small subsets that
may have an easier focus on more biologically correct
pathways.
Secondly, the performances from SVMs and Neu-
ral Networks suggest that models trained on clusters 0
tend to have more consistently good training, while on
the other hand, models trained on cluster 2 may have
a good chance of producing generally bad models (in
terms of classifying HER2). But more importantly,
cluster 1 has a large number of models having per-
formance discrepancies between shifted and unshifted
datasets, whereas the other two clusters do not. From
the performance visualizations, it appears that clus-
ter 1 is most affected by underspecification since a
large portion of SVMs and Neural Networks. On the
other hand, cluster 2 is slightly affected and cluster 0
is hardly affected.
4.4 Model Selection
Given our understanding of the current state of the
performances of models on a variety of shifted data
configurations, we can finally fetch the PUMP’s top
ranked models. Since we were focused on addressing
the HER2 subtype, we will take the top 10 trained
classifiers in the HER2 category. The top models can
be seen in Figure 7.
5 EXTENDED APPLICATION
Though PUMP simply provides visualizations on un-
derspecification and thus does not possess the tools to
fix it, we aim to show how discoveries with PUMP
can be used to address issues with underspecifica-
tion. In the case of breast cancer subtyping, we uti-
lize the work a three-gene model (Haibe-Kains et al.,
2012) for predicting breast cancer subtypes. Although
the three-gene model was developed to classify five
breast cancer subtypes, we believe it is still applicable
to our slightly extended list of breast cancer subtypes,
which has an addition of the claudin-low subtype.
5.1 Biological Knowledge Processing
To incorporate biological knowledge into machine
learning systems, we opted to utilize the three-gene
model as a sample-sample graph. Our method
analyzes the correlation between a sample-sample
graph and potential models. PUMP can then rank
these models using this correlation with the objective
of limiting underspecification through knowledge-
driven model selection.
In the scope of the three-gene model, an adjacency
matrix was formed using the three specified gene fea-
tures (ESR1, ERBB2, AURKA) (Haibe-Kains et al.,
2012). This was accomplished by scaling the gene ex-
pression values with a min-max scaler and using the
ball-tree algorithm to generate a k-nearest neighbors
matrix, where k = 10. To calculate the adjacency ma-
trix, Euclidean distance was utilized to take advantage
of the scaled floating point values used to describe
gene expressions.
For the purposes of our work, we elected to work
with a weighted k-nearest neighbors as opposed to an
unweighted binary graph so that we could emphasize
the distance between patients. This meant that two pa-
tients would share an edge if those two patients were
k-nearest neighbors.
PUMP: An Underspecification Analysis Tool
105
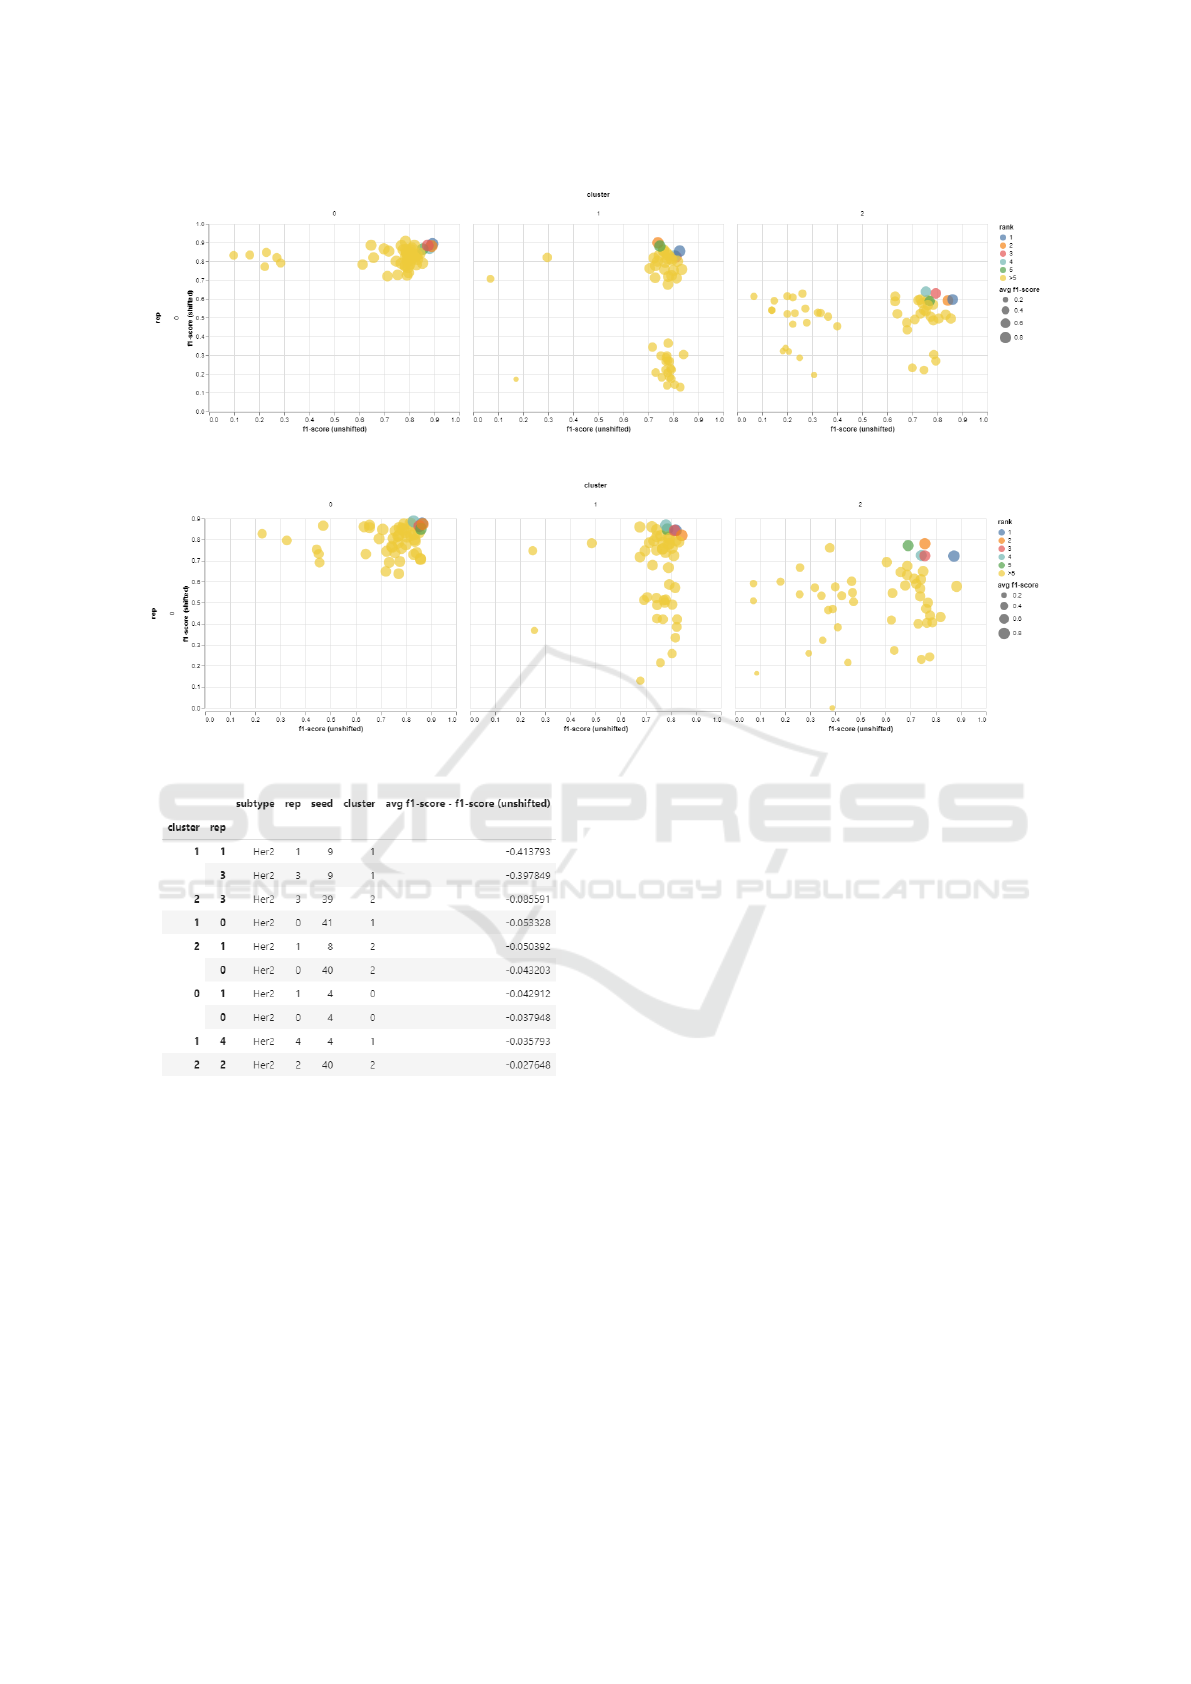
Figure 5: Subtyping SVM Performance.
Figure 6: Subtyping Neural Network Performance (Rep 0).
Figure 7: Top 10 Models on HER2.
5.2 Knowledge Correlation
Following the creation of the weighted k-nearest
neighbors sample-sample graph, we wanted to find a
way to incorporate that knowledge into a re-ranking
of the models from the ranking by PUMP. To gain a
broader understanding of the effect of knowledge on
the re-ranking of models and also to not waste com-
putation on evaluating all of the models, we selected
the top 18 models to study.
We performed a graph-to-graph comparison with
the created knowledge graph and a graph derived from
the output layer of our trained neural networks. Based
on the values found the output layer of the neural net-
works, the same type of graph (weighted, 10 near-
est neighbors) was created between the trained net-
works. With the two comparable graphs, cosine sim-
ilarity scoring was applied on both adjacency matri-
ces— this score S
knowledge
could then be factored into
the calculation for ranking models. To calculate the
new metric S
C
for the re-ranking of models, we used
Equation 2, where α = 0.5.
S
C
= αS
F1
+ (1 − α)S
knowledge
(2)
Next, Pearson correlation r was used to calculate
correlation for model ranking and S
C
(new metric for
ranking), along with model ranking and S
F1
(PUMP
metric for ranking). To understand the change in this
sample’s ranking correlation, we took the absolute in-
crease in correlation from the old ranking metric to
the new ranking metric.
As seen in Figure 8, a majority of models expe-
rience an increase in correlation when knowledge is
introduced to ranking. Furthermore, the top 3 ranked
models experience a significantly large growth in cor-
relation with the new knowledge. Over these 18 sam-
ples, there is an average 6.83% increase in Pearson
correlation r. This insight suggests that knowledge
may be influential in the selection of more general-
ized models. Moreover, this insight seems to suggest
that if knowledge were introduced to the re-training of
BIOINFORMATICS 2023 - 14th International Conference on Bioinformatics Models, Methods and Algorithms
106

Figure 8: Correlation Improvement.
models on shifted datasets, the quality of the training
would be positively affected.
6 FUTURE WORK
Though PUMP provides an easy-access method to an-
alyze underspecification, it currently does not possess
all desired functionalities. On top of that, there are
many avenues in which attempts can be made to mini-
mize underspecification and better generalize models.
6.1 System Improvements
As currently constructed, PUMP has a heavy focus
on clustering algorithms to perform analysis and to
generate shifted datasets. While relatively effective,
clustering algorithms are not the only way to do either
of the aforementioned tasks. In the future, we hope to
introduce a greater variety of algorithms to perform
these tasks so that underspecification analysis can be
more generalized to other datasets.
Aside from an increase in algorithm options, other
areas of improvement include an increase in model
options. Though SVMs, Random Forests, and Neu-
ral Networks (MLP) generally cover many use cases,
there exist many more types of prediction modeling.
In the future, we hope to include a more extensive list
of models to select as options for performance evalu-
ation.
6.2 Minimizing Underspecification
Outside of the scope of PUMP, underspecification
still exists and is yet to be addressed. In our ex-
tended application of PUMP, we illustrate how partic-
ular knowledge can be applied to breast cancer sub-
typing and how there is a good correlation between
that knowledge and more well-specified models.
In the application of sample-sample graphs, bio-
logical insight can perhaps be leveraged in machine
learning models by incorporating knowledge directly
into its training via the loss function. Examples of
such models exist, such as neural graph machines
(Bui et al., 2017) and graph convolution networks
(Kipf and Welling, 2017). Of course, models similar
to these have already been used in biomedical appli-
cations; however, the introduction of PUMP allows
for an simple way to ensure underspecification in a
dataset for a particular model is not a prevalent issue.
ACKNOWLEDGEMENTS
This study was made possible thanks to William and
Linda Frost Fund and the College of Science and
Math at California Polytechnic State University, San
Luis Obispo. Additionally, we would like to thank the
College of Engineering for their support of this work.
We would also like to acknowledge and thank the Eu-
ropean Genome-Phenome Archive for access to the
METABRIC transcriptomics and metadata dataset as
well as the authors of the DeepType study for the ini-
tial classifier algorithm. We are grateful to the Cal
Poly Bioinformatics Research Group for their assis-
tance in this research project and review of this arti-
cle.
REFERENCES
Anderson, P., Gadgil, R., Johnson, W. A., Schwab, E., and
Davidson, J. M. (2021). Reducing variability of breast
cancer subtype predictors by grounding deep learning
models in prior knowledge. Computers in Biology and
Medicine, 138:104850.
Apic, G., Ignjatovic, T., Noyer, S., and Russell, R. (2005).
Illuminating drug discovery with biological pathways.
ScienceDirect.
Bui, T., Ravi, S., and Ramavajjala, V. (2017). Neural graph
machines: Learning neural networks using graphs.
arXiv.
Burstein, M., Tsimelzon, A., Poage, G., Covington, K.,
Contreras, A., Fuqua, S., Savage, M., Osborne, K.,
Hilsenbeck, S., Chang, J., Mills, G., Lau, C., and
Brown, P. (2014). Comprehensive genomic analysis
identifies novel subtypes and targets ot triple-negative
breast cancer. NCBI.
Cascianelli, S., Molineris, I., Isella, C., Masseroli, M.,
and Medico, E. (2020). Machine learning for rna
sequencing-based intrinsic subtyping of breast cancer.
Nature.
Chen, R., Yang, L., Goodison, S., and Sun, Y. (2020). Deep-
learning approach to identifying cancer subtypes us-
ing high-dimensional genomic data. Oxford Aca-
demic.
Cornen, S., Guille, A., Adelaide, J., Addou-Klouche, L.,
Finetti, P., Saade, M.-R., Manai, M., Carbuccia, N.,
PUMP: An Underspecification Analysis Tool
107

Mekhouche, I., Letessier, A., Raynaud, S., Charafe-
Jauffret, E., and Jacquernier, J. (2014). Candidate
luminal b breast cancer genes identified by genome,
gene expression and dna methylation profiling. PLOS
ONE.
Curtis, C., Shah, S., and Aparicio, S. (2012). The ge-
nomic and transcriptomic architecture of 2,000 breast
tumours reveals novel subgroups. Nature.
D’Amour, A., Heller, K., Moldovan, D., Adlam, B., Ali-
panahi, B., Beutel, A., Chen, C., Deaton, J., Eisen-
stein, J., Hoffman, M. D., et al. (2020). Underspeci-
fication presents challenges for credibility in modern
machine learning. Journal of Machine Learning Re-
search.
Fakoor, R., Ladhak, F., Nazi, A., and Huber, M. (2013).
Using deep learning to enhance cancer diagnosis and
classification. ResearchGate.
Grapov, D., Fahrmann, J., Wanichthanarak, K., and Khoom-
rung, S. (2018). Rise of deep learning for genomic,
proteomic, and metabolomic data integration in preci-
sion medicine. OMICS.
Gupta, R., Srivastava, D., Sahu, M., Tiwari, S., Ambasta,
R., and Kumar, P. (2021). Artificial intelligence to
deep learning: machine intelligence approach for drug
discovery. Springer Link.
Haibe-Kains, B., Desmedt, C., Loi, S., Culhane, A. C., Bon-
tempi, G., Quackenbush, J., and Sotiriou, C. (2012).
A three-gene model to robustly identify breast cancer
molecular subtypes. Journal of the National Cancer
Institute, 104(4):311–325.
Kipf, T. and Welling, M. (2017). Semi-supervised clas-
sification with graph convolutional networks. In In-
ternational Conference on Learning Representations
(ICLR).
Kumar, D., Bansal, G., Narang, A., Basak, T., Abbas, T.,
and Dash, D. (2016). Integrating transcriptome and
proteome profiling: Strategies and applications. Wiley
Analytical Science.
Li, Y., Gu, J., Xu, F., Zhu, Q., Ge, D., and Lu, C.
(2018). Transcriptomic and functional network fea-
tures of lung squamous cell carcinoma through inte-
grative analysis of geo and tcga data. Scientific re-
ports, 8(1):1–12.
Patel, L., Parker, B., Yang, D., and Zhang, W. (2013). Trans-
lational genomics in cancer research: converting pro-
files into personalized cancer medicine. OMICS.
Shi, Q., Huang, S., Wang, Y., and Xue, Z. (2019). Deep
learning for mining protein data. Briefings in Bioin-
formatics.
Zhao, L., Lee, V., Ng, M., Yan, H., and Bijlsma, M.
(2018). Molecular subtyping of cancer: current sta-
tus and moving toward clinical applications. Briefings
in Bioinformatics.
BIOINFORMATICS 2023 - 14th International Conference on Bioinformatics Models, Methods and Algorithms
108
