
Image Quality Assessment for Object Detection Performance in
Surveillance Videos
Poonam Beniwal, Pranav Mantini and Shishir K. Shah
Quantitative Imaging Laboratory, Department of Computer Science, University of Houston,
4800 Calhoun Road, Houston, TX 77021, U.S.A.
Keywords:
Image Quality, Video Surveillance, Object Detection.
Abstract:
The proliferation of video surveillance cameras in recent years has increased the volume of visual data pro-
duced. This exponential growth in data has led to greater use of automated analysis. However, the performance
of such systems depends upon the image/video quality, which varies heavily in the surveillance network. Com-
pression is one such factor that introduces artifacts in the data. It is crucial to assess the quality of visual data
to determine the reliability of the automated analysis. However, traditional image quality assessment (IQA)
methods focus on the human perspective to objectively determine the quality of images. This paper focuses
on assessing the image quality for the object detection task. We propose a full-reference quality metric based
on the cosine similarity between features extracted from lossless compressed and lossy compressed images.
However, the use of full-reference metrics is limited by the availability of reference images. To overcome this
limitation, we also propose a no-reference metric. We evaluated our metric on a video surveillance dataset.
The proposed quality metrics are evaluated using error vs. reject curves, demonstrating a better correlation
with false negatives.
1 INTRODUCTION
Video surveillance is an area of research that has wit-
nessed tremendous development. The field has ad-
vanced from manual analysis of video to automatic
processing. However, the analysis systems have to
deal with several challenges, and one such challenge
is the varying image/video quality. Environmental
conditions and system characteristics can diminish
image quality. Rain, fog, etc., are environmental con-
ditions that deteriorate image quality. Image artifacts
can also be introduced during various steps of the
imaging process, including image acquisition, trans-
mission, etc. This degradation in image quality can
result in poor performance of vision algorithms. Aqqa
et al. (Aqqa et al., 2019) show a decrease in object de-
tection performance with an increase in compression.
It is essential to assess the quality of images to ensure
the reliability and robustness of automated analysis
systems.
Image quality assessment (IQA) (Zhai and Min,
2020) (Athar and Wang, 2019) objectively determines
the quality of images from a human perspective.
However, the need for automatic analysis has made
machines the end recipients of a large percentage of
visual data. Therefore, the image quality assessment
needs to consider this and determine image quality
from the machine’s perspective. Despite numerous
similarities, there are disparities between how people
and machines assess quality. For instance, deep learn-
ing models can be more biased towards texture. This
research examines the quality of images from a ma-
chine perspective. Our focus is on assessing image
quality for object detection. It is a crucial vision task
used as a standalone application as well as an inter-
mediate step for other computer vision tasks.
Image quality assessment algorithms can be clas-
sified into three categories: full-reference, reduced
reference, and no-reference. Full-reference images
compare an image to its reference image, whereas re-
duced reference need some information about the ref-
erenced image. However, reference images are not
always available, restricting the applicability of no-
reference quality metrics. In this paper, we propose
a full-reference image quality metric that determines
the quality of images for the object detection task. A
good quality image should indicate a better object de-
tector performance and vice-versa. Our method uti-
lizes the features extracted from lossless compressed
and compressed images to determine the quality of an
image. Full-reference images need a reference image
to determine the image quality, which is not always
possible. Therefore, we also propose a no-reference
image quality metric to overcome this limitation. Our
Beniwal, P., Mantini, P. and Shah, S.
Image Quality Assessment for Object Detection Performance in Surveillance Videos.
DOI: 10.5220/0011697300003417
In Proceedings of the 18th Inter national Joint Conference on Computer Vision, Imaging and Computer Graphics Theor y and Applications (VISIGRAPP 2023) - Volume 4: VISAPP, pages
345-354
ISBN: 978-989-758-634-7; ISSN: 2184-4321
Copyright
c
2023 by SCITEPRESS – Science and Technology Publications, Lda. Under CC license (CC BY-NC-ND 4.0)
345

method is based on creating a reference image and
then solving the problem in a full-reference manner.
The changes in features extracted from images some-
times do not change the object detection results. To
take this into account, we integrate the object detec-
tion results with the quality metric determined using
intermediate features. The metric is evaluated using
error vs. reject curves on a video surveillance dataset.
Overall, we make the following contributions,
1. We proposed a full-reference metric based on the
features extracted from the lossless compressed
and lossy compressed images.
2. We also proposed a no-reference metric where the
reference image is derived from a given image.
3. We evaluated various aspects of object detection
performance using error vs. reject curves.
The rest of the paper is organized as follows: Re-
lated work is defined in the second section. Full-
reference and no-reference metrics are described in
section 3. The section is followed by a discussion of
the dataset, evaluation metrics, and results. The last
section is the conclusion of the research work.
2 RELATED WORK
Over the last decades, numerous image quality met-
rics have been proposed. Deep learning-based image
quality metrics are gaining interest in recent years. A
convolutional neural network (CNN) was used (Kang
et al., 2014) to predict the quality of patches of an
image. A blind image quality assessment method is
proposed in (Pan et al., 2018) to predict the pixel-by-
pixel quality map.
Face image quality assessment (FIQA) is a
specific application within the wider field of image
quality assessment which is a very active research
area of image processing. FIQA has been mainly
developed for biometric applications. A recent survey
on face recognition algorithms is given by (Schlett
et al., 2020), and we use the categorization mentioned
in their work. We will mainly focus on the three
categories based on the Face Recognition (FR) model.
Face Recognition based Ground Truth Training.
Best-Rowden et al. (Best-Rowden and Jain, 2017)
obtained training ground truth labels from pairwise
relative human assessment and face recognition
models. Pre-trained deep learning models are used
to extract features and given as input to a support
vector regression model. FaceNet model (Schroff
et al., 2015) is used to generate ground truth labels
in (Hernandez-Ortega et al., 2019). The authors
fine-tuned a ResNet based CNN (He et al., 2016) on
ground truth to train a regression model for quality.
An identification quality (IDQ) training loss is used
to a FIQA network separately as well as a branch in
face recognition model. Ou et al. (Ou et al., 2021)
uses the distribution distance between intra-class
samples and inter-class samples to generate ground
truth labels. It computes the Wasserstein Distance
(WD) between intra-class and inter-class samples.
It trains a regression model using Huber loss to
predict the quality. They also used a pre-trained
face recognition model for training the image quality
model. LightQNet (Chen et al., 2021b) treats quality
assessment as a classification problem. Initially,
binary quality pseudo labels are generated based on
face similarity score. Predictive Confidence Network
(PCNet) uses a ResNet34 model trained for face
classification. PCNet uses a loser takes it all strategy,
and the image with worse quality defines the training
loss.
Face Recognition Based Inference. The face
recognition model uses embedding space in a latent
semantic space. Probabilistic Face Embeddings
(PFEs) (Shi and Jain, 2019) use Gaussian distribution
to represent embedding in the latent space. The
mean of the distribution estimates the most likely
feature value, while variance can be used as a
quality estimation. SER-FIQ (Terhorst et al., 2020)
proposed an unsupervised estimation of face image
quality. It creates several network variations by
applying random dropouts to the network. Quality
is determined as the sigmoid of the negative mean
of the Euclidean distances between embeddings. A
higher distance indicates a poor-quality image, and
small values indicate a good image. ProbFace (Chen
et al., 2021a) improves the recognition performance
by using robust probabilistic embedding. It adds
a constraint to penalize the variance of uncertainty
output. Multiple layers of face recognition models
are used to determine the quality. It combines
texture information from early layers and semantic
information from later layers.
Face Recognition Integration. In recent deep learn-
ing work, a new trend of combining the face recog-
nition model and FIQA as part of a single model is
emerging. Chang et al. (Chang et al., 2020) learn both
feature and uncertainty simultaneously. It learns two
models, one of them is learned from scratch, while
another improves an existing model. MegFace (Meng
et al., 2021) is one such method that learns a univer-
sal and quality-aware face representation. It explores
both the magnitude and direction of feature vectors.
VISAPP 2023 - 18th International Conference on Computer Vision Theory and Applications
346

It distributed features explicitly in the angular direc-
tion. A high magnitude means high quality. It uses a
mechanism to learn a well structured within class fea-
ture distribution. It learns both uncertainty and face
recognition features.
The amount of research done to determine the im-
age quality for object detection is limited. Kong et al.
(Kong et al., 2019) used a modified Frame Detection
Accuracy (FDA) metric for generating ground truth
labels for images. FDA is a summary metric that con-
siders different performance measures of pedestrian
detection. It calculates the overlap between ground
truth and annotations. The average overlap is normal-
ized over the average ground truth and detection num-
ber. A regression model is trained using an ensemble
of trees to predict the quality of images. Beniwal et
al. (Beniwal et al., 2022) proposed a full-reference
image quality metric for object detection. However,
the metric is not normalized and does not consider the
object detection results. To overcome this, we pro-
pose a normalized image quality metric that uses the
intermediate features and object detection output.
3 PROPOSED METRIC
In this section, we propose an image quality metric for
object detection. Our metric is based on features ex-
tracted from an image and its corresponding reference
image to compute a quality score. The proposed met-
ric should correlate with the performance of object
detection models. A high-quality image should indi-
cate the better performance of object detectors, and
a low-quality image should indicate the poor perfor-
mance of object detectors.
3.1 Full-Reference Metric
Our metric is based on the idea that compression
changes the features extracted from images, which in
turn affects the object detection outcomes. We de-
fine quality as the cosine similarity between features
extracted from an image and the corresponding ref-
erence image. Cosine similarity computes the inner
product between two vectors. Equation 1 defines the
cosine similarity.
Similarity(I, I
r
) =
F(I).F(I
r
)
||F(I)||||F(I
r
)||
, (1)
where I is a compressed image, I
r
is the correspond-
ing reference image, and Similarity is the cosine sim-
ilarity. F(I) denotes the feature extracted from an im-
age. The reference image for the quality metric is
lossless compressed image. Quality can be defined
using Equation 2
Quality
FR
= Similarity(I, I
r
). (2)
The metric values range from 0 to 1. The higher sim-
ilarity between features extracted indicates less com-
pression, consequently denoting higher quality.
One of the significant limitations of a full-
reference metric is its dependency on the reference
image. The reference image is unavailable in many
real-world scenarios, such as video surveillance sys-
tems. Therefore, full-reference metrics cannot be
used in many contexts. In such scenarios, no-
reference metrics are utilized because these metrics
use image characteristics to determine the quality of
images. These metrics aim to construct a computa-
tional model for assessing the quality of images. No-
reference metrics computation is a more difficult task
as compared to full-reference or reduced reference
metrics.
3.2 No-Reference Metric
We also propose a no-reference metric variant to over-
come the limitation of the full-reference metric. Our
proposed method is based on creating a reference im-
age for a given image. After creating a reference im-
age, the quality metric can be computed using full-
reference method. The reference image is created by
applying distortions to the given image. Compression
algorithms remove high-frequency components in the
images to achieve more compression, resulting in a
loss of texture information. If any distortion is ap-
plied to an already compressed image, the distortion
will have less impact on the image. It will result in a
high similarity between the given image and the ref-
erence image generated by distortions. However, dis-
tortion will impact good-quality images more. Figure
1 shows a video frame compressed at 3 compression
level and their corresponding blurred images.
I
d
= Dist(I), (3)
where Dist is a distortion function and I
d
is the dis-
torted image. Figure 2 shows the block diagram of
the no-reference metric. We selected blur and com-
pression operations to degrade the quality of images.
These operations impact the texture in the images,
which is crucial for the performance of deep learn-
ing models. In blur operation, each pixel is compared
to its neighboring pixel and blended with neighboring
pixels. It removes high-frequency components from
the images. We also apply JPEG (Wallace, 1992)
compression to distort images. JPEG compression is
a block based compression algorithm for images. It
Image Quality Assessment for Object Detection Performance in Surveillance Videos
347
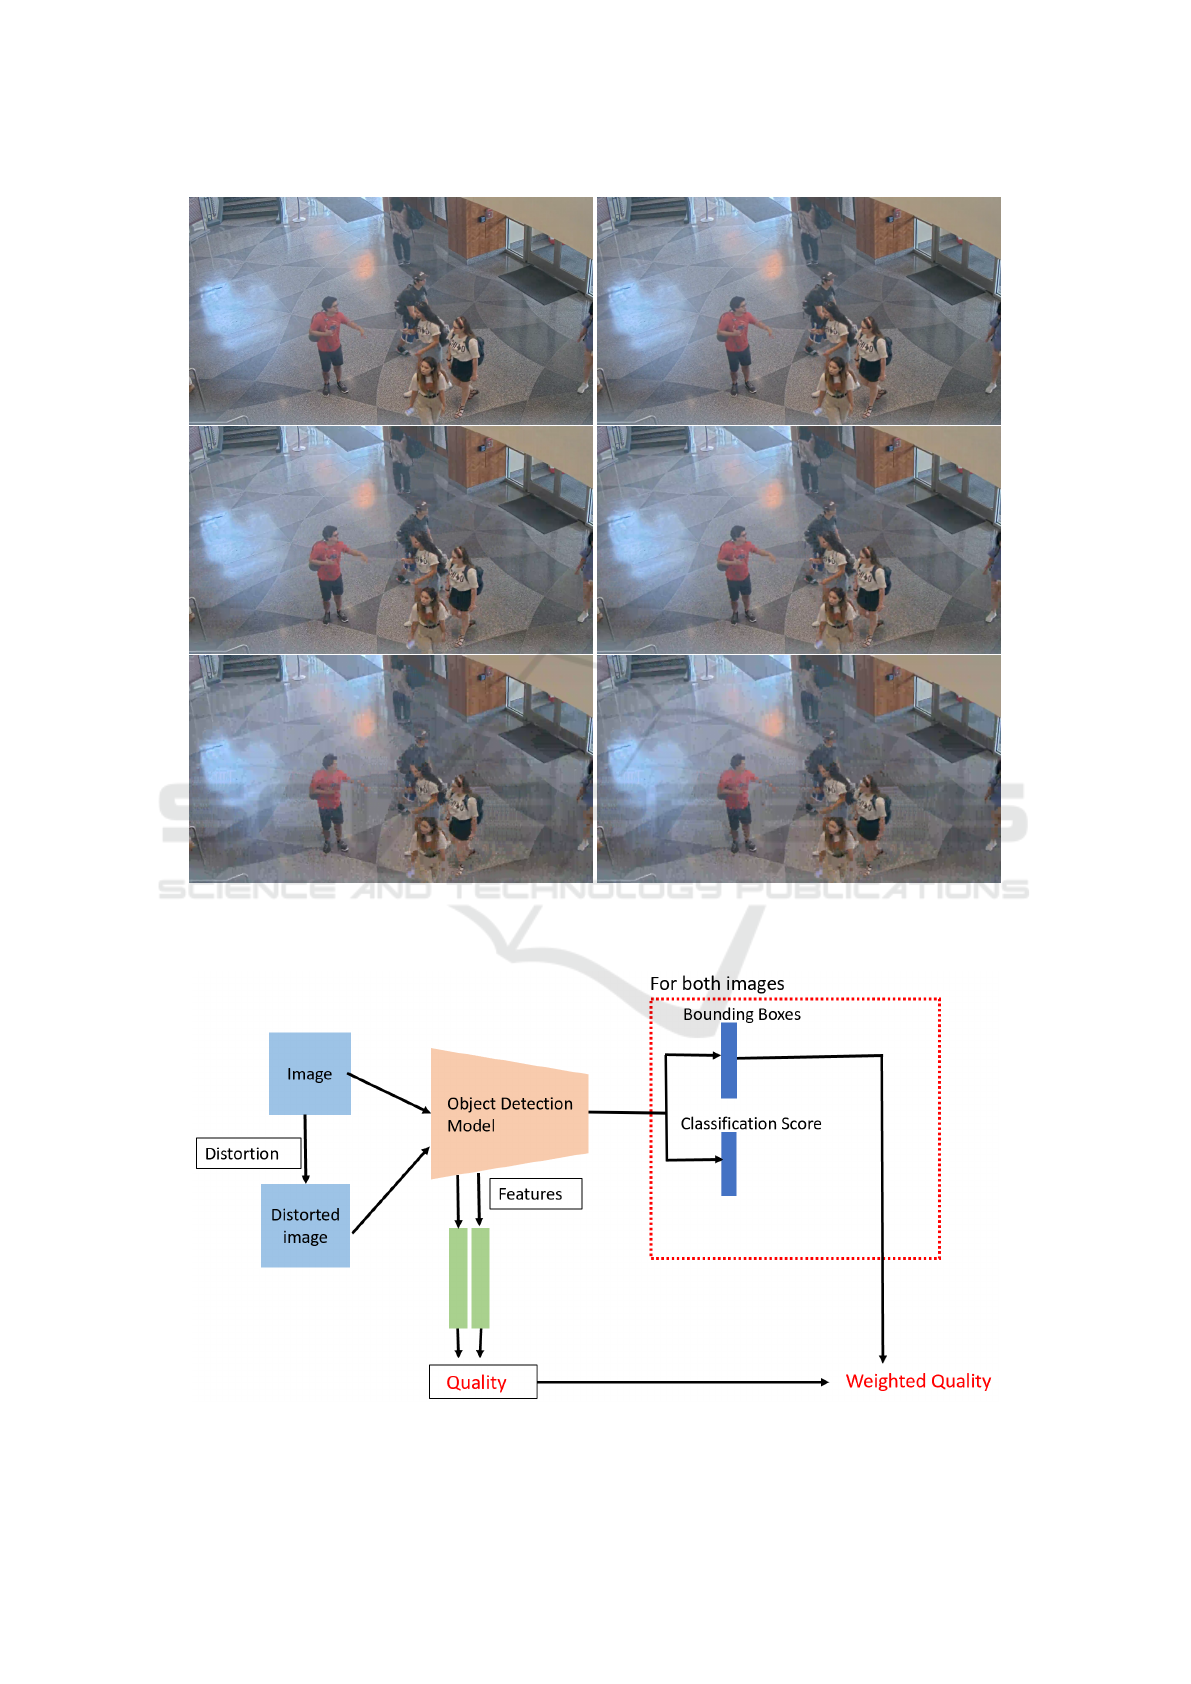
Figure 1: Example frame of video compressed using different compression parameters and corresponding distorted images.
Left column shows the images compressed with compression parameters CRF-35, CRF-41, CRF-47 respectively. Right
columns show the corresponding blurred image.
Figure 2: Block diagram of the proposed no-reference metric.
VISAPP 2023 - 18th International Conference on Computer Vision Theory and Applications
348

uses a predictive algorithm for lossless compression
and DCT for lossy compression. Cosine similarity be-
tween an image and its corresponding distorted image
is calculated using Equation 4.
Similarity(I, I
d
) =
F(I).F(I
d
)
||F(I)||||F(I
d
)||
(4)
Higher similarity indicates that a given image is al-
ready compressed, while low similarity indicates that
the image is less compressed. A low similarity score
indicates higher quality and vice-versa. No-reference
image quality can be defined using Equation 5.
Quality
NR
= 1 − Similarity(I, I
D
) (5)
3.3 Detection-Weighted Quality Metric
The proposed metrics do not consider the final out-
put of object detection into consideration. Sometimes
slight changes in the intermediate features do not im-
pact the final results of object detectors, or the impact
is insignificant. We explore the output of object de-
tectors to refine the proposed metric. The output of
object detectors is a set of bounding boxes. A class
and confidence score are associated with each bound-
ing box. False positives, false negatives and local-
ization can be defined if the ground truth is avail-
able. However, the ground truth for each image is
not always available. For example, ground truth is
not known when monitoring the performance mod-
els in deployment. Hence, we uses the classification
score associated with each bounding box to improve
our proposed metrics. Wu et al. (Wu et al., 2020)
showed that confidence score is correlated to IoU be-
tween detection and its corresponding ground truth.
At higher compression, sometimes an object is par-
tially detected, which can be reflected in the confi-
dence score. Combining the score with the proposed
metric can improve the metric. The modified metric
is defined as the weighted sum of the proposed metric
and the average confidence score as shown in Equa-
tion 6.
Weight. Quality = α ∗Quality +(1− α)∗ score, (6)
where α is the parameter used to control intermedi-
ate features’ importance, and quality is the proposed
metric. Quality can be full-reference or no-reference.
Score is defined as the average confidence score of
detections in an image.
3.4 Metric Computation
Our proposed metric utilizes features extracted from
images to compute similarity. Since we want to de-
termine the quality for object detection, we extract
features used for object detection. We used Faster-
RCNN (Ren et al., 2015) object detection model
for feature extraction. The model uses a ResNet
network that is pre-trained on image classification
dataset and then fine-tuned on the COCO (Lin et al.,
2014) dataset. The network helps to select features
that are relevant to object detection.
Object detection models use a sequence of convo-
lution layers. The initial layer of the model detects
edges in the images. The first convolution layer’s out-
put is used as a feature for computing quality. Each
convolution layer has multiple filters. We compute
the cosine similarity for each filter. Quality is defined
as the mean of cosine similarity for each filter.
We are using compression and blur to degrade the
quality of images. For compression, we used JPEG
compression with Quality Factor (QF) 5. Lower qual-
ity factors indicate higher compression in JPEG. We
used 3 kernel sizes (3, 7, 15) for applying average blur
to images.
4 EVALUATION
4.1 Dataset
We evaluated our metric on the surveillance dataset
(Aqqa et al., 2019) (Beniwal et al., 2022). The
dataset contains 11 videos from outdoor and in-
door videos and is compressed using H.264 com-
pression. For compression, two parameters (band-
width and CRF) are varied to obtain videos with var-
ious compression levels. We used four bandwidths
(1.00, 0.75, 0.50, 0.25) and three CRFs (35, 41, 47).
4.2 Evaluation Metrics
We are using a new evaluation criterion for quality
metrics. Beniwal et al. (Beniwal et al., 2022) used
the correlation between quality metrics and average
precision(AP). Average precision is not well defined
on a single image, so the correlation between the aver-
age precision of a video and the average image qual-
ity was used for evaluation. This evaluation strategy
has its limitations. First, the evaluation criterion mea-
sures correlation on the video level rather than at the
frame level. Not all the frames of a video are of equal
quality. Second average precision is a summary met-
ric that considers false positives, false negatives, and
localization. In some applications, false positives can
increase the cost of automated systems. For example,
reducing false positives is more crucial when sending
Image Quality Assessment for Object Detection Performance in Surveillance Videos
349

out security personnel in response to an alert. How-
ever, in some applications, false negatives can neg-
atively impact the algorithms’ reliability. Thus, we
decided to study the three aspects of object detection
separately.
We follow the methodology (Grother and Tabassi,
2007) of using error versus reject curves. These
curves are generally used in measuring quality met-
rics for face recognition. The curve is created by re-
jecting images based on the quality and measuring er-
rors in the remaining data. The number of rejected
images is plotted on the x-axis, and errors are plot-
ted on the y-axis. The metric that rapidly reduces the
number of errors is considered a better metric.
We want to measure false positives, false nega-
tives, and localization score in each image. Average
precision defines these three numbers at 11 threshold
values for the Intersection of Union (IoU). The pro-
cess starts with sorting detections based on the confi-
dence score. Each detection is then associated with a
ground truth based on IoU. The detection is a false
positive if the IoU is less than the threshold. This
assignment criterion creates a problem when the ob-
ject is detected partially. The partial detection will
have low confidence with the groundtruth, and the de-
tection will be classified as a false positive. Since
no detection is associated with the ground truth, it is
marked as a false negative. It created the problem of
defining false positives and false negatives. We mod-
ified this criterion to define false positives and false
negatives.
We associate a detection with each ground truth
based on a matching criterion instead of associating a
ground truth with detection. The matching criterion
is defined by IoU. If there is more than one detection
for each ground truth, one with the higher IoU is asso-
ciated with that ground truth. False positives are de-
tections for which no matching ground truth exists, or
that ground truth has already been associated with an-
other detection. Instead of using false negatives based
on a threshold, we measure localization separately.
We create the error vs. reject curves by using 100
values for the percentage of rejected images. The pro-
cess starts with sorting frames of a video based on
their quality. It rejects a certain percentage of frames
and calculates errors in the remaining frames. Since
we reject bad-quality frames, the remaining frames
should show fewer errors. A metric that reduces the
number of false negatives and false positives earlier
is considered a better quality metric. For localization,
the remaining images should have better accuracy and
should show an increase in localization.
4.3 Results
In this section, we discuss the evaluation results. We
initially compared various distortions applied to im-
ages to compute no-reference quality metrics. We
also compare the proposed metric to metrics used in
(Beniwal et al., 2022). The proposed metrics are com-
pared to the existing full-reference and no-reference
metrics. SSIM and PSNR are two full reference met-
rics we selected for comparison. We also compared
our metric to 4 no reference metrics.
4.3.1 Impact of Distortion on No-reference
Metric
The proposed no-reference metric uses distortion to
obtain a reference image. Blur and JPEG compres-
sion are used to obtain the distorted image. We used
three kernel size (3, 5, 7) for computing the blurred
image. The evaluation results on the dataset are
shown in Figure 3. The left plot shows the percent-
age of false negatives vs. the percentage of rejected
images; the middle figure shows the percentage of
false negatives vs. percentage of rejected images,
and the right figure shows the mean IoU vs. percent-
age of rejected images. The left plot shows that the
quality metric computed using JPEG compression re-
moves approximately 35% of the false negatives af-
ter rejecting 20% of the images. However, quality
computed using blur operation with kernel size 3 re-
moves 27% of the false negatives. Other variants of
quality metrics perform poorly compared to quality
using JPEG compression. All quality variants show
approximately the same performance for mean IoU.
Quality (JPEG) is not good at detecting false posi-
tives. When videos are compressed at higher com-
pression, the quality of consecutive frames differs sig-
nificantly. We evaluated proposed metrics at CRF-47
and all bandwidths. The results are shown in Figure
4. The results show that quality (JPEG) rejects 28%
of the false negatives while quality (blur) rejects 21%
of the false negatives when 20% of the images are
rejected. Our proposed metric performs better than
other metrics at higher compression.
We will focus on the no-reference quality metric
computed using JPEG compression for further analy-
sis. The metric performs better at removing false neg-
atives. To calculate the no-reference weighted metric,
we are using quality (JPEG). Since we want to focus
more on false negatives, the value of α is chosen as
0.95. It gives more importance to quality computed
using intermediate features.
VISAPP 2023 - 18th International Conference on Computer Vision Theory and Applications
350
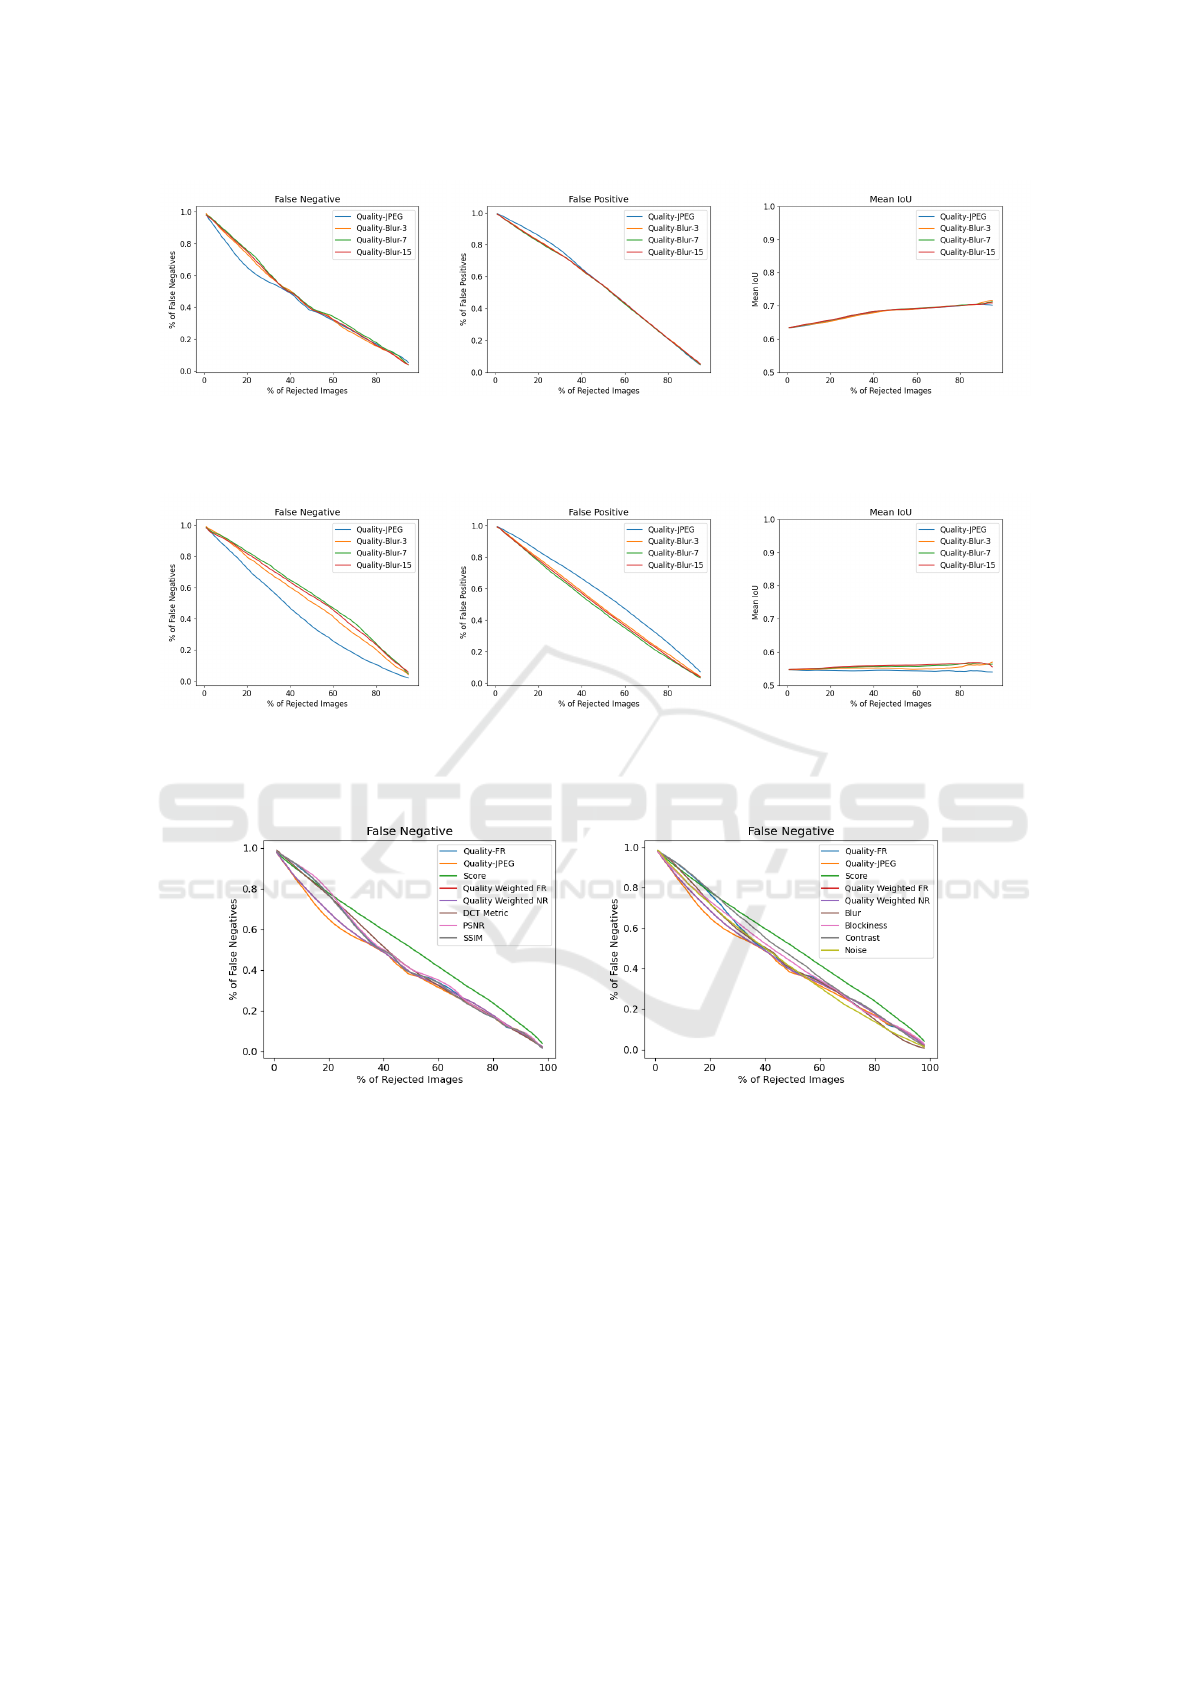
Figure 3: Performance of variants of no-reference metric on dataset compressed using 3 CRF (35, 41, 47) and 4 bandwidths:
(Left) percentage of false negatives vs. percentage of rejected image, (Middle) percentage of false positive vs. percentage
of rejected image, (Right): mean IoU vs percentage of rejected image. Quality-JPEG is the proposed metric computed using
JPEG distortion. Quality-Blur is the proposed metric computed using Blur distortion with 3 kernel sizes.
Figure 4: Performance of variants of no-reference metric on dataset compressed using CRF-47 and 4 bandwidths: (Left)
percentage of false negatives vs. percentage of rejected image, (Middle) percentage of false positive vs. percentage of
rejected image, (Right): mean IoU vs percentage of rejected image. Quality-JPEG is the proposed metric computed using
JPEG distortion. Quality-Blur is the proposed metric computed using Blur distortion with 3 kernel sizes.
Figure 5: Percentage of false negatives vs. percentage of rejected images on dataset compressed using 3 CRF (35, 41, 47) and
4 bandwidths: Proposed metric is compared to full-reference metrics (Left) and no-reference metrics (Right).
4.3.2 Image Quality for False Negatives
We follow the methodology of (Beniwal et al., 2022)
and use the same quality metrics for comparison.
We also compared our metric to the proposed met-
ric (DCT metric) in (Beniwal et al., 2022). Figure 5
compares the proposed metric with the existing image
quality metrics. The left plot compares the proposed
metrics with full-reference metrics, and the right plot
compares it with no-reference metrics. The plot
shows that the proposed no-reference metric (Quality-
JPEG) performs slightly better than the proposed full-
reference metric (Quality-FR). When 20% of images
are rejected based on the proposed no-reference met-
ric, it removes approximately 35% of false negatives,
while SSIM removes 23% of the false negatives. DCT
metric (Beniwal et al., 2022) removes approximately
24% of the false negatives. PSNR only removes 21%
of the false negatives. The proposed metric and SSIM
remove 63% and 64% of false negatives, respectively,
when 50% of the images are rejected. The plot shows
that the proposed metrics are better at rejecting false
negatives than full-reference metrics. Also, the pro-
posed no-reference metric does not need any refer-
Image Quality Assessment for Object Detection Performance in Surveillance Videos
351
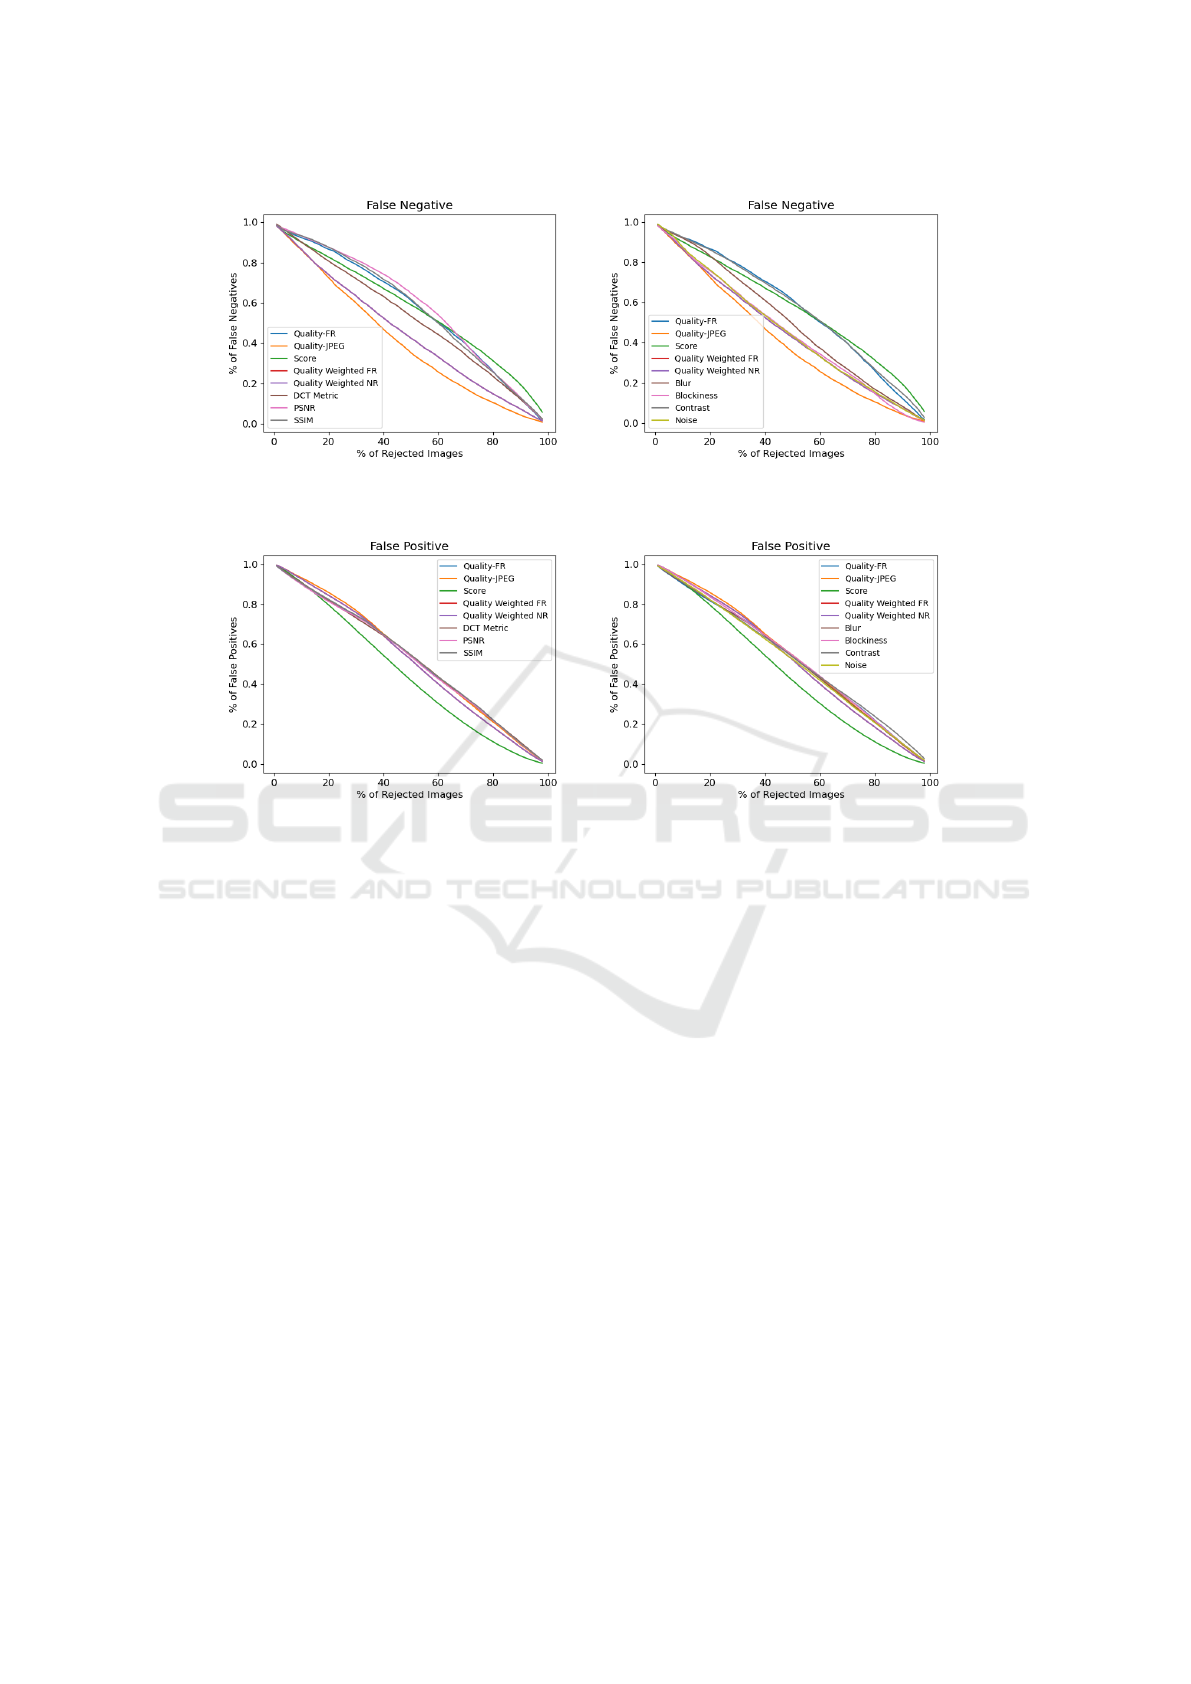
Figure 6: Percentage of false negatives vs. percentage of rejected images on dataset compressed using CRF-47 and 4 band-
widths: Proposed metric is compared to full-reference metrics (Left) and no-reference metrics (Right).
Figure 7: Percentage of false positives vs. percentage of rejected images on dataset compressed using 3 CRF (35, 41, 47) and
4 bandwidths: Proposed metric is compared to full-reference metrics (Left) and no-reference metrics (Right).
ence image for computation. The right plot compares
the percentage of false negatives in the proposed met-
rics and the no-reference metric. The plot shows that
noise and blur are the best-performing metrics among
existing quality metrics. Both metrics remove approx-
imately 28% of the false negatives after rejecting 20%
of the images. The proposed metric removes 7% more
false negatives when 20% of the images are rejected.
We also analyzed the percentage of false negatives at
higher compression. Figure 6 shows the performance
on dataset compressed using CRF-47. The proposed
metric performs better than existing full-reference and
no-reference metrics. At higher compression, the gap
in performance of the proposed metric and existing
image quality metrics increases.
4.3.3 Image Quality for False Positives
Each application has different requirements. For
some applications, the number of false positives can
create more problems. We also analyzed how good a
quality metric is in determining false positives. Figure
7 shows the plots of the percentage of false positives
vs. the percentage of rejected images. The confidence
score is the best-performing metric for reducing false
positives. Nearly all metrics perform similarly when
the number of rejected images is less than 20%. How-
ever, when more images are rejected, the confidence
metric performs better. The proposed metric is not
good at rejecting images for false positives.
4.3.4 Image Quality for Localization
Localization is another important aspect of object de-
tection. Rejecting images with poor quality should in-
crease the localization accuracy of the remaining im-
ages. The confidence score is the best metric, increas-
ing localization accuracy rapidly compared to other
metrics. The results are shown in Figure 8. PSNR
and SSIM show an IoU of 0.656 in the remaining im-
ages after rejecting 20% of the images. After remov-
ing the same number of images, the confidence score
increases the mean IoU to 0.671. The confidence
score performs better with an increase in the percent-
age of rejected images. The proposed full-reference
metric shows better performance than the proposed
no-reference metric. The proposed no-reference met-
ric also shows better performance as compared to no-
reference metrics. We also analyzed metrics perfor-
mance at higher compression; the results are shown
VISAPP 2023 - 18th International Conference on Computer Vision Theory and Applications
352
Figure 8: Mean IoU vs. percentage of rejected images on dataset compressed using 3 CRF (35, 41, 47) and 4 bandwidths:
(Left) Proposed metric is compared to full-reference metrics. (Right) Proposed metric is compared to no-reference metrics.
Figure 9: Mean IoU vs. percentage of rejected images on dataset compressed using CRF-47 and 4 bandwidths: (Left) The
proposed metric is compared to full-reference metrics. (Right) The proposed metric is compared to no-reference metrics.
in Figure 9. Confidence score and blur perform bet-
ter as compared to other metrics. These plots show
that a single metric cannot explain all aspects of ob-
ject detection performance. The proposed metric is
better at detecting false negatives. However, it is not
a good metric for detecting false positives and IoU.
The problem can be solved using a weighted quality
metric, which combines a quality metric with a confi-
dence score. The performance of weighted quality is
shown in the above plots. It increases the localization
of the remaining images with a slight compromise in
false negatives. The results also indicate that using a
combination of metrics instead of a single metric will
better predict the different aspects of object detection
performance.
5 CONCLUSIONS
In this paper, we proposed full reference and no ref-
erence image quality metrics for the object detection
task. The proposed metrics are based on the features
extracted from object detection models. We compared
the proposed metric to seven existing image quality
metrics. The results show that the proposed metrics
correlate better in determining false negatives in the
images. The image quality metric also shows better
performance at higher compression levels. The pro-
posed image quality metrics values are normalized
like SSIM. In the future, we will focus on joint im-
age quality and object detection models.
ACKNOWLEDGEMENTS
This work was supported in part by Grant No.
70NANB21H035 from U.S. Dept. of Commerce, Na-
tional Institute of Standards and Technology.
REFERENCES
Aqqa, M., Mantini, P., and Shah, S. K. (2019). Understand-
ing how video quality affects object detection algo-
rithms. In VISIGRAPP (5: VISAPP), pages 96–104.
Athar, S. and Wang, Z. (2019). A comprehensive perfor-
mance evaluation of image quality assessment algo-
rithms. Ieee Access, 7:140030–140070.
Image Quality Assessment for Object Detection Performance in Surveillance Videos
353

Beniwal, P., Mantini, P., and Shah, S. K. (2022). Image
quality assessment using deep features for object de-
tection. In VISIGRAPP (4: VISAPP), pages 706–714.
Best-Rowden, L. and Jain, A. K. (2017). Automatic
face image quality prediction. arXiv preprint
arXiv:1706.09887.
Chang, J., Lan, Z., Cheng, C., and Wei, Y. (2020). Data un-
certainty learning in face recognition. In Proceedings
of the IEEE/CVF Conference on Computer Vision and
Pattern Recognition, pages 5710–5719.
Chen, K., Lv, Q., Yi, T., and Yi, Z. (2021a). Reliable
probabilistic face embeddings in the wild. ArXiv,
abs/2102.04075.
Chen, K., Yi, T., and Lv, Q. (2021b). Lightqnet:
Lightweight deep face quality assessment for risk-
controlled face recognition. IEEE Signal Processing
Letters, 28:1878–1882.
Grother, P. and Tabassi, E. (2007). Performance of biomet-
ric quality measures. IEEE Transactions on Pattern
Analysis and Machine Intelligence, 29(4):531–543.
He, K., Zhang, X., Ren, S., and Sun, J. (2016). Deep resid-
ual learning for image recognition. In Proceedings of
the IEEE conference on computer vision and pattern
recognition, pages 770–778.
Hernandez-Ortega, J., Galbally, J., Fierrez, J., Haraksim, R.,
and Beslay, L. (2019). Faceqnet: Quality assessment
for face recognition based on deep learning. In 2019
International Conference on Biometrics (ICB), pages
1–8. IEEE.
Kang, L., Ye, P., Li, Y., and Doermann, D. (2014). Convolu-
tional neural networks for no-reference image quality
assessment. In Proceedings of the IEEE conference on
computer vision and pattern recognition, pages 1733–
1740.
Kong, L., Ikusan, A., Dai, R., and Zhu, J. (2019). Blind im-
age quality prediction for object detection. In 2019
IEEE Conference on Multimedia Information Pro-
cessing and Retrieval (MIPR), pages 216–221. IEEE.
Lin, T.-Y., Maire, M., Belongie, S., Hays, J., Perona, P.,
Ramanan, D., Doll
´
ar, P., and Zitnick, C. L. (2014).
Microsoft : Common objects in context. In Euro-
pean Conference on Computer Vision, pages 740–755.
Springer.
Meng, Q., Zhao, S., Huang, Z., and Zhou, F. (2021).
Magface: A universal representation for face recog-
nition and quality assessment. In Proceedings of the
IEEE/CVF Conference on Computer Vision and Pat-
tern Recognition, pages 14225–14234.
Ou, F.-Z., Chen, X., Zhang, R., Huang, Y., Li, S., Li, J., Li,
Y., Cao, L., and Wang, Y.-G. (2021). Sdd-fiqa: unsu-
pervised face image quality assessment with similarity
distribution distance. In Proceedings of the IEEE/CVF
Conference on Computer Vision and Pattern Recogni-
tion, pages 7670–7679.
Pan, D., Shi, P., Hou, M., Ying, Z., Fu, S., and Zhang, Y.
(2018). Blind predicting similar quality map for image
quality assessment. In Proceedings of the IEEE con-
ference on computer vision and pattern recognition,
pages 6373–6382.
Ren, S., He, K., Girshick, R., and Sun, J. (2015). Faster
r-cnn: Towards real-time object detection with region
proposal networks. In Advances in Neural Informa-
tion Processing Systems, pages 91–99.
Schlett, T., Rathgeb, C., Henniger, O., Galbally, J., Fierrez,
J., and Busch, C. (2020). Face image quality assess-
ment: A literature survey. ACM Computing Surveys
(CSUR).
Schroff, F., Kalenichenko, D., and Philbin, J. (2015).
Facenet: A unified embedding for face recognition
and clustering. In Proceedings of the IEEE conference
on computer vision and pattern recognition, pages
815–823.
Shi, Y. and Jain, A. K. (2019). Probabilistic face embed-
dings. In Proceedings of the IEEE/CVF International
Conference on Computer Vision, pages 6902–6911.
Terhorst, P., Kolf, J. N., Damer, N., Kirchbuchner, F., and
Kuijper, A. (2020). Ser-fiq: Unsupervised estimation
of face image quality based on stochastic embedding
robustness. In Proceedings of the IEEE/CVF con-
ference on computer vision and pattern recognition,
pages 5651–5660.
Wallace, G. K. (1992). The jpeg still picture compression
standard. IEEE Transactions on Consumer Electron-
ics, 38(1):xviii–xxxiv.
Wu, Y., Chen, Y., Yuan, L., Liu, Z., Wang, L., Li, H.,
and Fu, Y. (2020). Rethinking classification and lo-
calization for object detection. In Proceedings of the
IEEE/CVF Conference on Computer Vision and Pat-
tern Recognition, pages 10186–10195.
Zhai, G. and Min, X. (2020). Perceptual image quality as-
sessment: a survey. Science China Information Sci-
ences, 63(11):1–52.
VISAPP 2023 - 18th International Conference on Computer Vision Theory and Applications
354
