
GPTree: Generator of Phylogenetic Trees with Overlapping and
Biological Events for Supertree Inference
Aleksandr Koshkarov
a
and Nadia Tahiri
b
D
´
epartement d’Informatique, Universit
´
e de Sherbrooke, 2500 Boulevard de l’Universit
´
e, Sherbrooke,
Keywords:
Bioinformatics, Phylogenetics, Simulation, Tree Generator, Supertrees.
Abstract:
Summary: More and more evolutionary and molecular biologists are interested in building alternative su-
pertrees. Often, developing new approaches or testing new metrics requires relevant datasets that are not
always easy to obtain. In order to solve this problem of lack of data, we propose a new approach and devel-
oped a program in Python to generate overlapping phylogenetic trees with biological events to simplify the
process of obtaining this type of data. The new tool takes the number of phylogenetic trees the user wants to
generate, the maximum number of leaves per tree to generate, and the average level of leaf overlap between
phylogenetic trees as input parameters. The program returns to the user a set of phylogenetic trees in Newick
format, respecting the parameters given as input, in order to use them to infer a supertree (or supertrees). This
data can be an important resource for research; the user can download the generated data and use it later in
their relevant application tasks.
Availability and implementation: The generator is freely and publicly available to the entire scientific com-
munity on the GitHub platform, without any registration, https://github.com/tahiri-lab/gptree under the MIT
licence. The pipeline is written in Python 3.7.
1 INTRODUCTION
More and more phylogenetic researchers are deal-
ing with phylogenetic supertrees in order to improve
our understanding of species evolution. A supertree
is assembled from individual gene trees, but these
trees can be defined in different, but mutually overlap-
ping, sets of taxa. Studies on supertrees are essential
to reconstructing the phylogenetic trees of all living
species (i.e., the OpenTree Online project (Hinchliff
et al., 2015)). Among the unsolved problems, clas-
sification problems play an important role and have
several practical applications, i.e., the creation of the
tree of life in order to know and understand the biodi-
versity of species.
The reliability of species phylogeny can be vali-
dated through the merging of related gene trees, con-
sidering the present topological conflicts (Maddison
et al., 2007). As part of this aspect, it is possible to ex-
amine the consensus tree issue, where trees for merg-
ing are constructed for the same set of taxa, or the su-
pertree issue, where trees for merging are constructed
a
https://orcid.org/0000-0002-3630-2911
b
https://orcid.org/0000-0002-1818-208X
for different but overlapping sets of taxa. There are
a number of methods for inferring a consensus tree,
examples of which are the majority-rule consensus
trees, the extended majority-rule consensus tree, and
the strict consensus tree (Bryant, 2003). It is worth
noting that, in practice, researchers do not often work
with phylogenies on the same set of taxa, and, there-
fore, the issue of inferring a supertree becomes im-
portant (Bininda-Emonds, 2004). One approach is to
combine a collection of small phylogenetic trees with
a partial level of overlap between them into complex
supertrees (Wilkinson et al., 2007).
We should also highlight the aspects of tree clus-
tering in situations, where combining the overlapping
trees into a supertree can be performed for the iden-
tified clusters. There are a number of approaches
to tree clustering that include k-means (Stockham et
al., 2002), k-medoids (Tahiri et al., 2018), MultiPolar
Consensus (MPC) method (Bonnard et al., 2006), and
Multiple Consensus Trees (MCT) method (Gu
´
enoche,
2013). Recently, (Tahiri et al., 2022a) have intro-
duced a method for building alternative consensus
trees and supertrees using k-means and the Robinson
and Foulds (RF) distance alongside with adaptation of
212
Koshkarov, A. and Tahiri, N.
GPTree: Generator of Phylogenetic Trees with Overlapping and Biological Events for Supertree Inference.
DOI: 10.5220/0011697100003414
In Proceedings of the 16th International Joint Conference on Biomedical Engineering Systems and Technologies (BIOSTEC 2023) - Volume 3: BIOINFORMATICS, pages 212-219
ISBN: 978-989-758-631-6; ISSN: 2184-4305
Copyright
c
2023 by SCITEPRESS – Science and Technology Publications, Lda. Under CC license (CC BY-NC-ND 4.0)

several popular cluster validity indices.
Researchers who work with phylogenetic trees
and supertrees may experience a lack of availability
of datasets that they can use to test their solutions, for
example, classification, clustering, and testing new
metrics for comparing trees ((Swenson et al., 2010);
(Tahiri et al., 2022b)). In this context, the creation
of software for generating overlapping phylogenetic
trees to infer supertrees that can be used later by sci-
entists, i.e., in biology, medicine, ecology, bioinfor-
matics, may become a relevant tool for phylogenetic
studies.
Generation of a supertree through its inference
from a set of trees as the core of the solution should
have the functionality to generate phylogenetic trees
with a certain set of features, including the different
number of leaves in trees, the presence of overlap-
ping between trees, and the incorporation of biolog-
ical events, which provide the generated set with the
property of approximation to the processes of evolu-
tion rather than randomness.
2 RELATED WORK
There are various software solutions for the genera-
tion of individual phylogenetic trees based on differ-
ent approaches and with additional features incorpo-
rated. An overview of some of these implementations
is shown in Table 1.
We analyzed and tested these generators and eval-
uated the possibility of using them for the specified
task. Some applications are aimed at random tree gen-
eration, and such solutions are usually part of a larger
software product with broader functionality (e.g., a
web service (T-Rex) or a library for working with
phylogenetic trees in Python (ete3)). Most of these
simulators are capable of introducing additional fea-
tures into the generated trees, which include birth
and death events (e.g., based on the Gillespie algo-
rithm (Gillespie, 1977)) and horizontal gene transfer
(HGT). The most popular languages for the genera-
tors considered are Python, Java, and C.
None of the existing tree simulators provides the
functionality to generate phylogenetic tree sets with
partially overlapping sets of taxa, so there is a need to
propose an approach to get this kind of data (with the
possibility to use the existing simulator as a base gen-
erator). We chose the AsymmeTree library (Schaller
et al., 2022) version 2.2 as the basic simulator for gen-
erating a single tree (or a pair of species trees and
gene trees), since it is the closest option according
to the requirements we set for the tree: the availabil-
ity of evolutionary scenarios (duplication, loss, and
horizontal gene transfer events), the possibility of set-
ting additional parameters (such as loss, duplication,
and HGT rates), and the Python programming lan-
guage (this is the programming language that com-
monly used to prototype solutions using a wide range
of data and algorithm libraries for bioinformatics and
machine learning). We use ete3 library as an addi-
tional tool for working with generated trees (using the
features available in Python). It provides a possibility
to visualize the data, calculate comparison parameters
of two trees (including RF distances), and save the
generated trees in Newick format. More information
about this is in the following sections.
Special attention should be given to horizontal
gene transfer, which plays an essential role in evolu-
tion ((Dav
´
ın et al., 2018); (Wolfe and Fournier, 2018);
(Bapteste et al., 2004)) and its incorporation into the
dataset makes the data closer to realistic. Since each
gene has its own evolutionary history, which can be
represented by its own phylogenetic tree, it (the gene)
can demonstrate evolutionary patterns based, in par-
ticular, on horizontal gene transfer events (Tahiri et
al., 2022a). HGT in AsymmeTree is implemented as
follows (Schaller et al., 2022):
1. A species tree is generated.
2. A copy of a gene present at time t in any branch
of the species tree is moved to another branch of
the species tree. This branch, where the copy of
the gene is placed, is chosen uniformly among the
branches available at time t, but without consider-
ing the branch with the parent gene.
Visualization of the presence of HGT in the gener-
ated dataset will be shown in the Results and Discus-
sion section. The selected generator of a single phy-
logenetic tree with the presence of duplication, loss,
and horizontal gene transfer events was used as the
basis for the pipeline, which is described in the next
section.
3 METHODS
Several basic conditions have to be fulfilled to gen-
erate a phylogenetic tree dataset in order to obtain a
phylogenetic supertree:
1. Generation of trees with different numbers of
leaves in each tree;
2. Presence of simulated biological events in trees
(in particular, horizontal gene transfer);
3. Presence of overlaps between trees.
The level of overlap of the two trees we determine
GPTree: Generator of Phylogenetic Trees with Overlapping and Biological Events for Supertree Inference
213

Table 1: Overview of phylogenetic tree simulators. Several solutions for generating species and gene trees with the inclusion
of additional features (such as horizontal gene transfer) are presented in the table in alphabetical order (by package name).
Package name Incorporation of additional features
(in simulators)
Programming
Language
Reference
AsymmeTree Speciation, duplication, loss, gene
conversion, and horizontal gene
transfer events
Python (Schaller et al., 2022)
Castor Horizontal gene transfers, gene
duplication, and gene loss events
R (Louca and Doebeli, 2018)
ete3 (populate()
function)
Random generation Python (Huerta-Cepas et al., 2016)
GenPhyloData Gene duplication, gene loss, lateral
gene transfer, clock models, and
sequence evolution
Java (Sj
¨
ostrand et al., 2013)
HGT-gen Horizontal gene transfer Perl (Horiike et al., 2011)
HybridSim Divergence speciation, hybrid
speciation, and introgression
Java (Woodhams et al., 2016)
Ngesh Birth and death models, mutation,
and horizontal gene transfer
Python (Tresoldi, 2021)
SaGePhy Gene birth, speciation, gene
duplications, horizontal gene
transfers, and gene losses
Java (Kundu and Bansal, 2019)
SimPhy Lineage sorting, gene duplication
and loss, and horizontal gene
transfer
C (Mallo et al., 2016)
TreeSim Speciation and extinction R (Stadler, 2011)
TreeSim GM Bellman–Harris models with
lineage-specific shifts of speciation
and extinction
R (Hagen and Stadler, 2018)
T-Rex (Random
tree generator
module)
Random generation C++, web
service
(Makarenkov, 2001); (Boc
et al., 2012)
Zombi Birth-death model Python (Dav
´
ın et al., 2020)
by the following formula 1:
OL(T
1
, T
2
) =
n(T
1
, T
2
)
n(T
1
) + n(T
2
) − n(T
1
, T
2
)
, (1)
where, OL(T
1
, T
2
) is the overlap level between tree 1
(denoted T
1
) and tree 2 (denoted T
2
), n(T
1
, T
2
) is the
number of common leaves between T
1
and T
2
, n(T
1
)
is the number of leaves in T
1
, n(T
2
) is the number of
leaves in T
2
.
As mentioned above, an analysis of current solu-
tions in phylogeny and bioinformatics did not detect
the availability of dataset “generators” with the above
conditions. In this work, we propose a dataset gener-
ation pipeline of phylogenetic trees for use in gener-
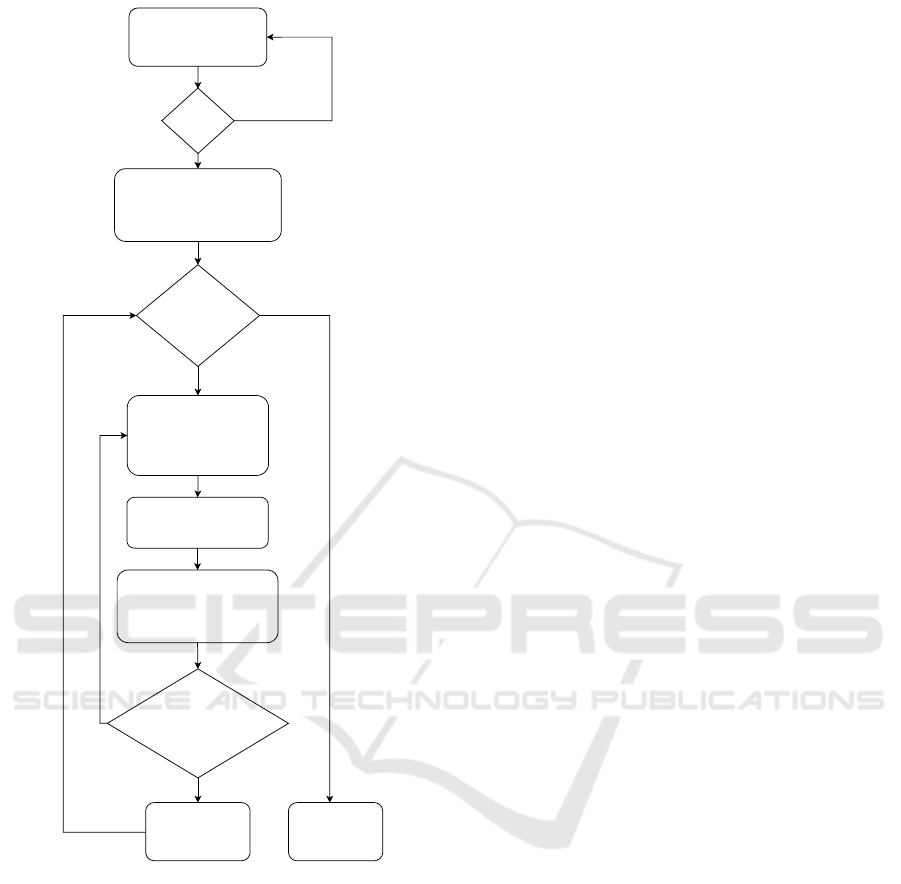
ating supertrees. A scheme of the pipeline is shown
in Figure 1.
The main steps in the proposed workflow are as
follows:
1. Input step. The user enters the initial values:
• L
min
is the minimum possible number of leaves
for each tree;
• L
max
is the maximum possible number of leaves
for each tree;
• N
gen
is the number of trees to be generated;
• p
level
is the average level of overlap (common
leaves) between the trees in the set.
2. Validation step. The input values should satisfy
the following constraints: L
min
is an integer and
5 ≤ L
min
< 500; L
max
is an integer and L
min
<
L
max
≤ 500; N
gen
is an integer and N
gen
≤ 500;
p
level
is a floating-point number in the range from
0.2 to 0.7 in increments of 0.05 (which corre-
sponds to the range from 20% to 70%).
3. Original tree step. Generate the first tree with L
max
leaves. Each tree is generated in 2 steps: first,
a species tree is generated, and then a gene tree
(with HGT) is generated on its basis. We distin-
guish separately the generation of the first tree as
BIOINFORMATICS 2023 - 14th International Conference on Bioinformatics Models, Methods and Algorithms
214
Inputs:
L
min
, L
max
, N
gen
, p
level
Generate the first tree (with initial
parameters)
N < Ngen?
Generate the number of
leaves n
l
as a random
number in the range
(L
min
, L
max
)
Generate another tree
with n
l
leaves
Calculate the average pairwise
(without repetitions) level of
overlaps
Level of overlap
in range
(p
level
-0.01;
p
level
+0.01)?
Add trees into the
dataset of generated
trees
Save generated
data (trees in
Newick format) to
text files
No
Yes
Yes
No
Validation
Error
Figure 1: The scheme of data generation. The following
values are used in this workflow: L
min
is the minimum pos-
sible number of leaves for each tree; L
max
is the maximum
possible number of leaves for each tree; N is the current
number of generated trees; N
gen
is the number of trees to
be generated; p
level
is the average level of overlap (com-
mon leaves) between the trees in the set; n
l
is the number of
leaves. The workflow uses HGT rate = 0.2 by default (this
value is within the range estimated in (Koonin et al., 2001)
based on biological data), but the user can change this pa-
rameter depending on their experience and objectives. The
principle of HGT implementation is described in the ”Re-
lated work” section. As a result, the user will get a dataset
of N
gen
gene trees, each with a number of leaves from the
range (L
min
, L
max
) with HGT incorporated. The user can
save both sets of species trees and gene trees in Newick for-
mat as text files and download them for their own purposes.
the base tree, which is used to calculate the level
of overlap with the subsequent tree. The L
max
value is used to provide a large spread in the com-
parison of leaves in trees during calculations.
4. Pairwise tree step. Generate the next tree with a
random number of leaves from the range (L
min
,
L
max
).
5. Overlap level evaluation step. Calculate the aver-
age pairwise (without repetitions) level of overlap
between trees and check how the new tree affects
the average level of overlap. If they overlap in the
specified range (p
level
− 0.01; p
level
+ 0.01), this
new tree is saved to the dataset (the user can ad-
just the size of this range). If not, return to step
4.
6. Repeat steps 4 and 5 until the dataset includes the
required number of trees (N
gen
).
7. Output step. Save the generated data (trees in
Newick format) to a text file.
The user can save two datasets as a result of this
workflow: the first dataset (main dataset) is a set of
gene trees, the second dataset is a set of species trees
(for individual purposes). In both datasets, the tree
positions in the files correspond to each other. We will
use individual pairs of trees to analyze the presence of
horizontal gene transfer events.
This workflow can be extended for the case of in-
ferring a single or multiple supertrees based on the
generated data using additional packages. One of the
most popular solutions for supertree inference is the
CLANN tool (Creevey and McInerney, 2005), which
is freely available on GitHub and widely used by a
large number of researchers. In order to perform it,
the user needs to follow several steps:
1. Dataset preparation (input): Generating phyloge-
netic trees defined on different, but partially over-
lapping sets of species, based on GPTree.
2. Prepare the input data: it can be data generated
from the GPTree generator of phylogenetic trees
with a different number of overlapping leaves.
3. Prepare a text file with commands: basic recom-
mendations are provided in the tool documenta-
tion.
4. Run CLANN.
5. Save the output data.
A sample command file with recommended parame-
ters is available on the project’s GitHub repository.
GPTree: Generator of Phylogenetic Trees with Overlapping and Biological Events for Supertree Inference
215

21
20
17
19
18
11
5
23
22
9
15
14
21
20
19
15
23
22
16
10
5
21
20
19
13
15
7
23
22
17
21
20
17
13
11
10
15
5
18
19
21
20
19
13
12
17
16
15
5
23
22
15
14
20
21
17
13
Figure 2: Visualization of 6 trees from the generated
dataset with the following parameters: L
min
=7, L
max
=12,
p
level
=0.5. Basic visual analysis shows that these trees have
different numbers of leaves (one tree has 8 leaves, three
trees have 9 leaves, one tree has 10 leaves, and one tree
has 12 leaves), and they are within the given parameters. In
addition, these trees have a certain proportion of common
leaves, and, in fact, the average level of overlap is 0.5 with
a small margin of error.
4 RESULTS AND DISCUSSION
This solution is implemented in Python and struc-
tured as an interactive Jupiter Notebook (in .ipynb for-
mat). The generator was tested in Google Colabora-
tory (Google Colab with a basic free version).
First, we generated and visualized a small number
of trees in order to show their structure (Figure 2).
The resulting image reflects the basic parameters set
by the user.
Second, we tested the functionality of the phylo-
genetic tree dataset generator with relation to three
basic parameters: the number of generated trees with
different set of leaves from the defined range, evalua-
tion of the level of overlap between trees, and analysis
of the presence of HGTs. The identified parameters
and the basic results are shown in Table 2.
Figure 3 shows a visualization of the results by the
level of overlap between trees. It should be noted that
the distribution resembles a normal distribution. The
bell-shaped curve can show us the degree of diversity
in the number of common leaves belonging to pairs of
trees. In parts (a) and (b), we may see a small number
of rare values (left and right), which actually are out-
liers. Part (b) may also help to evaluate the standard
deviation, which can be relatively large for a flat bell-
shaped distribution. The boundaries in the left and
right tails region are also estimable using formula 1
(for the cases of L
min
and L
max
number of leaves) and
considering the initial parameters set by the user.
We analyzed for the presence of horizontal gene
transfer in the generated dataset. For this purpose,
we used a random pair of species and gene trees
Table 2: Dataset generation parameters and basic results.
Actions Values
Setting parameters
• L
min
= 15;
• L
max
= 25;
• N
gen
= 50;
• plevel = 0.5
Checking the final
number of trees in the
generated dataset
• Desired number of
trees = 50;
• Real number of trees
= 50;
• Number of unique
trees in the dataset =
50
Calculation of the ac-
tual average level of
overlap between trees
• Desired level of over-
lap = 0.5;
• Average level of
overlap between
each pair of trees =
0.5
and checked for the presence of HGT using the T-
Rex web service (Boc et al., 2012). The results are
shown in Figure 4. This service utilizes a polynomial-
time algorithm with the possibility to choose between
several optimization criteria (in particular, biparti-
tion dissimilarity, Robinson and Foulds distance, and
least-squares) and a bootstrap HGT detection (Boc et
al., 2010). To infer a horizontal gene transfer sce-
nario, the user needs to provide a pair of species and
gene trees.
We observe that the generated dataset corresponds
to our criteria. It should be noted that the genera-
tor works slower for overlap levels less than 0.2 and
greater than 0.7, and therefore in the current version
of the generator the recommended value of the over-
lap level is in the range (0.2, 0.7). In future releases
of this generator, we plan to expand this range.
A version of Jupiter Notebook with code to
analyze the generated dataset and examples can
be found in the project repository on GitHub
(https://github.com/tahiri-lab/GPTree).
The inference of supertrees based on the generated
dataset is also an important subject. Depending on the
objectives of the study, we can refer to the clustering
approach, when the supertree inference is performed
on the basis of a cluster of trees. The first option is to
BIOINFORMATICS 2023 - 14th International Conference on Bioinformatics Models, Methods and Algorithms
216
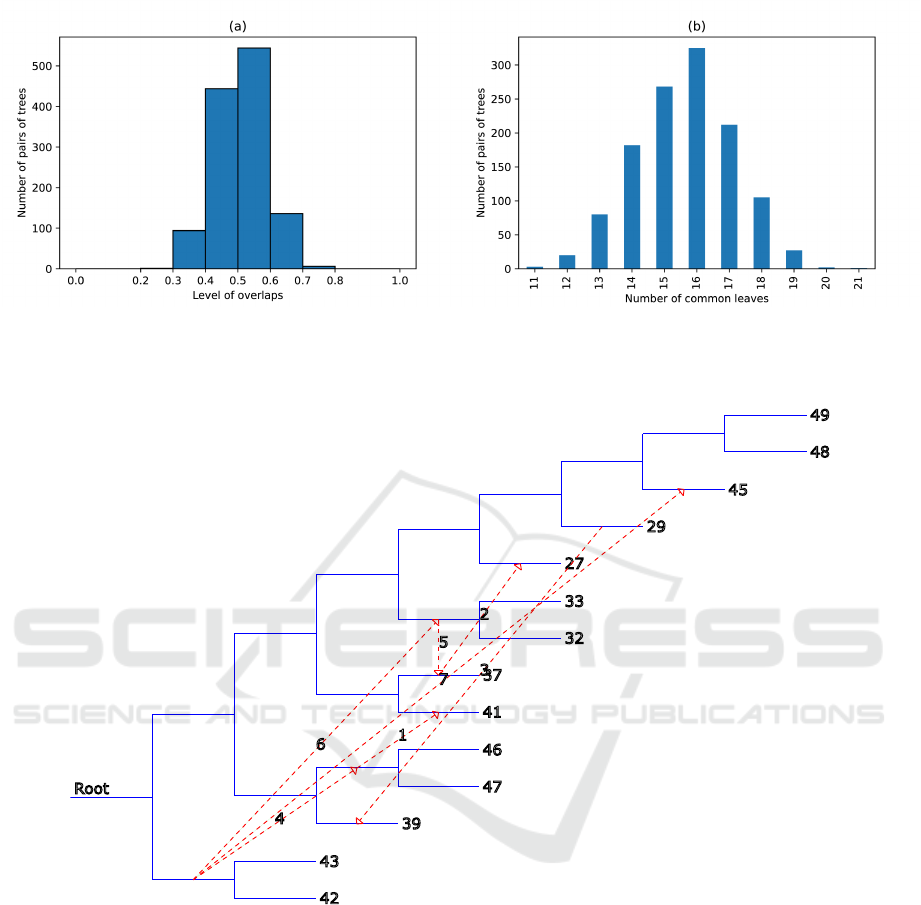
Figure 3: Visual analysis of the level of overlap in the dataset. Part (a) shows the level of overlap relative to the number of
pairs of trees. It may be observed that most of it is around 0.5 (as set by the user as initial parameters) with a slight deviation
left and right. Part (b) shows the distribution according to the number of common leaves in possible pairs of trees (without
overlaps). It can be seen that this visualization is bell-shaped with peaks in the center of the indicated range.
Root
42
43
39
47
46
41
37
32
33
27
29
45
48
49
2
3
4
5
6
7
1
Figure 4: Analysis of the presence of HGT. The results of the analysis are as follows: HGT 1: from subtree (46, 47) to subtree
(41); HGT 2: from subtree (37) to subtree (27); HGT 3: from subtree (29) to subtree (39); HGT 4: from subtree (42, 43) to
subtree (41, 46, 47); HGT 5: from subtree (32, 33) to subtree (27, 37); HGT 6: from subtree (41, 42, 43, 46, 47) to subtree
(27, 32, 33, 37); HGT 7: from subtree (27, 32, 33, 37, 41, 42, 43, 46, 47) to subtree (45). Total number of HGTs = 7. The
analysis was performed using T-Rex web service (Boc et al., 2012).
generate a large dataset, then cluster this dataset using
existing algorithms (e.g., k-means or k-medoids, see
(Tahiri et al., 2022a)) to build a supertree for each
cluster that is found. The second option is to use the
generator in a loop and generate several datasets of
clusters for each set of parameters to infer a supertree.
One of the use cases of the developed tool is the
generation of data to test new distance measures be-
tween phylogenetic trees defined on different, but mu-
tually overlapping, sets of taxa, or supertrees. Al-
though metrics between trees have been studied for
more than 40 years, the story is different for su-
pertrees since most distances were introduced in the
last decade or so. The Robinson and Foulds distance
is the most popular phylogenetic tree distance, but no
such standard is known for supertrees. On the one
side, it is possible to adapt existing metrics to com-
pare phylogenetic trees (with overlapping leaves) in
the context of clustering. This can help to effectively
use phylogenetic tree clusters to infer supertrees. On
GPTree: Generator of Phylogenetic Trees with Overlapping and Biological Events for Supertree Inference
217

the other side, this foundation can help to evaluate,
adapt and improve metrics for comparing phyloge-
netic supertrees relying on distance properties. Re-
searchers can use simulated data with incorporated bi-
ological events in such tasks.
5 CONCLUSION
The analysis and comparison of several phylogenetic
tree simulators did not reveal phylogenetic tree gener-
ators with partially overlapping taxon sets, which can
be used in problems using phylogenetic supertrees.
This paper proposes a new approach for generating
a dataset of phylogenetic trees for further use in the
building of phylogenetic supertrees. The generator
takes the minimum possible number of leaves for each
tree, the maximum possible number of leaves for each
tree, the number of trees to be generated, and the av-
erage level of overlap (common leaves) between the
trees in the set as input parameters. The output is a
dataset consisting of gene trees with incorporated bi-
ological events, including duplication, loss, and hori-
zontal gene transfer events. The trees in the generated
dataset are in Newick format.
The generator presented in this paper can be use-
ful for biologists, bioinformaticians, ecologists, and
computer scientists to conduct experiments with phy-
logenetic trees and supertrees, for example, in the
problems of developing new metrics of distance be-
tween supertrees, clustering, and classification prob-
lems. This solution is freely available in the reposi-
tory on GitHub, where there are also additional scripts
for testing the generated dataset with detailed com-
ments, and sample datasets. The possibility to run the
generator in Google Colaboratory makes it easier and
more accessible for the scientific community.
ACKNOWLEDGEMENTS
The authors would like to thank the Department of
Computer Science, University of Sherbrooke, Que-
bec, Canada for providing the necessary resources to
conduct this research.
FUNDING
The authors thank the reviewers for their valuable
comments on this paper. This work was supported
by the Natural Sciences and Engineering Research
Council of Canada, the University of Sherbrooke
grant, and the Centre de recherche en
´
ecologie de
l’UdeS (CREUS).
Conflict of Interest: none declared.
REFERENCES
Bapteste, E., Boucher, Y., Leigh, J., and Doolittle,
W. (2004). Phylogenetic reconstruction and lat-
eral gene transfer. Trends in microbiology, 12(9),
406-411.
Bininda-Emonds, O. (2004). Phylogenetic supertrees:
combining information to reveal the tree of life.
Springer Science & Business Media.
Boc, A., Philippe, H., and Makarenkov, V. (2010).
Inferring and validating horizontal gene transfer
events using bipartition dissimilarity. Systematic
biology, 59(2), 195-211.
Boc, A., Diallo, A. B., and Makarenkov, V. (2012). T-
REX: a web server for inferring, validating and
visualizing phylogenetic trees and networks. Nu-
cleic Acids Research, 40(W1), W573-W579.
Bonnard, C., Berry, V., and Lartillot, N. (2006). Mul-
tipolar consensus for phylogenetic trees. System-
atic Biology, 55(5), 837-843.
Bryant, D.(2003). A classification of consensus meth-
ods for phylogenetics. DIMACS series in dis-
crete mathematics and theoretical computer sci-
ence, 61, 163-84.
Creevey, C. and McInerney, J. (2005). Clann: inves-
tigating phylogenetic information through su-
pertree analyses. Bioinformatics, 21(3), 390-
392.
Dav
´
ın, A., Tannier, E., Williams, T., Boussau, B.,
Daubin, V., and Sz
¨
oll
˝
osi, G. (2018). Gene trans-
fers can date the tree of life. Nature ecology &
evolution, 2(5), 904-909.
Dav
´
ın, A., Tricou, T., Tannier, E., de Vienne, D., and
Sz
¨
oll
˝
osi, G. (2020). Zombi: a phylogenetic sim-
ulator of trees, genomes and sequences that ac-
counts for dead linages. Bioinformatics, 36(4),
1286-1288.
Gillespie, D. (1977). Exact stochastic simulation of
coupled chemical reactions. The journal of phys-
ical chemistry, 81(25), 2340-2361.
Gu
´
enoche, A.(2013). Multiple consensus trees: a
method to separate divergent genes. BMC Bioin-
formatics, 14, 1-7.
Hagen, O. and Stadler, T. (2018). TreeSim GM: Sim-
ulating phylogenetic trees under general Bell-
man–Harris models with lineage-specific shifts
of speciation and extinction in R. Methods in
ecology and evolution, 9(3), 754-760.
BIOINFORMATICS 2023 - 14th International Conference on Bioinformatics Models, Methods and Algorithms
218

Hinchliff, C., Smith, S., Allman, J., Burleigh, J.,
Chaudhary, R., Coghill, L., ... and Cranston, K.
(2015). Synthesis of phylogeny and taxonomy
into a comprehensive tree of life. Proceedings
of the National Academy of Sciences, 112(41),
12764-12769.
Horiike, T., Miyata, D., Tateno, Y., and Minai, R.
(2011). HGT-Gen: a tool for generating a phylo-
genetic tree with horizontal gene transfer. Bioin-
formation, 7(5), 211.
Huerta-Cepas, J., Serra, F., and Bork, P. (2016). ETE
3: reconstruction, analysis, and visualization of
phylogenomic data. Molecular biology and evo-
lution, 33(6), 1635-1638.
Koonin, E., Makarova, K., and Aravind, L. (2001).
Horizontal gene transfer in prokaryotes: quan-
tification and classification. Annual Reviews in
Microbiology, 55(1), 709-742.
Kundu, S. and Bansal, M. (2019). SaGePhy: An
improved phylogenetic simulation framework
for gene and subgene evolution. Bioinformatics,
35(18), 3496-3498.
Louca, S. and Doebeli, M. (2018). Efficient compara-
tive phylogenetics on large trees. Bioinformatics,
34(6), 1053-1055.
Maddison, D., Schulz, K., and Maddison, W. (2007).
The tree of life web project. Zootaxa, 1668(1),
19-40.
Makarenkov, V. (2001.) T-REX: reconstructing and
visualizing phylogenetic trees and reticulation
networks. Bioinformatics, 17(7), 664-668.
Mallo, D., de Oliveira Martins, L., and Posada, D.
(2016). SimPhy: phylogenomic simulation of
gene, locus, and species trees. Systematic biol-
ogy, 65(2), 334-344.
Philippe, H. and Douady, C. (2003). Horizontal gene
transfer and phylogenetics. Current opinion in
microbiology, 6(5), 498-505.
Schaller, D., Hellmuth, M., and Stadler, P. (2022).
AsymmeTree: A Flexible Python Package for
the Simulation of Complex Gene Family Histo-
ries. Software, 1(3), 276-298.
Sj
¨
ostrand, J., Arvestad, L., Lagergren, J., and
Sennblad, B. (2013). GenPhyloData: realistic
simulation of gene family evolution. BMC bioin-
formatics , 14(1), 1-5.
Stadler, T. (2011). Simulating trees with a fixed num-
ber of extant species. Systematic biology, 60(5),
676-684.
Stockham, C., Wang, L., and Warnow, T. (2002). Sta-
tistically based postprocessing of phylogenetic
analysis by clustering. Bioinformatics, 18, S285-
S293.
Swenson, M., Barbanc¸on, F., Warnow, T., and Lin-
der, C. (2010). A simulation study comparing
supertree and combined analysis methods using
SMIDGen. Algorithms for Molecular Biology,
5(1), 1-16.
Tahiri, N., Willems, M., and Makarenkov, V. (2018).
A new fast method for inferring multiple con-
sensus trees using k-medoids. BMC Evolution-
ary Biology, 18, 1-12.
Tahiri, N., Fichet, B., and Makarenkov, V. (2022).
Building alternative consensus trees and su-
pertrees using k-means and Robinson and Foulds
distance. Bioinformatics, 38(13), 3367-3376.
Tahiri, N., Veriga, A., Koshkarov, A., and Morozov,
B. (2022). Invariant transformers of Robinson
and Foulds distance matrices for convolutional
neural network. Journal of bioinformatics and
computational biology, 2250012-2250012.
Tresoldi, T. (2021). Ngesh: a Python library for syn-
thetic phylogenetic data. Journal of Open Source
Software, 6(66), 3173.
Wilkinson, M., Cotton, J., Lapointe, F., and Pisani,
D. (2007). Properties of supertree methods in
the consensus setting. Systematic Biology, 56(2),
330-337.
Wolfe, J. and Fournier, G. (2018). Horizontal gene
transfer constrains the timing of methanogen
evolution. Nature ecology & evolution, 2(5),
897-903.
Woodhams, M., Lockhart, P., and Holland, B. (2016).
Simulating and summarizing sources of gene
tree incongruence. Genome biology and evolu-
tion, 8(5), 1299-1315.
GPTree: Generator of Phylogenetic Trees with Overlapping and Biological Events for Supertree Inference
219
