
The Use of Machine Learning to Predict Hospitalization of Covid-19: A
Case Study in the State of Minas Gerais - Brazil
Gerda Graciela Rodrigues de Oliveira
a
and Cristiane Neri Nobre
b
Department of Computer Science, Pontifical Catholic University of Minas Gerais, PUC Minas - 500, Dom Jos
´
e Gaspar
Street, Corac¸
˜
ao Eucar
´
ıstico, Belo Horizonte, Brazil
Keywords:
COVID-19, Hospitalization, Machine Learning.
Abstract:
This work aims to verify the applicability of using Machine Learning techniques to predict hospitalization in
confirmed cases of Covid-19. The study also intends to discover which attributes have the most significant
impacts on hospitalization. The machine learning (ML) algorithms used in this experiment were Decision
Tree, Random Forest, Neural Networks, and Naive Bayes. The data used for this experiment were made
available by the government of Minas Gerais - Brazil, through open data. The model based on Random Forest
obtained the best results, presenting the following metrics: Precision, Recall and F1-Score of 0.85, 0.84 and
0.84, respectively. In this experiment, essential characteristics for classifying the patient’s hospitalization are
Comorbidity, Age Group, and HDI. The results point to a good predictive ability, demonstrating the potential
use of ML techniques to predict the hospitalization of people by COVID-19.
1 INTRODUCTION
The year 2020 was marked as a pandemic year. A
Pandemic is a term that signals an epidemiological
trend. Indicates that many outbreaks are happening
simultaneously and spread far and wide. The Coro-
navirus Disease 2019 (COVID-19) has hit everyone
indiscriminately. As a result of the pandemic, many
people were infected, sick, hospitalized, and admitted
to ICU, and many died.
Given the rapid transmission of the virus, there
has been an abrupt and growing additional demand
for hospitalizations worldwide, putting health sys-
tems under strain in many countries (Armstrong et al.,
2020). Brazil has the Unified Health System (SUS)
1
,
which is the largest public and universal health system
in the world, covering the entire country. About 75%
of the Brazilian population does not have a private
a
https://orcid.org/0000-0002-3521-2367
b
https://orcid.org/0000-0001-8517-9852
1
The Unified Health System (SUS) is one of the largest
and most complex public health systems in the world, rang-
ing from simple attendance to blood pressure assessment,
through from Primary Care to organ transplantation, ensur-
ing complete, universal, and free access to the entire pop-
ulation of Brazil. The SUS was created in 1988 by the
Brazilian Federal Constitution, which determines that the
State must guarantee health to the whole of the Brazilian
population.
health plan and depends exclusively on SUS (Paim
et al., 2011). In this context, the SUS was not pre-
pared to meet the demand. As a result, the country
went through a situation of the imminent collapse of
its health system due to the lack of beds in Intensive
Care Unit (ICU), equipment, essential supplies, and
health professionals to ensure adequate care for pa-
tients in severe conditions affected by the virus (San-
tos et al., 2022b).
The great concern about contracting the disease
revolves around the severity of the disease, which
is variable, with some patients presenting few or no
symptoms, some requiring hospitalization and hospi-
talization in the short, medium, or even long term, di-
rectly affecting public health. Given the above, the
big question is how to predict whether an infected per-
son will be hospitalized.
Machine Learning Models (ML) have been widely
used in health. Simply put, ML is an area of Artifi-
cial Intelligence that attributes the ability to learn au-
tomatically to computational models. Thus, the main
objective of its use in health is to use previous experi-
ences to identify patterns and provide more assertive
information for decision-making.
Given the scenario described and from the
database of confirmed cases of COVID-19, made
available by the government of Minas Gerais-Brazil,
this work has as its primary objective to verify the
392
Rodrigues de Oliveira, G. and Nobre, C.
The Use of Machine Learning to Predict Hospitalization of Covid-19: A Case Study in the State of Minas Gerais - Brazil.
DOI: 10.5220/0011696000003414
In Proceedings of the 16th International Joint Conference on Biomedical Engineering Systems and Technologies (BIOSTEC 2023) - Volume 5: HEALTHINF, pages 392-399
ISBN: 978-989-758-631-6; ISSN: 2184-4305
Copyright
c
2023 by SCITEPRESS – Science and Technology Publications, Lda. Under CC license (CC BY-NC-ND 4.0)

applicability of using ML techniques to predict the
hospitalization of patients confirmed with Covid-19,
as well as to present the most significant attributes
in this prediction. The machine learning (ML) algo-
rithms used in this experiment were Decision Tree,
Random Forest, Neural Networks, and Naive Bayes.
These algorithms were chosen because they are the
most commonly used for data classification.
The remainder of this article is organized as fol-
lows: Section 2 brings the related works; the material
and methods applied in the experiment are described
in Section 3; the last sections get the analysis of the
results, discuss and conclude the findings, indicating
limitations of the work and proposing opportunities
for further research.
2 RELATED WORKS
Jehi et al. (2020) proposed implementing a predictive
algorithm to estimate, among COVID-19 patients, the
risk of being admitted to a hospital with SARS-CoV-
2 infection based on sex, age, COVID-19 symptoms,
and comorbidities. Algorithm validation was evalu-
ated internally using resampling bootstrap (1000 rep-
etitions) to assess model discrimination and calibra-
tion. Each patient was stratified as a high, medium,
or low-risk patient for the combined outcome of hos-
pitalization and death, according to clinical and de-
mographic characteristics highlighted by two predic-
tive models developed by ATS Milan: the predictive
model for hospitalization and the predictive model for
overall mortality risk.
Gao et al. (2022) proposed MedML, a machine
learning-based framework that aims to predict hos-
pitalization and severity risk for pediatric patients
with COVID-19 using electronic health records. It
is a hybrid approach that combines medical knowl-
edge graphs and data-driven feature extraction to pre-
dict better pediatric hospitalization and the severity
of COVID-19 MedML extracts the most predictive
attributes based on medical knowledge and propen-
sity scores of more than 6 million medical concepts
and incorporates the relationships between resources
in graphs of medical knowledge through neural net-
works. As a result, MedML achieves an AUROC
2
up
to 7% higher and an AUPRC
3
14% higher compared
to the best baseline machine learning models.
Murtas et al. (2021) aimed to develop a stratifi-
cation tool to improve the management of patients
with COVID-19 and the organization of health care.
2
AUROC: area under the receiver operating character-
istic curve.
3
AUPRC: area under the curve of Precision and Recall.
To this end, a predictive algorithm was developed
and applied to 36,834 patients with COVID-19 in
Italy between March 8 and October 9, 2020, to pre-
dict their risk of hospitalization. The algorithm was
developed following TRIPOD ( Transparent report-
ing of a Multivariable Prediction Model for Individ-
ual Prognosis or diagnosis). Exposures considered
were age, sex, comorbidities, and symptoms associ-
ated with COVID-19 (e.g., vomiting, cough, fever, di-
arrhea, myalgia, asthenia, headache, anosmia, ageu-
sia, and dyspnea). As a result, the predictive model
showed an excellent fit to predict hospitalization for
COVID-19 and a good overall prediction accuracy
score of Brier
4
(0.14).
3 MATERIALS AND METHODS
In this section, we will present the method adopted
to predict the hospitalization of patients confirmed
by Covid-19 in a Brazilian state. The methodology
involves selecting and extracting the database, pre-
processing the dataset, and evaluating metrics. Figure
2 illustrates the steps of the methodology adopted in
this work.
Figure 1: Adopted methodology.
3.1 Obtaining the Database
The database used is available in the form of open
data by the government of Minas Gerais - Brazil.
According to the data dictionary, Table 1, the data
4
Score Brier is a function that measures the accuracy of
probabilistic predictions. The lower the Brier score is for a
set of predictions, the better the predictions. Its equation is
presented as follows:
BS =
1
n
×
∑
n
i=1
(pp
i
− po
i
)
2
where n = the number of prediction-observation pairs; pp =
predicted probability of occurrence of the event, and so is
the observed probability of occurrence of the event (zero,
the event did not occur, and one the event did happen).
The Use of Machine Learning to Predict Hospitalization of Covid-19: A Case Study in the State of Minas Gerais - Brazil
393

extraction was performed from the official govern-
ment systems SIVEP Grip (Severe Acute Respira-
tory Syndrome Notification System (SARS)), Esus-ve
(tool for recording the notification of suspected cases
of Covid-19) and REDCAP (RESEARCH ELEC-
TRONIC DATA CAPTURE, a sophisticated platform
for collecting, managing and disseminating research
data). Data were updated until June 8, 2022, and ex-
tracted from the site
5
on the same date.
The understanding of the base was carried out
based on the available data dictionary, as well as a
qualitative or quantitative analysis of the base. Two
of the three available spreadsheets were used for this
work. The first contains 500,001 records, and the sec-
ond includes 88,101 records, thus totaling 588,102
records and 21 attributes.
3.2 Database Preprocessing
The pre-processing of the database can be defined as
a set of activities that involve the preparation, orga-
nization, and structuring of the data. It is an essential
step that precedes the accomplishment of the analyses
and predictions since it will be decisive for the qual-
ity of the data analyzed. The following subsections
describe each pre-processing step performed.
3.2.1 Selection of Attributes
Attribute selection performs a primary task and
aims to select the more important attributes since
non-relevant and/or redundant features can re-
duce the accuracy used by machine learning algo-
rithms. For this work, the selection was made
from understanding the data contained in Table
1. Of the 21 constant attributes, seven features
and one class were selected. The selected at-
tributes were: MICRO, DATE NOTIFICATION,
SEX, AGE, DATE 1st SYMPTOM, RACE, CO-
MORBIDITY, and the HOSPITALIZATION class.
3.2.2 Data Cleanup
The database may contain irrelevant or missing data.
To deal with this situation, it is necessary to perform
data cleaning. Both researchers and practitioners have
recognized the need to detect errors, repair, and rea-
son about querying and analyzing dirty and inconsis-
tent data (Ilyas and Rekatsinas, 2022). In the case
of the data presented, the instances containing miss-
ing data or “Not informed” conditions were removed,
and the removal of inconsistent values were. A total
of 112,917 instances were excluded in this process, so
5
https://coronavirus.saude.mg.gov.br/
after cleaning the data, the base was left with 475,185
records.
3.2.3 Transformation, Normalization, and
Discretization of Data
This step transforms the original data into more ap-
propriate and suitable formats for machine learning
algorithms. This is important, as some algorithms
only work with numerical value entries, unable to pre-
dict others types of data entries. At this stage, the
URS attribute was discarded, and the micro attribute
was used because it had a more significant number
of responses (89 different responses). This attribute
MICRO (Microregion) has been transformed into two
new attributes, namely: Population and HDI ( Human
Development Index) footnote The Human Develop-
ment Index (HDI) is a general and synthetic measure
used to classify the degree of economic development
and the quality of life of countries. It was created
in 1990 and published annually since 1993 by the
United Nations Development Program – UNDP. The
HDI varies on a scale from 0 to 1. The closer to 1,
the greater the human development.. This informa-
tion was collected from data provided by the IBGE
(Brazilian Institute of Geography and Statistics). For
the HDI, there was no need to take any action since it
is already normalized data.
The ‘POPULATION’ attribute was presented in
absolute value according to each microregion. The
same was discretized in 3 bands: small, medium, and
large. For the small population, a value of fewer
than 50 thousand inhabitants was considered; for the
medium-sized population, values equal to or greater
than 50,000 inhabitants and less than 100,000 inhabi-
tants were considered; for the large population, a pop-
ulation similar to or greater than 100,000 inhabitants
was considered.
The “GENDER” attribute was coded as Female =1
and Male =0.
The RACE attribute was binarized and trans-
formed into five columns, white, brown, black, yel-
low, and indigenous, thus representing the presence
or absence of the characteristic.
The AGE attribute was discretized as follows:
Children = Under 12 years old, Adolescents = 12 to
18 years old
6
, Young = 19 to 29 years old
7
, Adults =
6
These transformations carried out for children and
adolescents were created according to the ECA (Child and
Adolescent Statute). The ECA was made through Federal
Law n
o
8.069, July 13, 1990, which regulates article 227 of
the Federal Constitution of 1988.
7
The transformation to “youth” is following the Youth
Statute. This statute was created through Federal Law No.
12,852, of August 5, 2013.
HEALTHINF 2023 - 16th International Conference on Health Informatics
394

Table 1: Data dictionary of the database provided by the government of a Minas Gerais - Brazil.
ATTRIBUTE DESCRIPTION
ID Unique exam code
URS Name of the URS (Regional Health Unit) where the test was performed. There is the possibility of 28 different
answers regarding the URS of the Brazilian State considered
MICRO Name of the Microregion in which the exam was performed. There is the possibility of 89 different answers
regarding the Microregions of the Brazilian State considered
MACRO Name of the Macro-region where the exam was performed. There is the possibility of 14 different answers
regarding the Macroregions of the Brazilian State considered
NOTIFICATION DATE Date of notification of the patient’s Exam result
CLASSIFICATION CASE Result of the exam performed by the patient (if is a confirmed case for COVID-19)
GENDER Gender of the patient who underwent the examination (male, female or not informed)
AGE Age of the patient who took the exam
AGE GROUP Patient’s age group
CITIES RESIDENCE Name of the patient’s municipality of residence. In this field, there is the possibility of 853 different answers
CODE IBGE code related to the patient’s municipality of residence. There is the possibility of 853 different answers.
EVOLUTION Evolution of the patient’s condition
EVOLUTION DATE Date of evolution of the patient’s condition
DATE 1 SYMPTOM Date of 1st symptoms of the case.
HOSPITALIZATION Situation of hospitalization in the patient’s clinical bed
UTI Situation of the patient’s ICU bed admission
RACE Patient’s race
ETHNICITIES Names of indigenous ethnicities. Name and ethnicity code of the patient, when indigenous
COMORBIDITY Presence or absence of patient comorbidity
DATE UPDATE Data regarding update data Status
SOURCE INFORMATION Laboratory that performed the examination of the patient
30 to 59 years old, Elderly = 60 years old or older
8
.
For the attributes “NOTIFICATION DATE” and
“DATA 1
o
SINTOMA” two new columns were cre-
ated, being the month and year.
The COMORBIDITY attribute has the answers
“Yes”, “No”, and “Not informed” (considered miss-
ing data). thus was binarized as follows: Yes =1 and
No =0.
An attribute called “ILLNESS TIME” was cre-
ated, which is the calculation of the difference be-
tween the attributes “NOTIFICATION DATE” and
“DATE 1
o
SYMPTOM”. Negative values or values
greater than 150 days were considered inconsistent
and were removed from the database. This time was
normalized using the Min-Max method.
According to Ciaburro et al. (2018), min-max nor-
malization performs a linear transformation on the
original data. This technique gets all data scaled in
the range (0, 1), Equation 1.
X
Scaled
=
X − X
min
X
max
− X
min
(1)
Also, according to Ciaburro et al. (2018), the min-
max normalization preserves the relationships be-
tween the original data values. The cost of limiting
this range is that we will end up with more minor
standard deviations, which can suppress the effect of
outliers.
8
According to the Elderly Person Statute, it was created
by Federal Law No. 10,741 of October 1, 2003.
Thus, after these pre-processing steps, the base
presented 475,185 instances, 15 input attributes,
and 1 Class attribute. The attributes are POPU-
LATION, HDI, DATE-NOT-MONTH, DATE-NOT-
YEAR, GENDER, AGE GROUP, DATE-1-SINT-
MONTH, DATE-1-SINT-YEAR, ILLNESS TIME,
COMORBIDITY, BROWN RACE, RACE WHITE,
YELLOW RACE, BLACK RACE, INDIGENOUS
RACE, and HOSPITALIZATION class.
3.2.4 Redundancy Elimination
Redundancy in machine learning preprocessing is the
presence of attributes that are highly correlated with
each other. Removing redundancy is helpful because
it can reduce training time and increase model accu-
racy. Furthermore, eliminating redundancy can sim-
plify the model, making it easier to interpret.
The drop duplicates() function was used to ex-
clude redundant data from the database, which elimi-
nates equal instances from the database. In this way,
the unique values in the base were kept; that is, there
was no data loss. In this process, we went from
475,185 instances to 185,742; approximately 61% of
the database corresponds to repeated cases.
3.2.5 Missing Data Imputation
After removing the redundancy, missing data (null)
was evaluated. There are different methods of imput-
ing missing data. In this case, the KNNImputer was
The Use of Machine Learning to Predict Hospitalization of Covid-19: A Case Study in the State of Minas Gerais - Brazil
395

used, which assigns the missing values using the Eu-
clidean distance. KNNimputer is a scikit -learn class
used to fill in or predict missing values in a dataset.
The n neighs =2 (number of data points to be included
closer to the missing value) was used as a parameter
for this process.
3.3 Description of Methods
The study was conducted according to the workflow
shown in Figure 2. To obtain the best predictive ca-
pacity, models based on four ML algorithms were
used: Decision Tree, Random Forest, Neural Net-
works, and Naive Bayes. The models were imple-
mented in Python using the scikit-learn learning li-
brary, developed explicitly for the practical applica-
tion of Ml. After some tests, we present the hyperpa-
rameters used in the experiment. The system’s default
hyperparameters were utilized for the Naive Bayes
method.
The following hyperparameters were used for the
Decision Tree: Criterion = ‘entropy’ (the criterion
for measuring the quality of a division); Max depth
= 5 (the maximum depth of the tree); Max features
= ‘auto’ (the maximum number of features to be con-
sidered for the best split); Min samples leaf = 7 (the
minimum number of samples needed to be in a leaf
node); Min samples split = 6 (the minimum number
of the samples required to split a node); Splitter =
‘random’ (the criterion used to choose the best divi-
sion).
For Neural Networks, the following hyperparam-
eters were used: Activation = ‘relu’ (Activation func-
tion for hidden layer); Alpha = 0.001 (Regularization
Term); Hidden layer sizes = 20 (Number of neurons
in the hidden layer); Learning rate init = 0.001 (Ini-
tial learning rate); Max iter = 700 (Maximum num-
ber of iterations); Solver = ‘adam’ (algorithm for op-
timization).
For Random Forest, the following hyperparame-
ters were used: n estimators= 100 (the number of
trees); Criterion = ‘entropy’, (the criterion used to
measure the quality of a node’s split); Max depth =
10 (the maximum depth of the tree); Max features =
10 (the number of features to consider when looking
for the best split); n jobs=5 (the number of cores to
be used to build the trees).
3.4 Model Quality Assessment Metrics
The following metrics will be used to measure the
quality of the models: Recall
9
, Precision
10
, and F-
9
Recall =
T P
T P+F N
10
Precision =
T P
T P+F P
measure
11
.
For the evaluation of the quality of the learn-
ing models, 10% of the data was reserved for test-
ing. In the remaining 90% of the data, 10-fold cross-
validation was applied. Figure 2 presents a summary
of the entire process performed.
4 RESULTS AND DISCUSSIONS
The coronavirus is one of the pathogens that act on
the human respiratory system, causing severe acute
respiratory syndrome (SARS) and Middle East res-
piratory syndrome (MERS), and it is considered a
pathogen of great importance to public health (Rothan
and Byrareddy, 2020). Since the first case of SARS-
CoV-2 infection, modeling the epidemic growth pat-
tern has been crucial to understanding the pandemic’s
evolution and guiding the implementation of preven-
tion and control measures (Sciannameo et al., 2022).
The outbreak caused by the coronavirus was de-
clared in Brazil a pandemic, on March 11, 2020,
by the World Health Organization (WHO) and, thus,
brought significant challenges to public health. In
Brazil, the first case of COVID-19 was confirmed on
February 26, and the first death on March 17. Fur-
thermore, the Brazilian Ministry of Health recognized
national community transmission on March 20, 2020
(Santos et al., 2022a).
Regarding clinical manifestations, the Epidemio-
logical Surveillance Guide of the Brazilian Ministry
of Health (da S
´
aude do Brasil, 2021) clarifies that
SARS-CoV-2 infection can range from asymptomatic
cases and mild clinical manifestations to moderate,
severe, and critical conditions. It also highlights that
although most people with covid-19 develop mild
(40%) or medium (40%) symptoms, approximately
15% may develop severe symptoms that require oxy-
gen support, and about 5% may have the necessary
form of the disease. In this situation, the individ-
ual may experience complications such as respiratory
failure, sepsis and septic shock, thromboembolism,
and multiple organ failure, including acute liver or
heart damage, requiring intensive care. These same
rates are presented by the World Health Organization
(Organization et al., 2020).
According to the Hospital Policy and Manage-
ment Observatory (OPGH) (Albuquerque, 2021), in
2020, there was an increase of almost 55% compared
to 2019 in hospitalization for treatment of infectious
and parasitic diseases (IPD) in the SUS and was the
first cause of hospitalization in 2020.
11
F-measure = 2 ×
Precision×Recall
Precision+Recall
HEALTHINF 2023 - 16th International Conference on Health Informatics
396
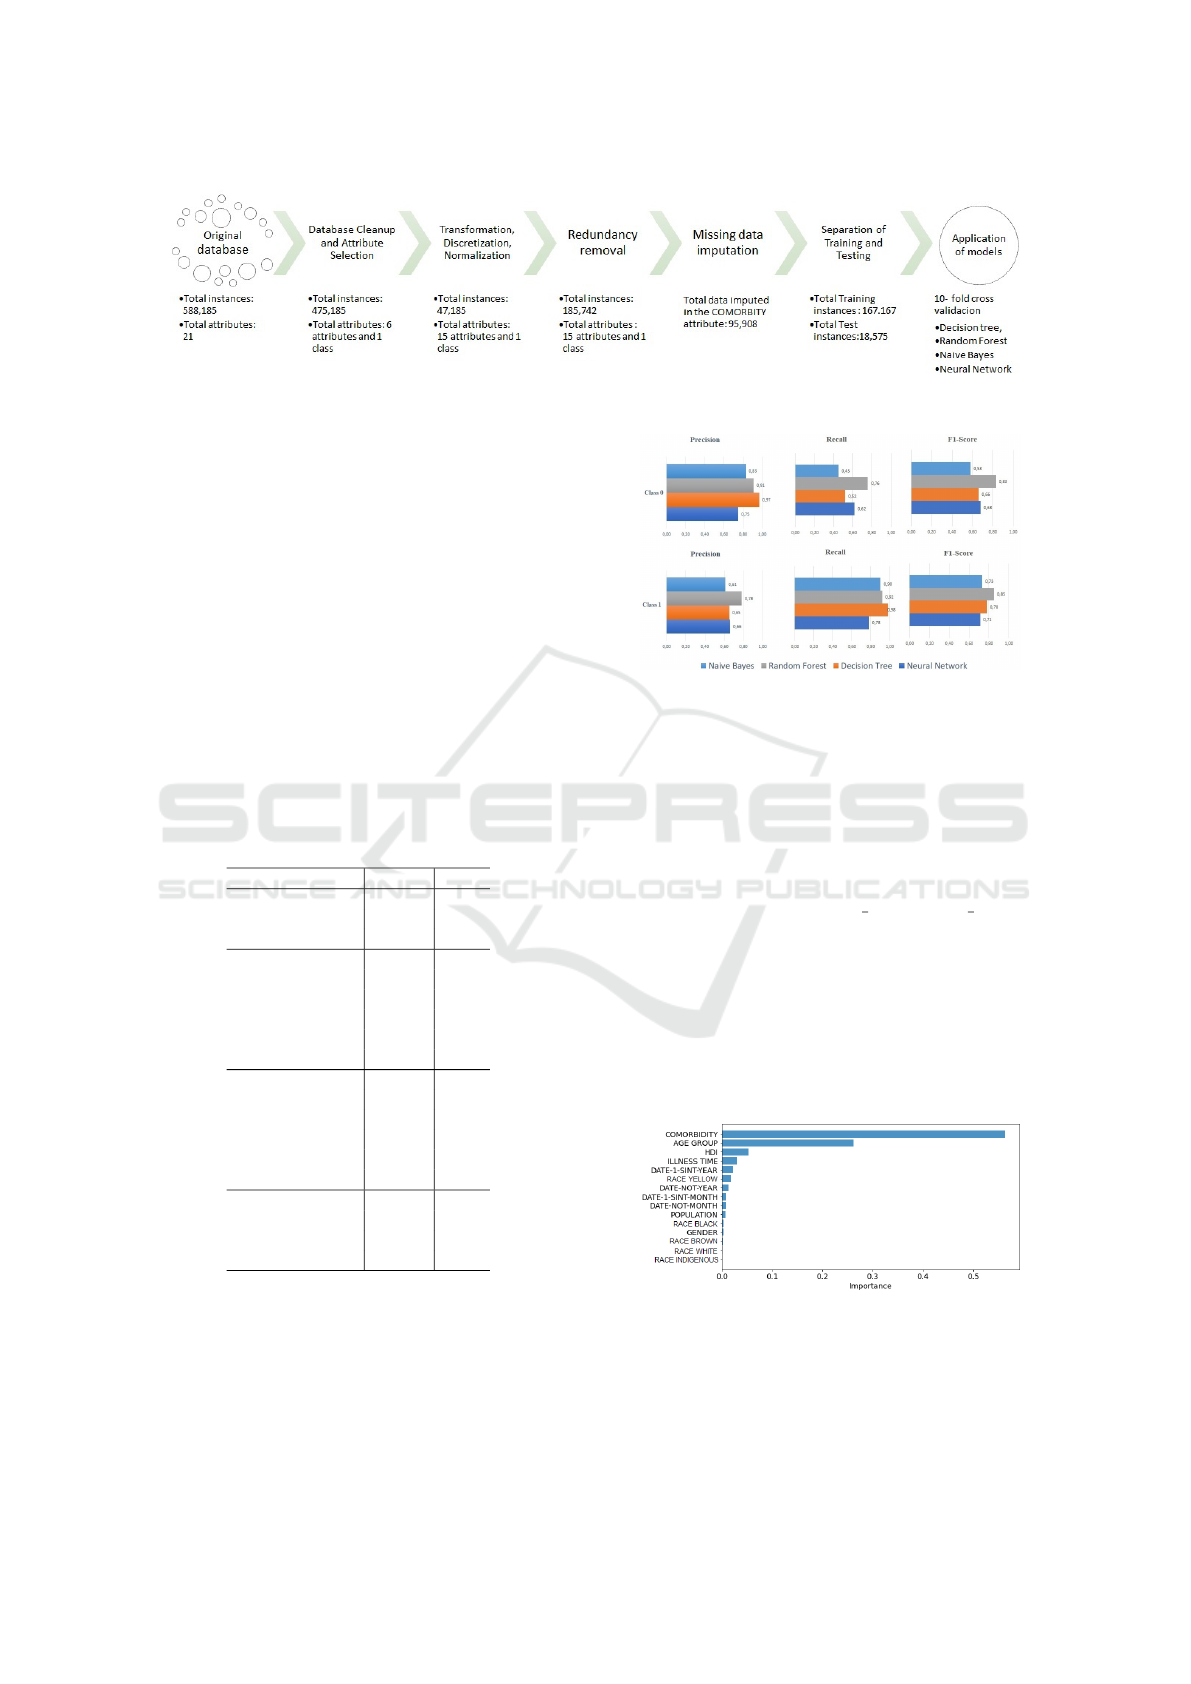
Figure 2: Methodology used in data processing.
At different times, the COVID-19 pandemic in
Brazil led the health system to exhaust its installed
capacity. Thus, it became necessary to capture the ex-
tent of the damage and build knowledge to subsidize
care reorganization choices to deal with unmet routine
needs and the new demands imposed by Covid. So, it
is essential to trace the pattern of use in the Unified
Health System (SUS) hospital network during this
pandemic(Portela et al., 2021). Analyzing this pattern
will enable more assertive decision-making regarding
the patient’s hospitalization.
For the analyzed dataset, we executed the mod-
els of the five proposed ML methods (Decision Tree,
Random Forest, Neural Networks, and Naive Bayes)
to understand the profile of people hospitalized for
COVID-19. Table 2 shows the demographic data of
the study.
Table 2: Demographic questions.
Question N %
Gender
Male 93,042 50.09
Female 92,700 49.91
Age group
12 less 10,467 5.64
12 to 18 9,961 5.36
19 to 29 27,656 14.89
30 to 59 74,121 39.91
60 or more 63,537 34.21
Race
White 80,335 43.25
Brown 76,385 41.12
Black 20,985 11.30
Yellow 7,725 4.16
Indigenous 312 0.17
Population
50k less 31,879 17.16
50k to 99.999 52,052 28.02
100k or more 101,811 54.81
Observing Figure 3, which presents the results of
the testing phase of the prediction models, the model
based on Random Forest obtained the best results,
considering that the model has an excellent predictive
capacity for this dataset. Thus, we used the Random
Forest method to discuss the results better.
Figure 3: Comparison of performance in tests of prediction
models.
After choosing the model, it is necessary to un-
derstand the quality of its results and make the model
results more explainable. To this end, the importance
of each attribute selected by the model for the predic-
tion was verified, where the most critical feature was
comorbidity, followed by age group.
The importance of each attribute was calculated
using Random Forest’s feature importances method.
This method is applied to Random Forest models and
returns a list containing the importance of each fea-
ture for the model. The importance of attributes is
calculated according to the average impurity reduc-
tion when a decision vertex is divided on an element.
The importance of the attributes was displayed
through a bar graph (Figure 4), where the length of
the rectangle represents the weight of the feature.
Figure 4: Importance of attributes.
This graph represents the weight of each attribute
for the classification of a patient’s hospitalization.
Thus, in this experiment, essential characteristics for
classifying the patient’s hospitalization are: Comor-
The Use of Machine Learning to Predict Hospitalization of Covid-19: A Case Study in the State of Minas Gerais - Brazil
397
bidity, Age Group, and HDI.
Feitoza et al. (2020) state that about 20% to
51% of patients with COVID-19 were detected with
a chronic disease already installed. Ranzani et al.
(2021) shows in its study that a large proportion, 74%,
of hospitalized patients with COVID-19 in Brazil had
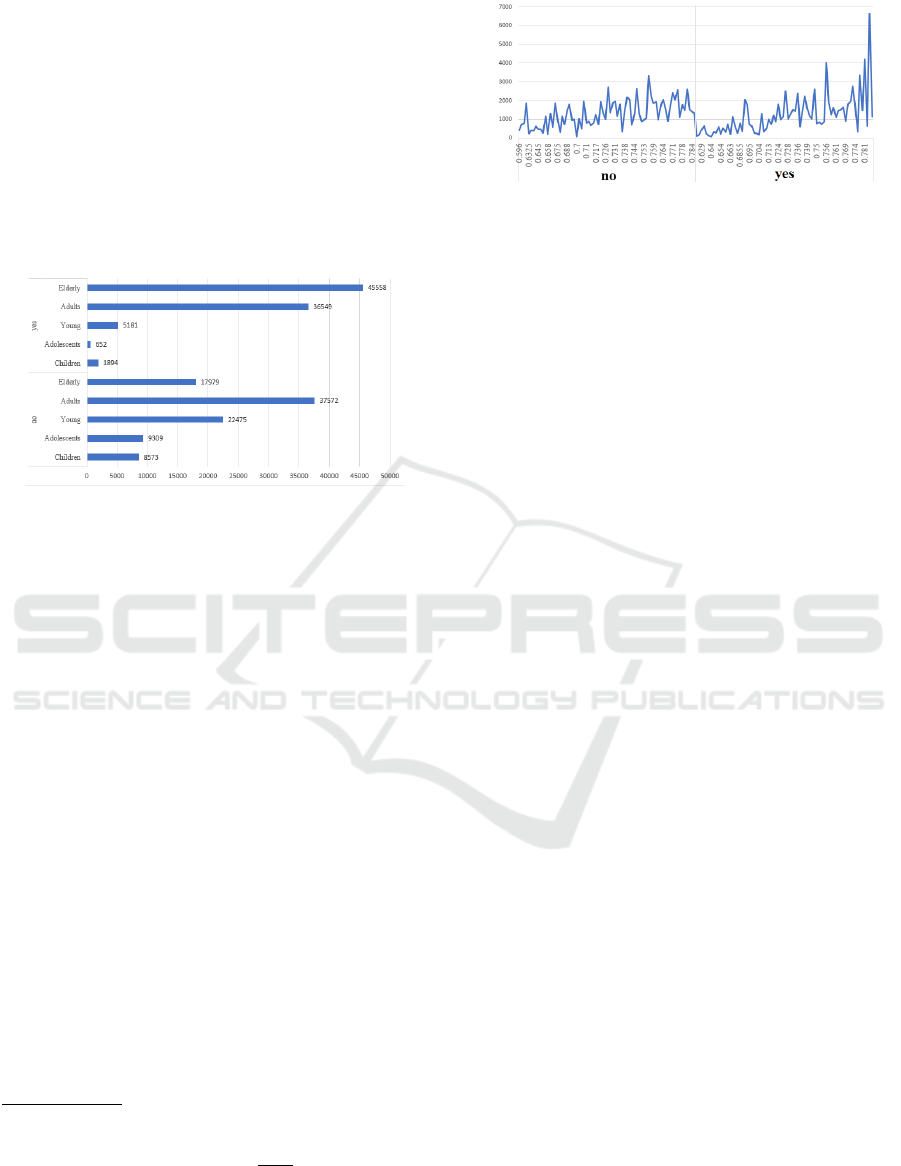
one or two comorbidities. Regarding the Age Group,
it can be seen in Figure 5, taken from the database,
that the elderly and adults have a greater tendency
to be hospitalized by Covid-19 than children, adoles-
cents, and young people.
Figure 5: Age group by class.
Lana et al. (2021) presented in tgeir study the
over-risk calculation and the incidence rate of hos-
pitalization and deaths per thousand inhabitants for
Covid-19 by gender, age group, and comorbidity. The
study shows that from the age group of 45-49 years
(SRfe
12
= 1.133), there is a gradual increase in the
risk of hospitalization, reaching SRfe = 8.466 among
those aged 90 years or older, which demonstrates that
age is a strong and well-established risk factor for
hospitalization and death from COVID-19.
Regarding the HDI Maciel et al. (2020) analyzed
the spatial distribution of the incidence of Covid-19
and its correlation with the municipal human devel-
opment index (MHDI) of municipalities in a Brazilian
state. They concluded that the incidence of COVID-
19 was heterogeneous and unequally distributed for
the Brazilian state studied and that the cities with the
highest coefficients of incidence of COVID-19 had
higher MHDI values. Thus, HDI can be presented
as a relevant factor for the patient with Covid-19.
The graph represented by Figure 6, drawn from
the data of this study, collaborates with the findings
above and shows the increase in hospitalization and
the rise to the increase in HDI.
12
SRfe = The stratified over-risk is defined for group i
with the denominator of the incidence rate for the age group
(fe) in question, that is, SR
i
( f e) =
Θ
i
, f e
Θ
0
, f e
, where Θ
i
, f e and
Θ
0
, f e represent the incidence rate of group i and the gen-
eral population for the age group of interest. The SRE
i
( f e)
distribution for group i has derived analogously to the over-
risk distribution for group i.
Figure 6: HDI by class.
The analysis showed a positive correlation be-
tween the incidence of hospitalization for Covid-19
and the HDI; that is, increases in the HDI also in-
crease the incidence of hospitalization for Covid-19.
5 FINAL CONSIDERATIONS
This work demonstrates the potential use of ML tech-
niques to predict hospitalizations for COVID-19. The
results presented in this study are considered promis-
ing since the ML models performed well in classify-
ing patients. In addition, ML models showed results
on time, which is extremely important regarding re-
sponse time. Therefore, ML models can be used as
additional tools in decision-making regarding patients
hospitalized for COVID-19.
Implementing an ML model can provide a more
accurate assessment of the hospitalization of a pa-
tient with COVID-19 and assist the health agent in
decision-making. If systematically implemented, and
with the breadth of clinical data collected, it is be-
lieved that better identification and care of patients
infected by COVID-19 will be possible.
As a suggestion for future work, the ML models
presented in this study can be improved with other
ML hyperparameters and/or methods, such as the
Deep Neural Network, which gives a better represen-
tation of data and, therefore, can help to improve the
performance of the model. In addition, other open
datasets can also be analyzed to understand better the
profile of patients hospitalized for COVID-19.
5.1 Study Limitation
Knowing that the clinical spectrum of COVID-19 is
vast, the a priori clinical knowledge about the asso-
ciations between symptoms and hospitalization for
COVID-19 was limited for this study since the field
“Comorbidity” presented only the yes or no values.
Thus, we can point out that the major limitation of
this research is the lack of data for an evaluation of
other important variables in this predictive process,
such as the patient’s clinical condition, diabetes, high
HEALTHINF 2023 - 16th International Conference on Health Informatics
398

blood pressure, chronic kidney disease, fever, cough,
shortness of breath, fatigue, lung disease, among oth-
ers.
ACKNOWLEDGEMENTS
This study was financed in part by the Coordenac¸
˜
ao
de Aperfeic¸oamento de Pessoal de N
´
ıvel Superior –
Brasil (CAPES) – Finance Code 001. The authors
thank the National Council for Scientific and Techno-
logical Development of Brazil (CNPq - Conselho Na-
cional de Desenvolvimento Cient
´
ıfico e Tecnol
´
ogico)
and the Foundation for Research Support of the Minas
Gerais State (FAPEMIG). The work was developed
at the Pontifical Catholic University of Minas Gerais,
PUC Minas.
REFERENCES
Albuquerque, C. (2021). Pandemia diminui n
´
umero e muda
perfil de internac¸
˜
oes no sus em 2020. Dispon
´
ıvel
em: https://observatoriohospitalar.fiocruz.br/debates-
e-opinioes/pandemia-diminui-numero-e-muda-perfil-
de-internacoes-no-sus-em-2020. Acesso em:01 de
julho de 2022.
Armstrong, R., Kane, A., and Cook, T. (2020). Out-
comes from intensive care in patients with covid-19: a
systematic review and meta-analysis of observational
studies. Anaesthesia, 75(10):1340–1349.
Ciaburro, G., Ayyadevara, V. K., and Perrier, A. (2018).
Hands-on machine learning on google cloud plat-
form: Implementing smart and efficient analytics us-
ing cloud ml engine. Packt Publishing Ltd.
da S
´
aude do Brasil, M. (2021). Guia de vigil
ˆ
ancia
epidemiol
´
ogica para covid-19. Dispon
´
ıvel em:
https://coronavirus.saude.mg.gov.br/images/1
2021/17-
03-Guia de vigilancia da covid 16marc2021.pdf.
Acesso em:01 de julho de 2022.
Feitoza, T. M. O., Chaves, A. M., Muniz, G. T. S., da Cruz,
M. C. C., and Junior, I. d. F. C. (2020). Comorbidades
e covid-19. Revista Interfaces: Sa
´
ude, Humanas e
Tecnologia, 8(3):711–723.
Gao, J., Yang, C., Heintz, J., Barrows, S., Albers, E.,
Stapel, M., Warfield, S., Cross, A., Sun, J., et al.
(2022). Medml: Fusing medical knowledge and
machine learning models for early pediatric covid-
19 hospitalization and severity prediction. Iscience,
25(9):104970.
Ilyas, I. F. and Rekatsinas, T. (2022). Machine learning and
data cleaning: Which serves the other? ACM Journal
of Data and Information Quality (JDIQ), 14(3):1–11.
Jehi, L., Ji, X., Milinovich, A., Erzurum, S., Merlino, A.,
Gordon, S., Young, J. B., and Kattan, M. W. (2020).
Development and validation of a model for individual-
ized prediction of hospitalization risk in 4,536 patients
with covid-19. PloS one, 15(8):e0237419.
Lana, R. M., Freitas, L. P., Codec¸o, C. T., Pacheco, A. G.,
Carvalho, L. M. F. d., Villela, D. A. M., Coelho, F. C.,
Cruz, O. G., Niquini, R. P., Porto, V. B. G., et al.
(2021). Identificac¸
˜
ao de grupos priorit
´
arios para a
vacinac¸
˜
ao contra covid-19 no brasil. Cadernos de
Sa
´
ude P
´
ublica, 37.
Maciel, J. A. C., Castro-Silva, I. I., and Farias, M. R. d.
(2020). An
´
alise inicial da correlac¸
˜
ao espacial entre a
incid
ˆ
encia de covid-19 e o desenvolvimento humano
nos munic
´
ıpios do estado do cear
´
a no brasil. Revista
brasileira de epidemiologia, 23:e200057.
Murtas, R., Morici, N., Cogliati, C., Puoti, M., Omazzi, B.,
Bergamaschi, W., Voza, A., Querini, P. R., Stefanini,
G., Manfredi, M. G., et al. (2021). Algorithm for indi-
vidual prediction of covid-19–related hospitalization
based on symptoms: Development and implementa-
tion study. JMIR Public Health and Surveillance,
7(11):e29504.
Organization, W. H. et al. (2020). Oxygen sources and dis-
tribution for covid-19 treatment centres: interim guid-
ance, 4 april 2020. Technical report, World Health
Organization.
Paim, J., Travassos, C., Almeida, C., Bahia, L., and
Macinko, J. (2011). The brazilian health system:
history, advances, and challenges. The Lancet,
377(9779):1778–1797.
Portela, M. C., de Aguiar Pereira, C. C., Lima, S. M. L.,
de Andrade, C. L. T., and Martins, M. (2021). Patterns
of hospital utilization in the unified health system in
six brazilian capitals: comparison between the year
before and the first six first months of the covid-19
pandemic. BMC Health Services Research, 21(1):1–
13.
Ranzani, O. T., Bastos, L. S., Gelli, J. G. M., Marchesi,
J. F., Bai
˜
ao, F., Hamacher, S., and Bozza, F. A. (2021).
Characterisation of the first 250 000 hospital admis-
sions for covid-19 in brazil: a retrospective analysis
of nationwide data. The Lancet Respiratory Medicine,
9(4):407–418.
Rothan, H. A. and Byrareddy, S. N. (2020). The epidemi-
ology and pathogenesis of coronavirus disease (covid-
19) outbreak. Journal of autoimmunity, 109:102433.
Santos, L. G., da Silva, R. V., Leal, T. C., Xavier, J. E.,
de Souza Figueiredo, E. V. M., de Paiva, J. P. S.,
da Silva, L. F., de Oliveira Rocha, C. A., Nunes, B. E.
B. R., de Almeida Santana, G. B., et al. (2022a). Im-
pact of the covid-19 pandemic on hospital admissions
and in-hospital lethality from cardiovascular diseases
in brazil: an ecological and time series study covid-
19 and cardiovascular diseases. Current Problems in
Cardiology, page 101216.
Santos, P. P. G. V. d., Oliveira, R. A. D. d., and Albuquerque,
M. V. d. (2022b). Desigualdades da oferta hospitalar
no contexto da pandemia da covid-19 no brasil: uma
revis
˜
ao integrativa. Sa
´
ude em Debate, 46:322–337.
Sciannameo, V., Goffi, A., Maffeis, G., Gianfreda, R.,
Pagliari, D. J., Filippini, T., Mancuso, P., Giorgi-
Rossi, P., Dal Zovo, L. A., Corbari, A., et al. (2022).
A deep learning approach for spatio-temporal fore-
casting of new cases and new hospital admissions of
covid-19 spread in reggio emilia, northern italy. Jour-
nal of Biomedical Informatics, 132:104132.
The Use of Machine Learning to Predict Hospitalization of Covid-19: A Case Study in the State of Minas Gerais - Brazil
399
